. 2024 Jan 16;5(1):101348.
doi: 10.1016/j.xcrm.2023.101348. Epub 2023 Dec 26.

Exercise-induced crosstalk between immune cells and adipocytes in humans: Role of oncostatin-M

Affiliations

Exercise-induced crosstalk between immune cells and adipocytes in humans: Role of oncostatin-M

Lucile Dollet et al. Cell Rep Med. .

Abstract

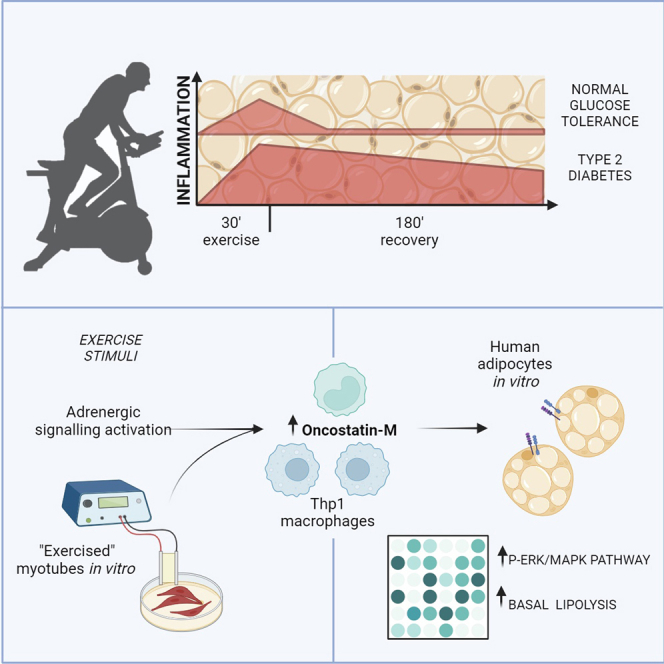
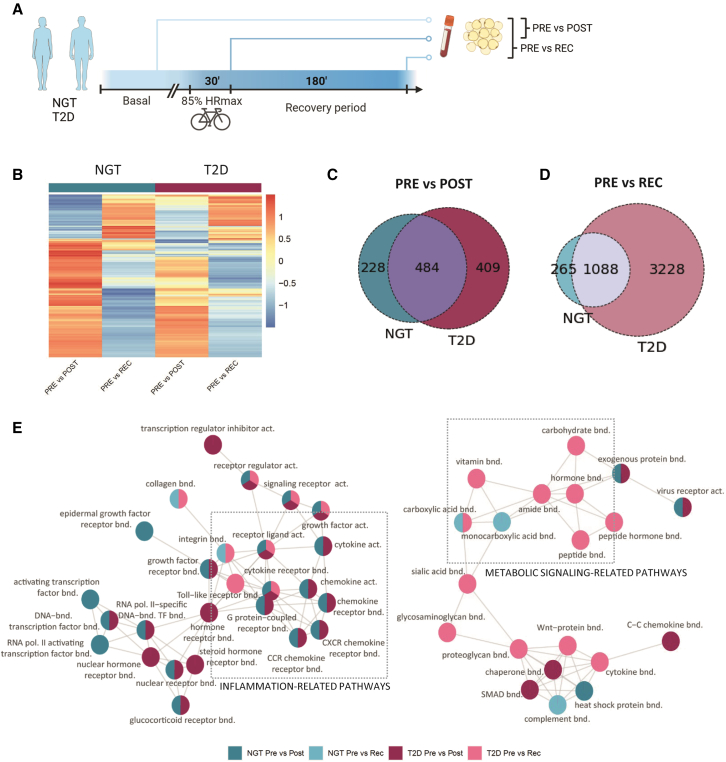
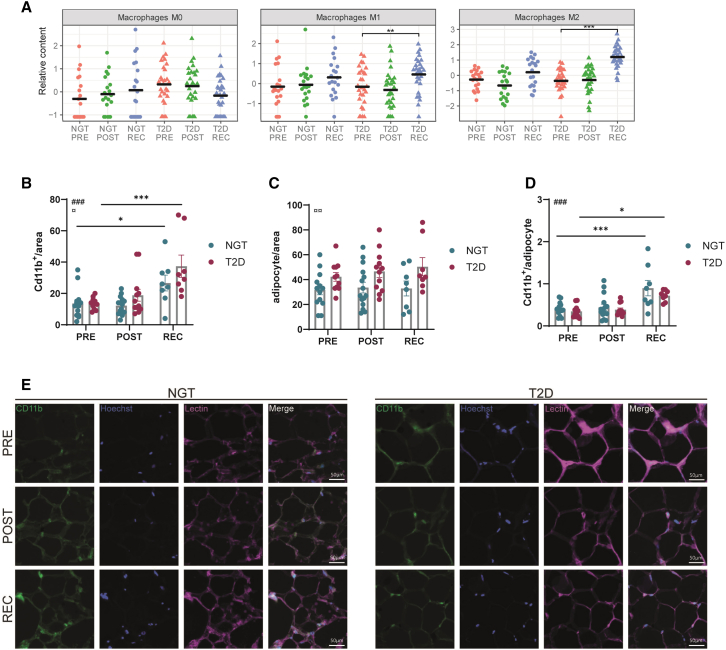
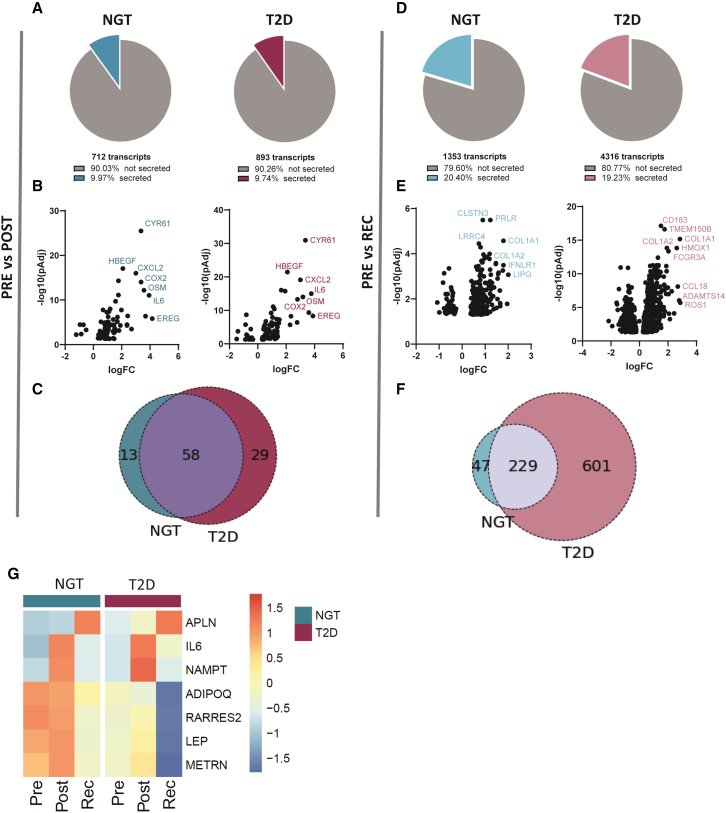
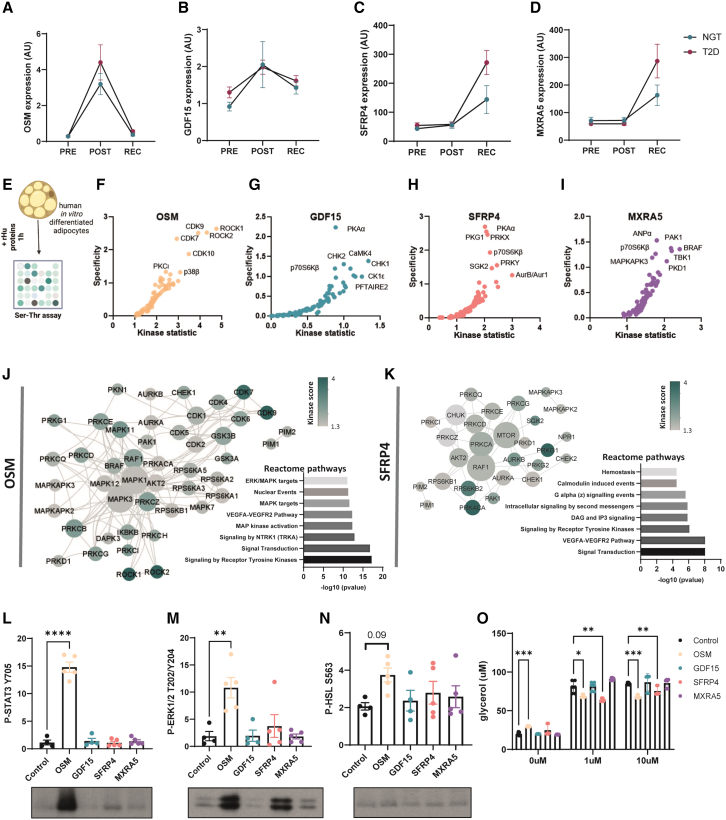
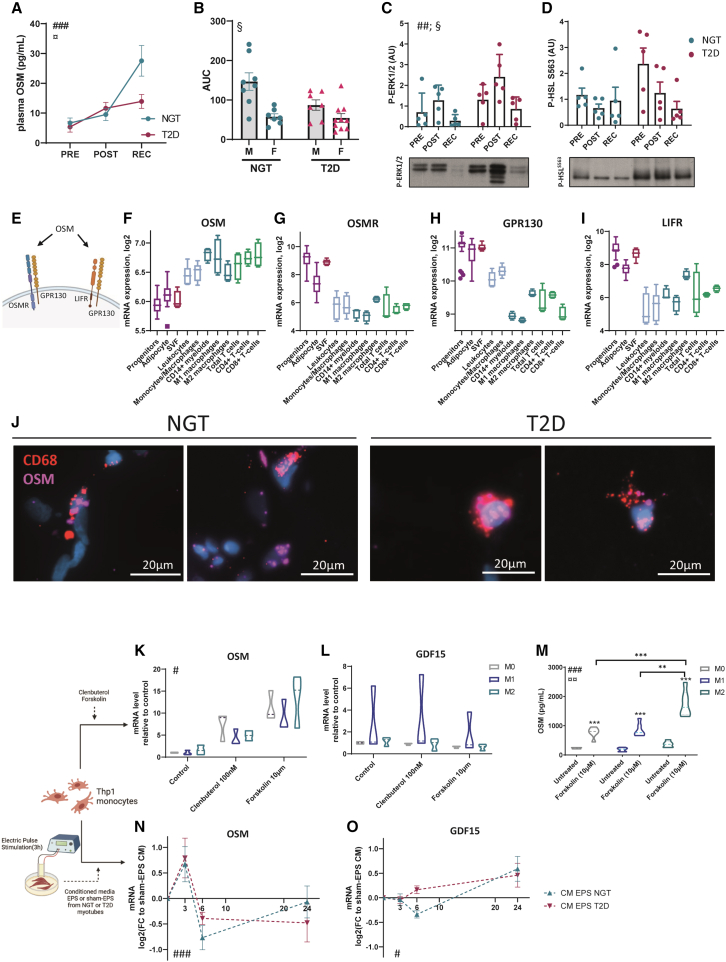
The discovery of exercise-regulated circulatory factors has fueled interest in organ crosstalk, especially between skeletal muscle and adipose tissue, and the role in mediating beneficial effects of exercise. We studied the adipose tissue transcriptome in men and women with normal glucose tolerance or type 2 diabetes following an acute exercise bout, revealing substantial exercise- and time-dependent changes, with sustained increase in inflammatory genes in type 2 diabetes. We identify oncostatin-M as one of the most upregulated adipose-tissue-secreted factors post-exercise. In cultured human adipocytes, oncostatin-M enhances MAPK signaling and regulates lipolysis. Oncostatin-M expression arises predominantly from adipose tissue immune cell fractions, while the corresponding receptors are expressed in adipocytes. Oncostatin-M expression increases in cultured human Thp1 macrophages following exercise-like stimuli. Our results suggest that immune cells, via secreted factors such as oncostatin-M, mediate a crosstalk between skeletal muscle and adipose tissue during exercise to regulate adipocyte metabolism and adaptation.

Keywords: adipose tissue; crosstalk; exercise; human; immune cells; inflammation; oncostatin-M; skeletal muscle; type 2 diabetes.


Conflict of interest statement

Declaration of interests J.R.Z. serves on the advisory boards for Cell and Cell Metabolism.

Figures

None
Graphical abstract
Figure 1
Figure 1
Adipose tissue displays a differential transcriptomic response to exercise in individuals with NGT and T2D (A) Experimental design. (B) Heatmap of differentially expressed genes in adipose tissue from individuals with normal glucose tolerance (NGT; n = 20) or type 2 diabetes (T2D; n = 28) analyzed between pre- and post-exercise or recovery conditions. (C) Overlay of significantly differentially expressed genes between pre- and post-exercise in adipose tissue of participants with NGT or T2D. (D) Overlay of significantly differentially expressed genes between pre-exercise and recovery in adipose tissue of individuals with either NGT or T2D. (E) Visualization of the main pathways’ clusters derived from the GO hierarchy pathway analysis. Color of the circles indicates the condition in which the pathways are significantly altered.
Figure 2
Figure 2
Recovery is associated with increased immune cell signature in adipose tissue from subjects with T2D (A) Estimation of macrophages populations M0, M1, and M2 proportions using CIBERSORTx analysis. (B) Quantification of Cd11b+ cells per area. (C) Quantification of adipocyte cells per area. (D) Ratio of Cd11b+ cells per adipocyte. Each dot represents an image, n = 3 subjects per group. Two-way ANOVA; # represents the main effect of exercise, and ¤ represents the main effect of disease. Post-tests in comparison to the pre condition: ∗∗∗∗p < 0,0001; ∗∗∗p < 0.001; ∗p < 0,05. (E) Representative images for each condition. Hoechst staining shows nuclei. Lectin staining shows the cells structure. The scale represents 50 μm.
Figure 3
Figure 3
Exercise induces the expression of genes encoding for secreted proteins, with a stronger effect in recovery (A) Percentage of the genes encoding for secreted proteins from the total number of genes significantly altered in individuals with either NGT (blue) or T2D (purple) between the post- and pre-exercise conditions. (B) Volcano plots showing log fold change (logFC) and significance of genes encoding for secreted proteins identified in (A). (C) Overlay of genes identified in adipose tissue from individuals with NGT or T2D encoding for secreted proteins altered post-exercise. (D) Percentage of the genes encoding for secreted proteins of the total genes significantly altered in adipose tissue from individuals with NGT (light blue) or T2D (pink) between the pre-exercise and recovery conditions. (E) Volcano plots showing logFC and significance of genes encoding for secreted proteins identified in (D). (F) Overlay of genes identified in adipose tissue from individuals with either NGT or T2D encoding for secreted proteins that are altered at recovery. (G) Heatmap of gene expression profile of selected adipokines identified pre- and post-exercise and recovery in adipose tissue from individuals with either NGT or T2D. The color scale represents mean scale CPM.
Figure 4
Figure 4
Oncostatin-M is acutely induced by exercise and increases basal lipolysis in human adipocytes (A–D) Gene expression of candidate secreted factors oncostatin-M, GDF15, SFRP4, and MXRA5 selected for further validation. (E) Human adipocytes were treated with recombinant proteins for 1 h, and kinase activity was assessed using serine-threonine substrate array (n = 5). (F–I) Kinase activity in response to oncostatin-M, GDF15, SFRP4, and MXRA5 was predicted by computational analysis of differentially phosphorylated peptide signatures. The kinase statistic parameter reflects the change in kinase activity, whereas the specificity parameter indicates how specific the peptide signature is to a particular kinase. (J) Protein-protein interaction (PPI) network and reactome pathway analysis of differentially active kinases. Kinase score reflects kinase activation in response to oncostatin-M compared to control cells, and the node degree is a measure of how connected each node is within the network. (K) PPI network and reactome pathway analysis of differentially active kinases. Kinase score reflects kinase activation in response to SFRP4 compared to control cells, and the node degree is a measure of how connected each node is within the network. (L–N) Western-blot quantification and representative image of P-STAT3 Y705, P-ERK1/2 T202/Y204, and P-HSL S563 after 1 h incubation with recombinant proteins in isolated human adipocytes (one-way ANOVA) (n = 5). (O) Lipolysis assay in control, 1 μM, and 10 μM isoprenaline conditions (two-way ANOVA). ∗∗∗∗p < 0,0001; ∗∗∗p < 0.001; ∗∗p < 0,01; ∗p < 0,05. Error bars show SEM.
Figure 5
Figure 5
OSM expression arises from macrophages in response to exercise-like stimuli (A) Oncostatin-M level in plasma from individuals with either NGT or T2D (n = 15 and 17 per group). #Time effect in both groups (two-way ANOVA test), ###p < 0.001. ¤Interaction between time and diagnosis group, ¤p < 0.05. (B) Area under the curve of plasma oncostatin-M after separation between men and women and NGT and T2D (n = 8 per subgroup). §Sex effect (two-way ANOVA on log-transformed values), §p < 0.05. (C and D) Western blot quantification and representative image of P-ERK1/2 and P-HSL in adipose tissue biopsies (n = 5 per group). #Time effect in both groups (two-way ANOVA test), ##p < 0.01. §Condition effect (two-way ANOVA test), §p < 0.05. (E) Schematic of OSM binding to type I and type II receptors in humans. (F–I) Expression of oncostatin-M and oncostatin-M receptor subunits genes OSMR, LIFR, and GPR130 in cells derived from adipose tissue after fractionation. Kruskal-Wallis testing shows significant differences between cell populations for all 4 genes (p < 0.001). (J) Spatial detection of OSM and macrophage markers CD68 mRNAs by fluorescent in situ hybridization in frozen section of adipose tissue of subjects with NGT and T2D (n = 4 and 3). (K and L) Thp1 macrophages were treated with 10 μM forskolin or 100 nM clenbuterol for 3 h, and expression of oncostatin-M and GDF15 was measured. #Treatment effect (two-way ANOVA, log-transformed values), #p < 0.05. n = 3 experiments. (M) Oncostatin M measurement in the conditioned media in response to 10 μM forskolin (two-way ANOVA, log-transformed values). #Treatment effect, ###p < 0.001; ¤polarization effect, ¤¤p < 0.01; ∗Sidak’s post-tests. (N and O) Thp1 macrophages were exposed to conditioned media from 3 h electric-pulse-stimulated (EPS) or 3 h sham EPS human myotubes derived from individuals with either NGT or T2D (n = 5 and 6) for 0, 3, 6, or 24 h, and oncostatin-M and GDF15 gene expressions were measured and presented normalized to expression in response to sham EPS. #Time effect (two-way ANOVA test), ###p < 0.001, #p < 0.05. Error bars show SEM.

References

    1. Egan B., Zierath J.R. Exercise metabolism and the molecular regulation of skeletal muscle adaptation. Cell Metab. 2013;17:162–184. - PubMed
    1. Wallberg-Henriksson H., Zierath J.R. Metabolism. Exercise remodels subcutaneous fat tissue and improves metabolism. Nat. Rev. Endocrinol. 2015;11:198–200. - PubMed
    1. Stanford K.I., Middelbeek R.J.W., Townsend K.L., Lee M.Y., Takahashi H., So K., Hitchcox K.M., Markan K.R., Hellbach K., Hirshman M.F., et al. A novel role for subcutaneous adipose tissue in exercise-induced improvements in glucose homeostasis. Diabetes. 2015;64:2002–2014. - PMC - PubMed
    1. May F.J., Baer L.A., Lehnig A.C., So K., Chen E.Y., Gao F., Narain N.R., Gushchina L., Rose A., Doseff A.I., et al. Lipidomic Adaptations in White and Brown Adipose Tissue in Response to Exercise Demonstrate Molecular Species-Specific Remodeling. Cell Rep. 2017;18:1558–1572. - PMC - PubMed
    1. Arner P., Kriegholm E., Engfeldt P., Bolinder J. Adrenergic regulation of lipolysis in situ at rest and during exercise. J. Clin. Invest. 1990;85:893–898. - PMC - PubMed

Publication types

Substances