. 2024 Jan 4;31(1):71-88.e8.
doi: 10.1016/j.stem.2023.11.011. Epub 2023 Dec 26.

A pancreatic cancer organoid platform identifies an inhibitor specific to mutant KRAS

Affiliations

A pancreatic cancer organoid platform identifies an inhibitor specific to mutant KRAS

Xiaohua Duan et al. Cell Stem Cell. .

Abstract

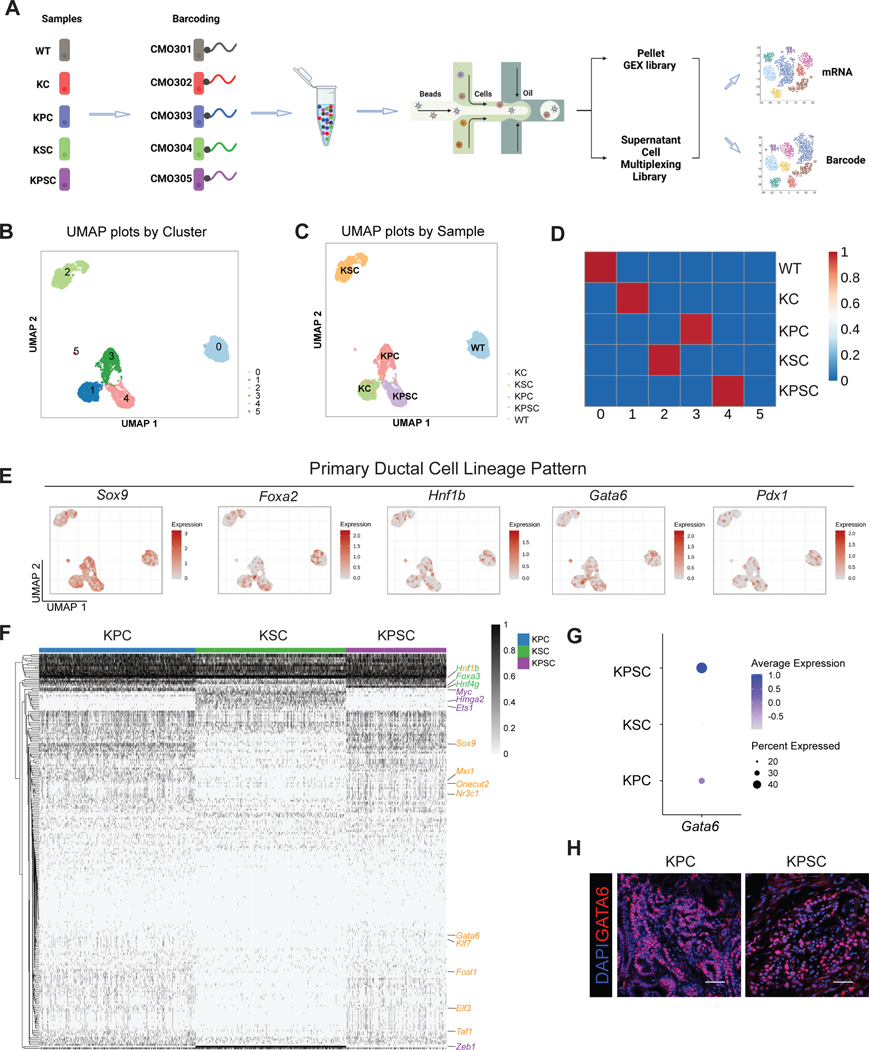
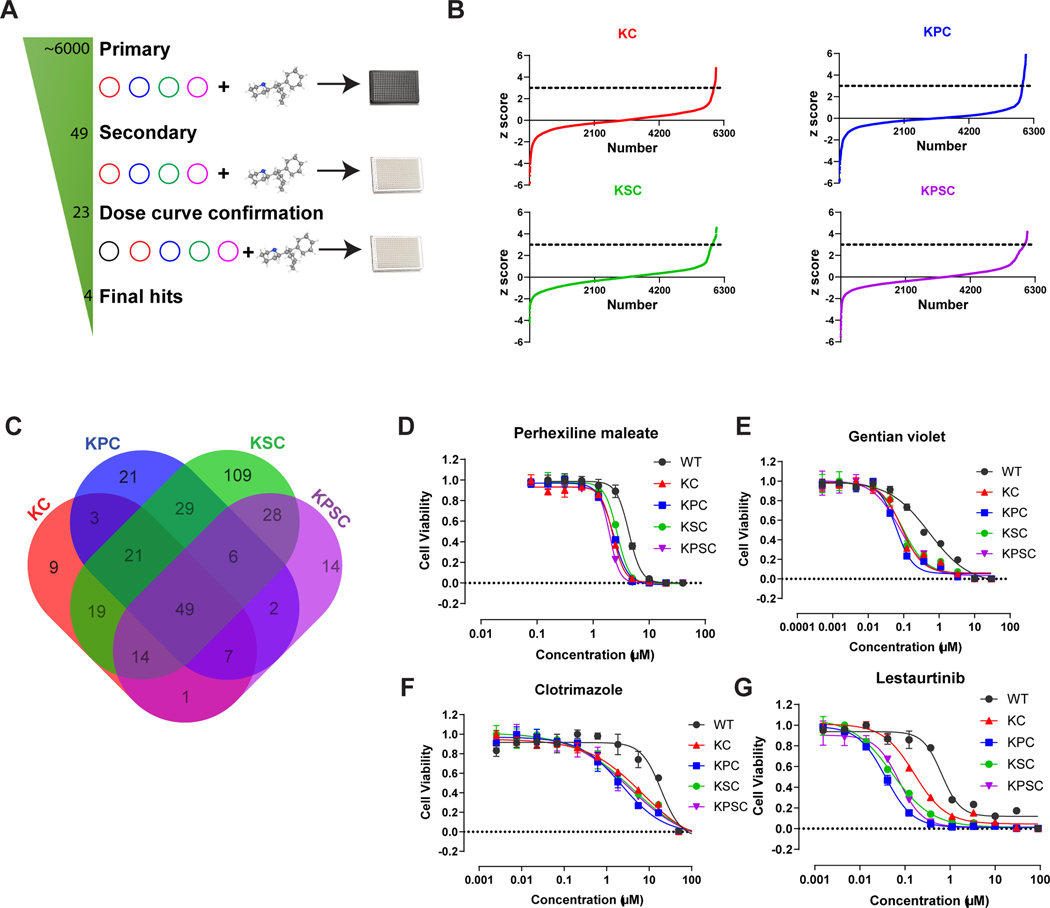
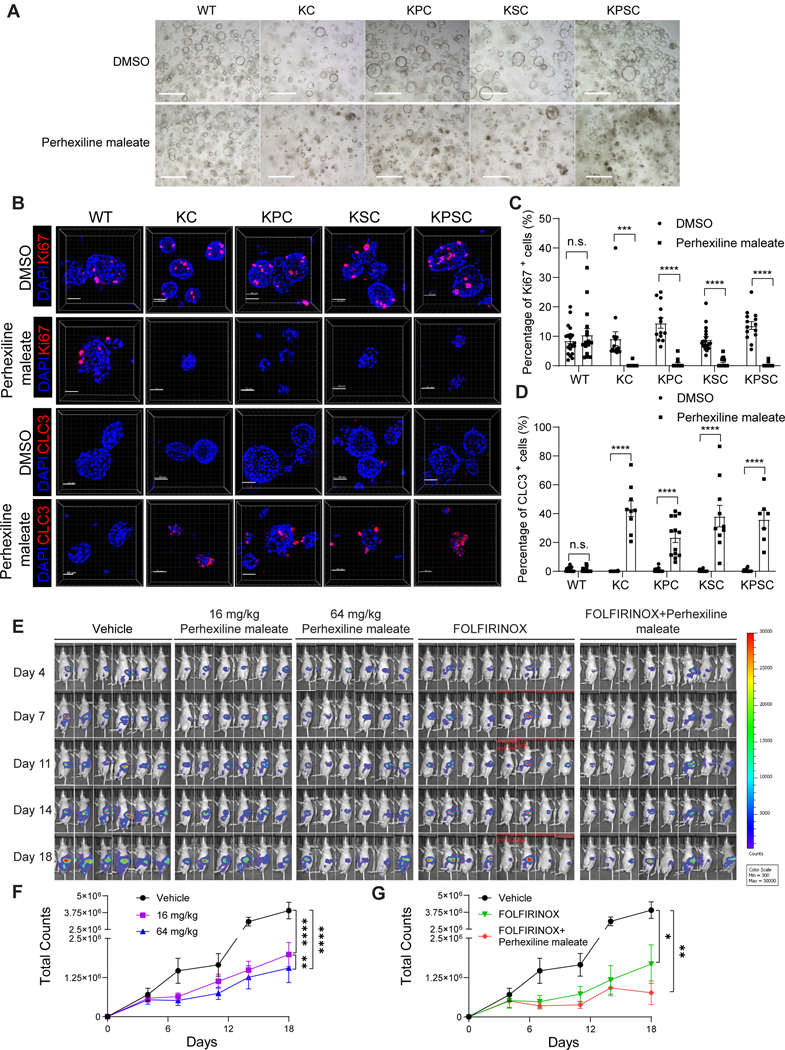
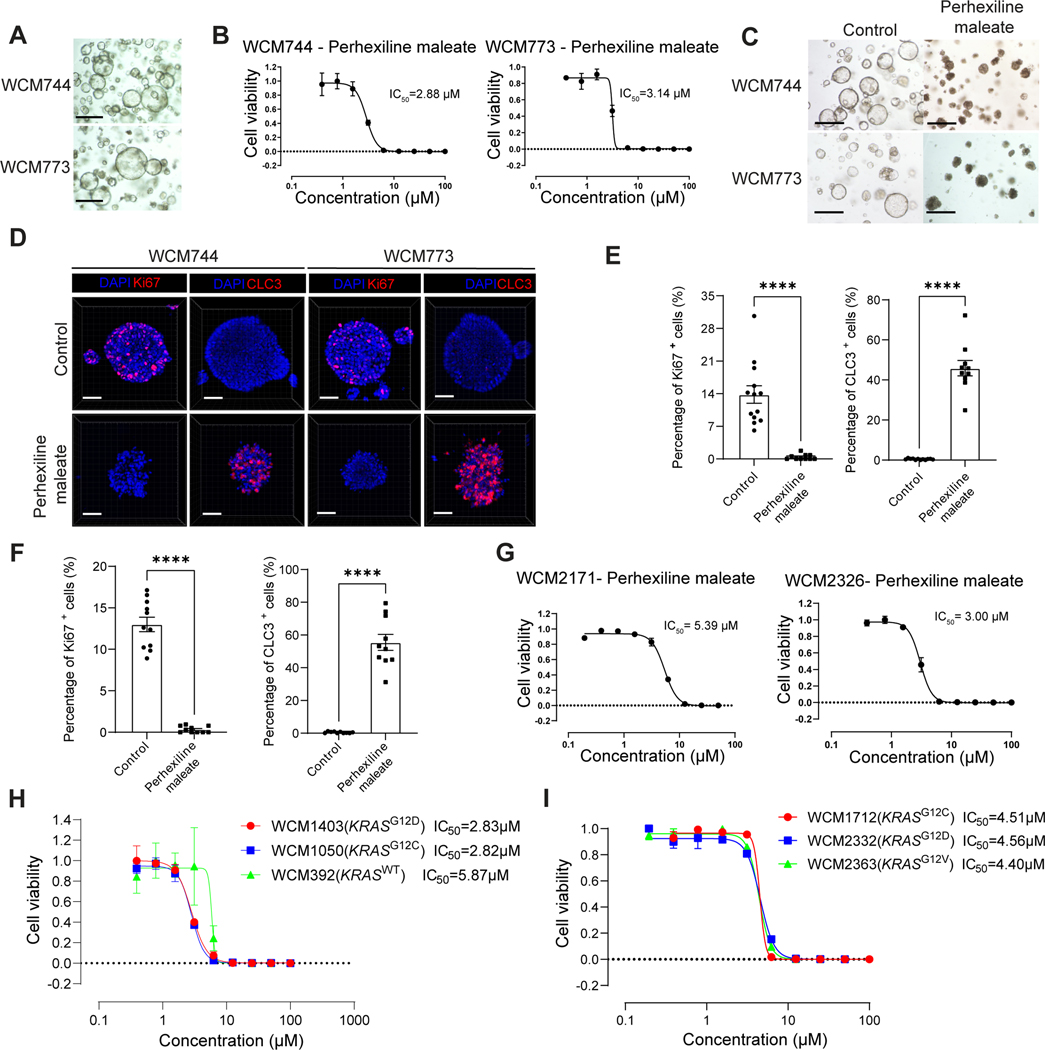
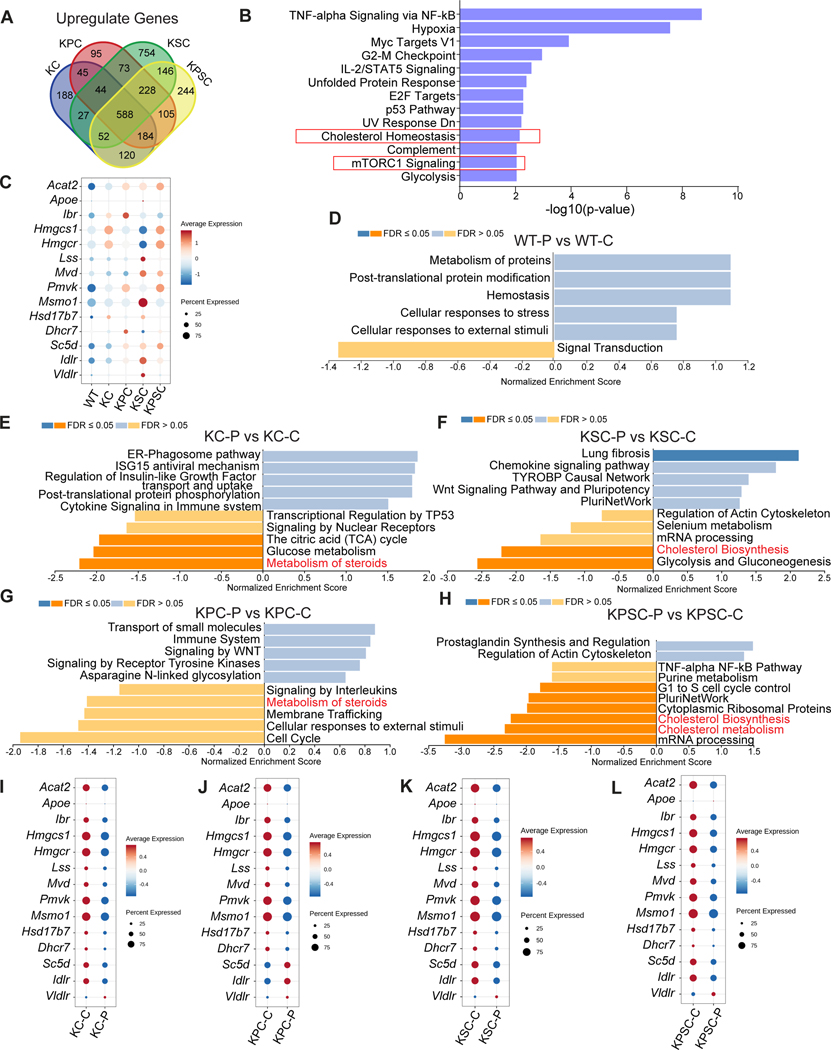
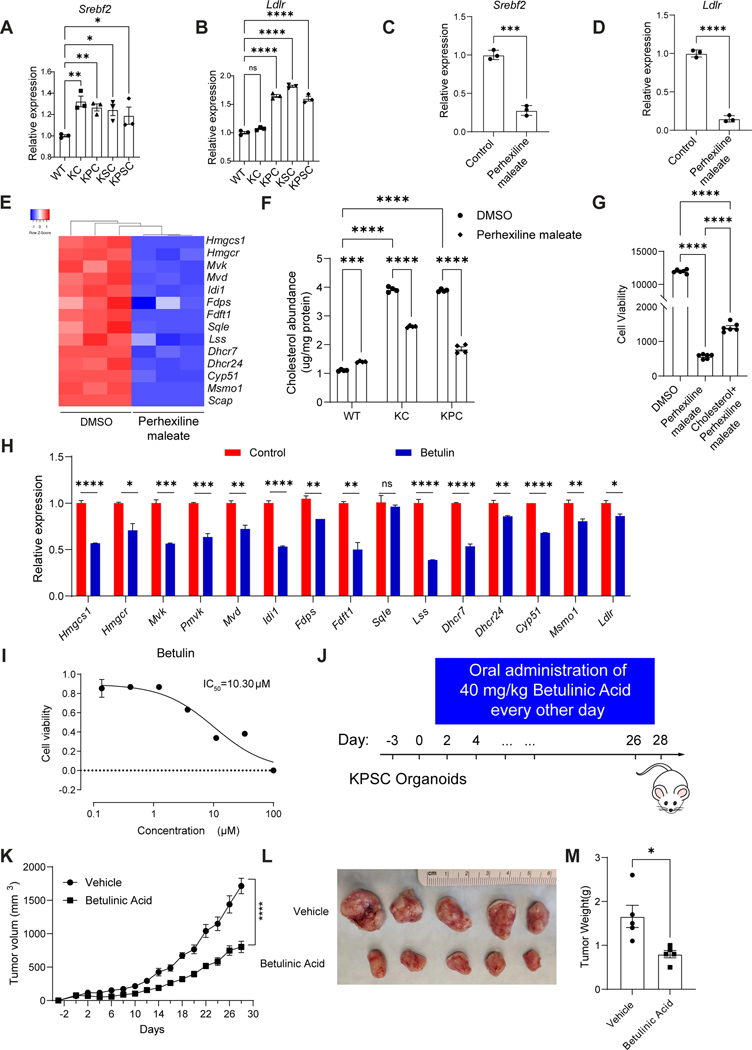
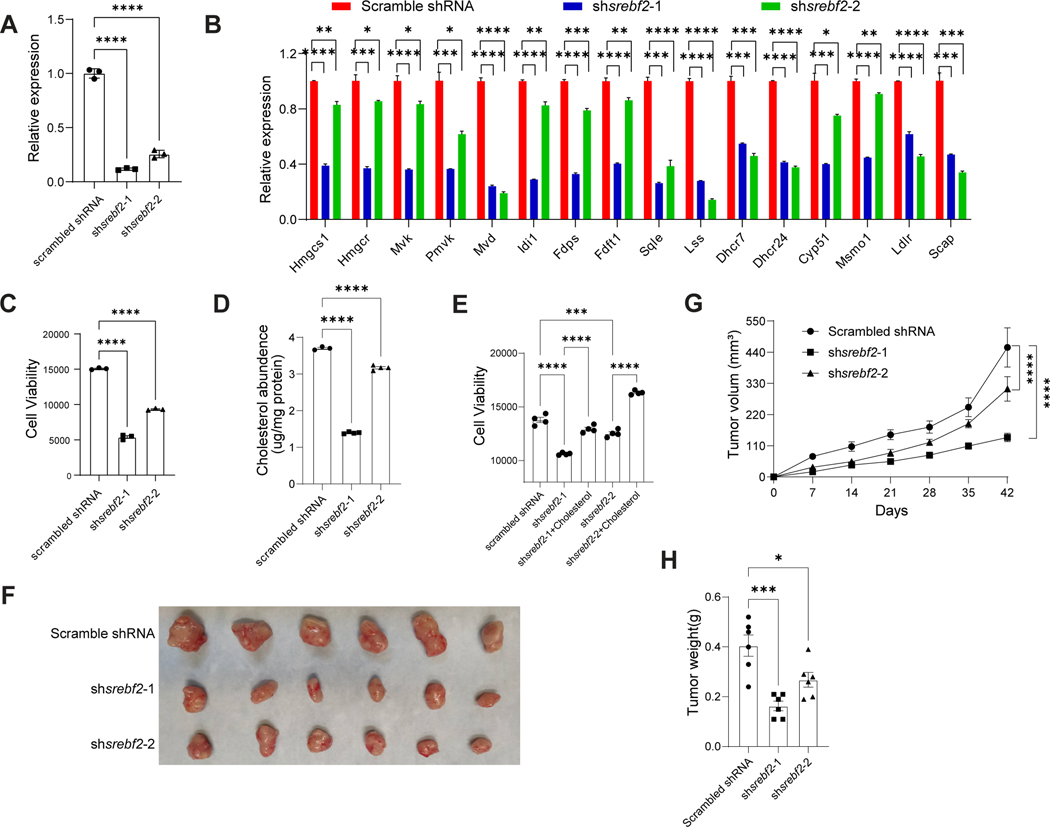
KRAS mutations, mainly G12D and G12V, are found in more than 90% of pancreatic ductal adenocarcinoma (PDAC) cases. The success of drugs targeting KRASG12C suggests the potential for drugs specifically targeting these alternative PDAC-associated KRAS mutations. Here, we report a high-throughput drug-screening platform using a series of isogenic murine pancreatic organoids that are wild type (WT) or contain common PDAC driver mutations, representing both classical and basal PDAC phenotypes. We screened over 6,000 compounds and identified perhexiline maleate, which can inhibit the growth and induce cell death of pancreatic organoids carrying the KrasG12D mutation both in vitro and in vivo and primary human PDAC organoids. scRNA-seq analysis suggests that the cholesterol synthesis pathway is upregulated specifically in the KRAS mutant organoids, including the key cholesterol synthesis regulator SREBP2. Perhexiline maleate decreases SREBP2 expression levels and reverses the KRAS mutant-induced upregulation of the cholesterol synthesis pathway.

Keywords: KRAS; SREBP2; cholesterol biosynthesis; colon cancer organoids; lung cancer organoids; orthotopic transplantation; pancreatic organoid; perhexiline maleate; targeted therapy.


Conflict of interest statement

Declaration of interests S.C. and T.E. are the co-founders of OncoBeat, LLC. S.C. is a consultant for Vesalius Therapeutics. F.C.P. is currently employed by Exelixis.

Figures

Figure 1.
Figure 1.. Multiplexed single-cell RNA-seq of pancreatic cancer organoids.
(A) A scheme of multiplexed single-cell RNA-seq approach. Five samples were barcoded with CMOs, and then cells were pooled together before scRNA-seq. Next-generation sequencing produces two UMI count matrices corresponding to gene expression and barcode abundance. (B) Uniform manifold approximation and projection (UMAP) plot based on the unsupervised analysis. (C) UMAP plot of sample classifications for CMO-labeled cells based on barcoding. (D) Correlation analysis of cell clusters based on unsupervised analysis and barcoding. (E) UMAP showing the expression of pancreatic progenitor pattern genes, including Sox9, Foxa2, Hnf1β, Gata6 and Pdx1. (F) Heatmap showing the master regulators of KSC, KPC and KPSC organoids. (G) Dot plot comparing the relative expression levels for Gata6 of KPC, KSC and KPSC organoids. (H) Representative immunohistochemistry staining of GATA6 in KPC and KPSC xenografts at day 28 post-transplantation. See also Figures S1–S2
Figure 2.
Figure 2.. An isogenic pancreatic cancer organoid-based high-throughput drug screen.
(A) Scheme of high-throughput drug screening. (B) Primary screening results. The x-axis is the compound number. The y-axis is the Z score. Black line indicates Z score = 3. (C) Venn diagram plot of overlapped primary screening results. 49 compounds were selected for the subsequent confirmation assay. (D-G) Efficacy curve of perhexiline maleate (D), gentian violet (E), clotrimazole (F) and lestaurtinib (G) on WT, KC, KPC, KSC, KPSC organoids. Data are presented as mean ± SEM. n = 3 biological replicates. See also Figure S3.
Figure 3.
Figure 3.. Perhexiline maleate inhibits cell proliferation and induces cell apoptosis in KC, KPC, KSC, KPSC organoids both in vitro and in vivo.
(A) Brightfield images of pancreatic organoids following treatment with 4 μM Perhexiline maleate or DMSO for 48 hours. Scale bar =500 μm. (B) Representative whole mount immunostaining images of pancreatic organoids following treatment with 4 μM Perhexiline maleate or DMSO for 48 hours. Scale bar =50 μm. Nuclei were stained by DAPI. CLC3: cleaved caspase 3. (C and D) Quantification results of percentage of Ki67+ or CLC3+ cells in pancreatic organoids after Perhexiline maleate or DMSO treatment. Data are presented as mean ± SEM, n = 4 biological replicates. (E) Representative luminescence images of mice orthotopically transplanted with KPSC organoids treated with vehicle, high (64 mg/kg), low (16 mg/kg) doses of Perhexiline maleate, FOLFIRINOX or 64 mg/kg Perhexiline maleate plus FOLFIRINOX. (F and G) The quantification of the total counts of luminescence signals of (F) Perhexiline maleate or vehicle treated mice and (G) FOLFIRINOX or Perhexiline maleate +FOLFIRINOX or vehicle treated mice. Data are presented as mean± SEM. N=6 mice. For panels F and G, the same vehicle treated group was used for the quantification and statistics. The P values were calculated by unpaired two-tailed Student’s t test. For tumor growth curve, the P values were calculated by two-way ANOVA with mix model. *P < 0.05; **P < 0.01; ***P < 0.001 and ****P < 0.0001. See also Figures S4–S5.
Figure 4:
Figure 4:. Perhexiline maleate inhibits cell growth and induces cell apoptosis of human PDAC organoids.
(A) Brightfield images of human PDAC organoids WCM744 and WCM773. Scale bar =500 μm. (B) Inhibitory curve of Perhexiline maleate on human PDAC organoids WCM744 and WCM773. Data are presented as mean ± SEM. N = 3 biological replicates. (C) Brightfield images following treatment with 4 μM Perhexiline maleate or DMSO on human PDAC organoids WCM744 and WCM773 for 72 hours. Scale bar =500 μm. (D) Representative whole mount immunostaining images of human PDAC organoids WCM744 and WCM773 treated with 10 μM Perhexiline maleate or DMSO for 72 hours. Scale bar =50 μm. Nuclei were stained by DAPI. (E and F) Quantification of the percentage of Ki67+ or CLC3+ cells in pancreatic organoids treated with Perhexiline maleate or DMSO. Data are presented as mean ± SEM. N = 6 biological replicates. (G) Inhibitory curve of Perhexiline maleate on human PDAC organoids WCM2171 and WCM2363. Data are presented as mean ± SEM. N = 3 biological replicates. (H) Dose curve of Perhexiline maleate on human colon cancer organoids WCM1403, WCM1050, and WCM392. Data are presented as mean ± SEM. N = 3 biological replicates. (I) Dose curve of Perhexiline maleate on human lung cancer organoids WCM1712, WCM2332 and WCM2363. Data are presented as mean ± SEM. N = 3 biological replicates. The P values were calculated by unpaired two-tailed Mann Whitney test. *P < 0.05; **P < 0.01; ***P < 0.001 and ****P < 0.0001. See also Figure S6 and Table S1
Figure 5.
Figure 5.. Perhexiline maleate induces tumor regression through attenuating the cholesterol biosynthesis pathway caused by KRAS mutant in PDAC.
(A) Venn plot shows overlapped upregulated genes from KC, KPC, KSC, and KPSC organoids compared with WT organoids. 588 genes were selected for the following (Over-Representation Analysis (ORA) or Gene Set Enrichment Analysis (GSEA). (B) ORA results indicated that cholesterol biosynthesis pathway was the top enriched pathway. (C) Dot plots describing the relative expression levels for genes of the cholesterol biosynthesis pathway in WT, KC, KPC, KSC, and KPSC organoids. (D-H) GSEA of Perhexiline maleate or control treated WT (D), KC (E), KPC (F), KSC (G) and KPSC (H) organoids. P: Perhexiline maleate; C: control. (I-L) Dot plots comparing the relative expression levels for genes of the cholesterol biosynthesis pathway of Perhexiline maleate or DMSO treated KC (I), KPC (J), KSC (K) and KPSC (L) organoids. P: Perhexiline maleate; C: control. See also Figures S6–S7.
Figure 6.
Figure 6.. Perhexiline maleate downregulates genes of the cholesterol biosynthesis pathway through decreasing SREBP2 expression levels.
(A-B) Relative expression levels for the cholesterol biosynthesis pathway regulator Srebf2 (A) and its downstream targets Ldlr (B)in WT and KC, KPC, KSC and KPSC organoids. (C and D) qRT-PCR analysis for Srebf2 and Ldlr expression in KPSC organoids treated with 4 μM Perhexiline maleate or DMSO control. Data are presented as mean ± SEM. N = 3 biological replicates. (E) Heatmap showing qRT-PCR results for the relative expression levels of the genes in the cholesterol biosynthesis pathway KPSC organoids treated with 4 μM Perhexiline maleate or DMSO control. N = 3 biological replicates. (F) Cholesterol abundance for WT, KC and KPC organoids treated with 4 μM Perhexiline maleate or DMSO control. N = 4 biological replicates. (G) Cell viability of KPSC organoids treated with DMSO, Perhexiline maleate or Perhexiline maleate+ cholesterol. N = 6 biological replicates. (H) qRT-PCR analysis for the relative expression levels of the cholesterol biosynthesis pathway genes in KPSC organoids treated with 10 μM Betulin or control for 72 hours. Data are presented as mean ± SEM. N = 3 biological replicates. (I) Efficacy curve of Betulin on KPSC organoids. Data are presented as mean ± SEM. N = 3 biological replicates. (J) A schematic for the organoid xenograft model and in vivo drug treatment with betulinic acid. The mice transplanted with KPSC organoids were treated with 40mg/kg betulinic acid or vehicle control every other day by oral administration, for 4 weeks. (K) Tumor growth curve of mice harboring KPSC xenografts treated with betulinic acid or vehicle control. Data are presented as mean ± SEM. N = 5 mice. (L and M) Image (L) and tumor weight (M) of mice harboring KPSC xenografts treated with betulinic acid or vehicle control. Data are presented as mean ± SEM. N = 5 mice. For Figure 6C, 6D, 6M, the P values were calculated by unpaired two-tailed Student’s t test. For Figure 6A, 6B, 6F, 6G, the P values were calculated by One-Way ANOVA firstly, and multiple comparisons test for further analysis. For Figure 6K, the P values were calculated by two-way ANOVA. * P < 0.05; **P < 0.01; ***P < 0.001 and ****P < 0.0001. See also Figure S7.
Figure 7.
Figure 7.. Genetic perturbation of Srebf2 blocks KPSC organoid growth both in vitro and in vivo.
(A) qRT-PCR analysis confirmed the knockdown efficiency of shRNAs in KPSC organoids carrying shSrebf2. Data are presented as mean ± SEM. N = 3 biological replicates. (B) qRT-PCR analysis for the relative expression levels of genes encoding enzymes involved in the cholesterol biosynthesis pathway in KPSC organoids carrying shSrebf2 or scrambled shRNA. Data are presented as mean ± SEM. N = 3 biological replicates. (C) Cell viability of KPSC organoids carrying shSrebf2 or scrambled shRNA. (D) Cholesterol abundance of KPSC organoids carrying shSrebf2 or scrambled shRNA. (E) Cell viability of KPSC organoids carrying shSrebf2, shSrebf2 + Cholesterol or scrambled shRNA. (G) Tumor growth curve of mice harboring KPSC organoids carrying shSrebf2 or scrambled shRNA. Data are presented as mean ± SEM. N = 4 mice. (F and H) Image (F) and tumor weight (H) of mice harboring KPSC organoids carrying shSrebf2 or scrambled shRNA. Data are presented as mean ± SEM. N = 4 mice. The P values were calculated by One-Way ANOVA firstly, and multiple comparisons test for further analysis. For Figure7G, Two-Way ANOVA were performed. *P < 0.05; **P < 0.01; ***P < 0.001 and ****P < 0.0001. See also Figure S7.

Comment in

References

    1. Sato T, Stange DE, Ferrante M, Vries RG, Van Es JH, Van den Brink S, Van Houdt WJ, Pronk A, Van Gorp J, Siersema PD, and Clevers H. (2011). Long-term expansion of epithelial organoids from human colon, adenoma, adenocarcinoma, and Barrett’s epithelium. Gastroenterology 141, 1762–1772. 10.1053/j.gastro.2011.07.050. - DOI - PubMed
    1. Li X, Francies HE, Secrier M, Perner J, Miremadi A, Galeano-Dalmau N, Barendt WJ, Letchford L, Leyden GM, Goffin EK, et al. (2018). Organoid cultures recapitulate esophageal adenocarcinoma heterogeneity providing a model for clonality studies and precision therapeutics. Nat Commun 9, 2983. 10.1038/s41467-018-05190-9. - DOI - PMC - PubMed
    1. Bartfeld S, Bayram T, van de Wetering M, Huch M, Begthel H, Kujala P, Vries R, Peters PJ, and Clevers H. (2015). In vitro expansion of human gastric epithelial stem cells and their responses to bacterial infection. Gastroenterology 148, 126–136 e126. 10.1053/j.gastro.2014.09.042. - DOI - PMC - PubMed
    1. Broutier L, Mastrogiovanni G, Verstegen MM, Francies HE, Gavarro LM, Bradshaw CR, Allen GE, Arnes-Benito R, Sidorova O, Gaspersz MP, et al. (2017). Human primary liver cancer-derived organoid cultures for disease modeling and drug screening. Nat Med 23, 1424–1435. 10.1038/nm.4438. - DOI - PMC - PubMed
    1. Boj SF, Hwang CI, Baker LA, Chio II, Engle DD, Corbo V, Jager M, Ponz-Sarvise M, Tiriac H, Spector MS, et al. (2015). Organoid models of human and mouse ductal pancreatic cancer. Cell 160, 324–338. 10.1016/j.cell.2014.12.021. - DOI - PMC - PubMed

Publication types

MeSH terms

LinkOut - more resources