. 2023 Dec 27;13(1):22758.
doi: 10.1038/s41598-023-49555-7.

Impact of various high fat diets on gene expression and the microbiome across the mouse intestines

Affiliations

Impact of various high fat diets on gene expression and the microbiome across the mouse intestines

Jose Martinez-Lomeli et al. Sci Rep. .

Abstract

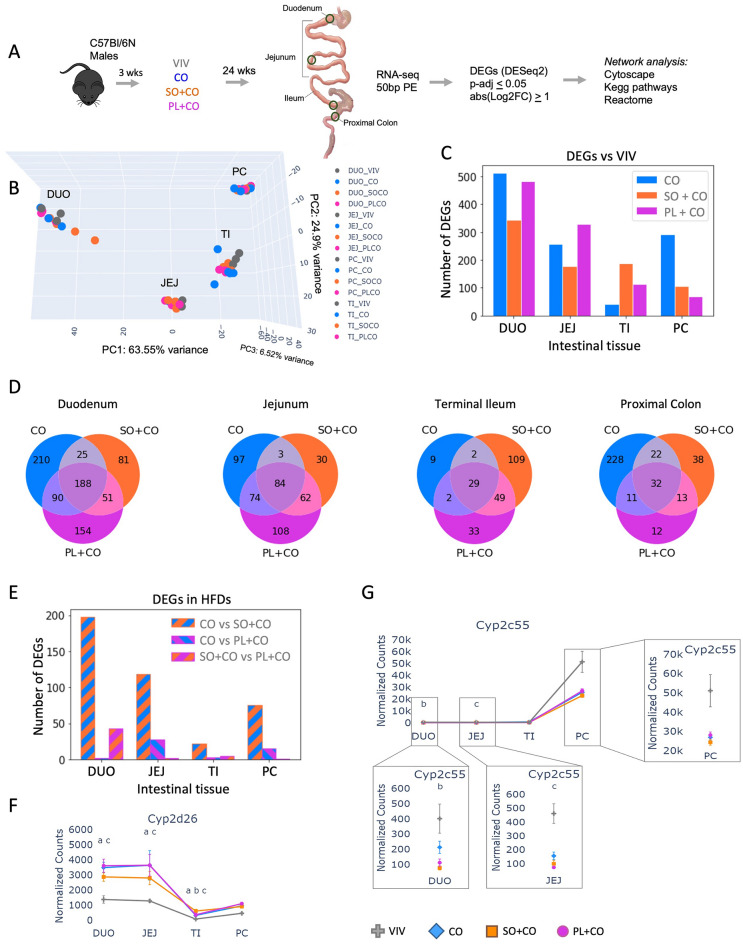
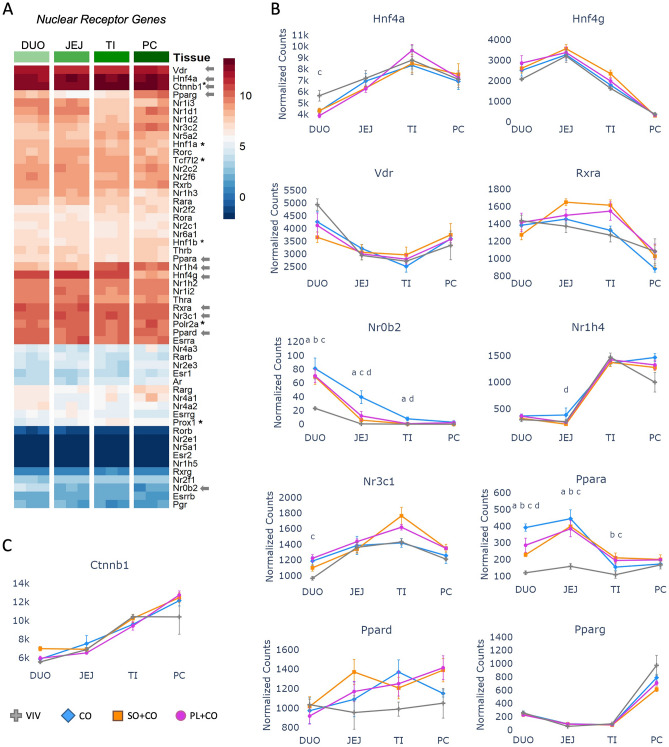
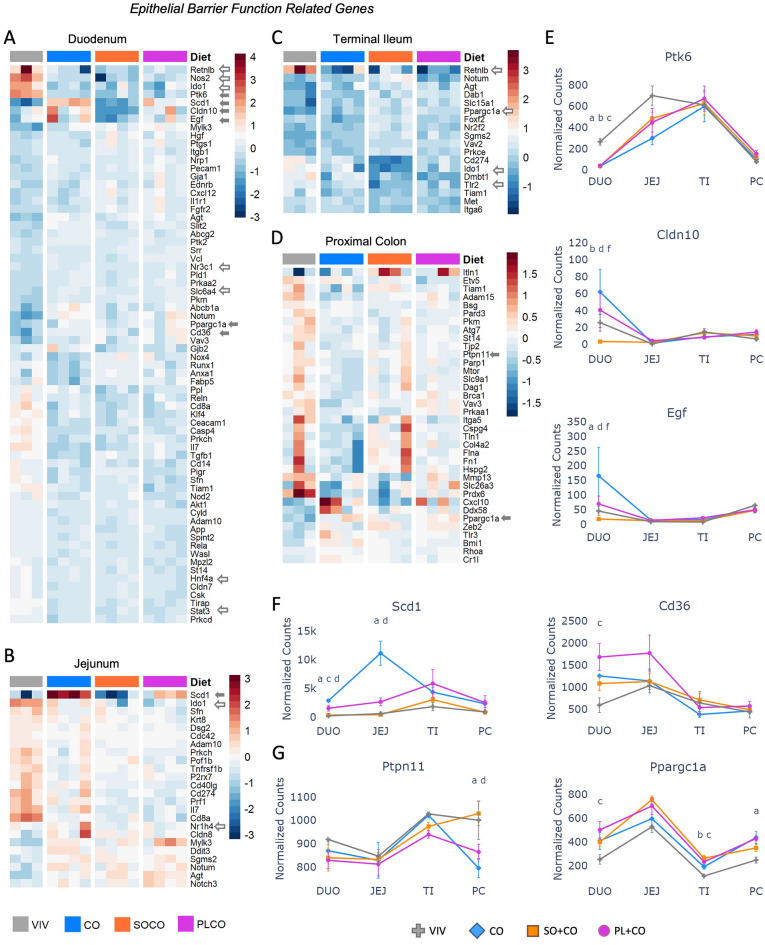
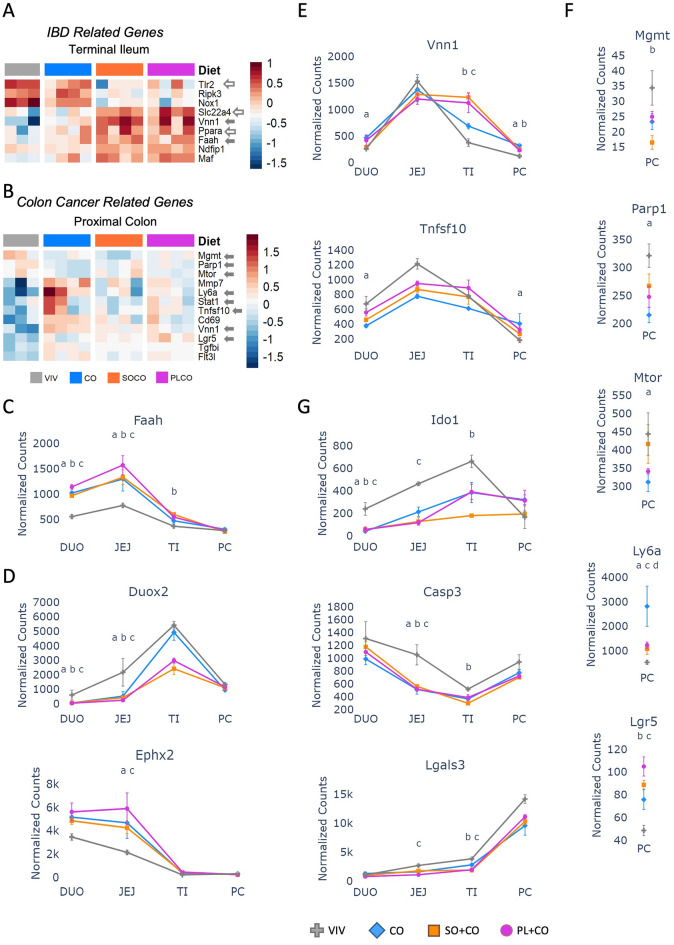
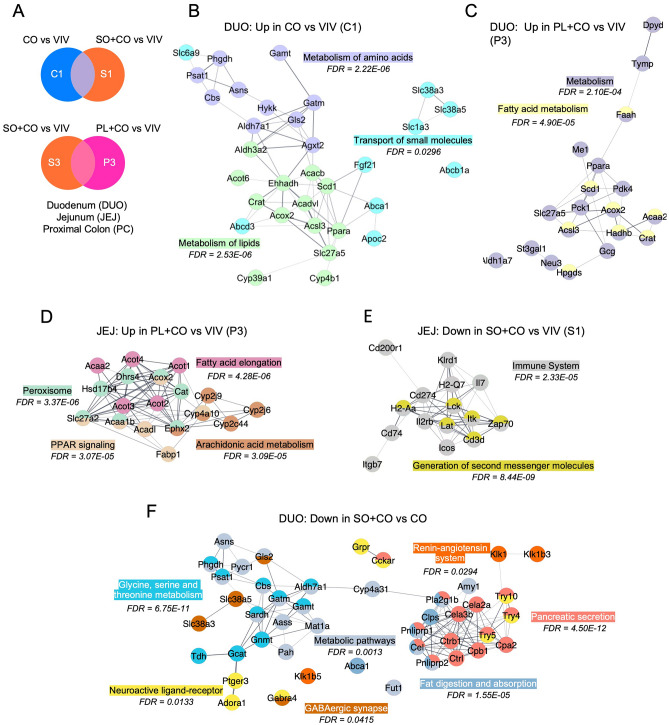
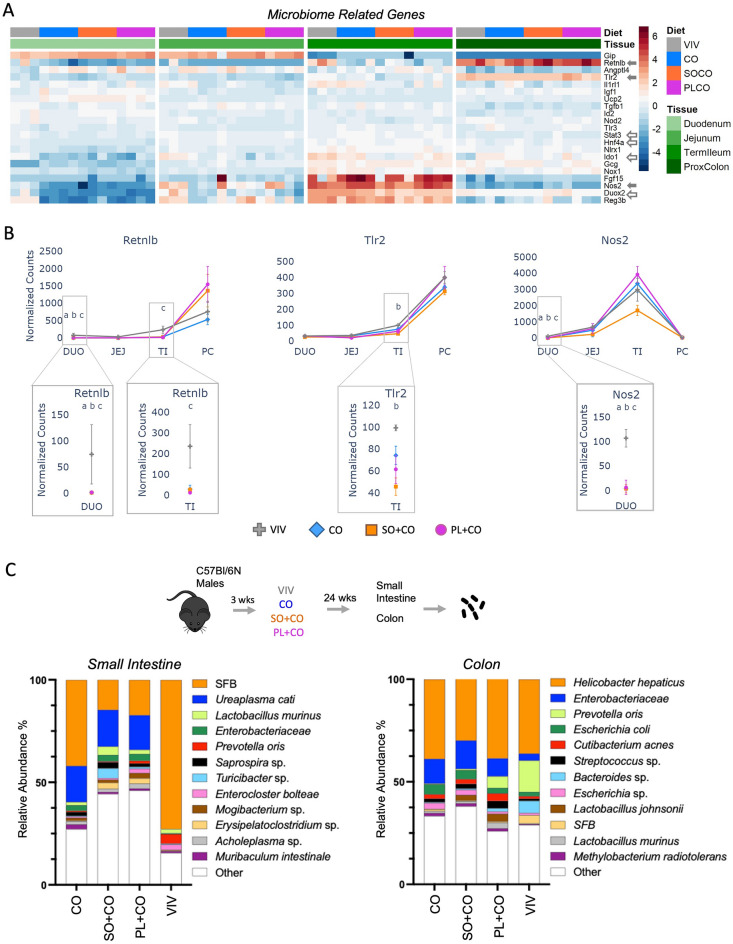
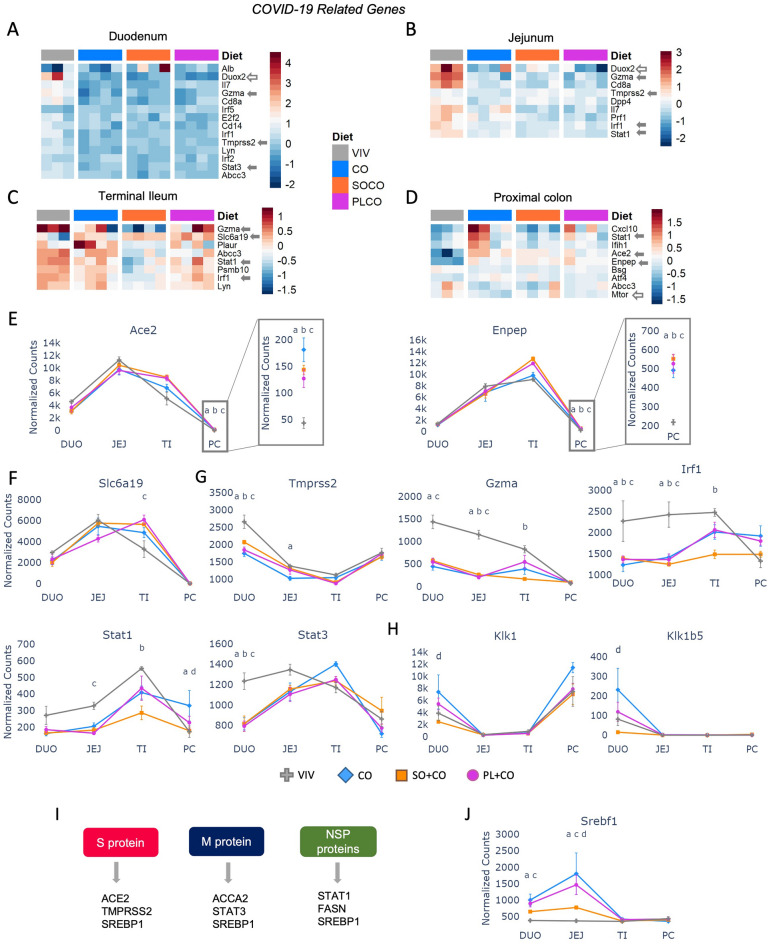
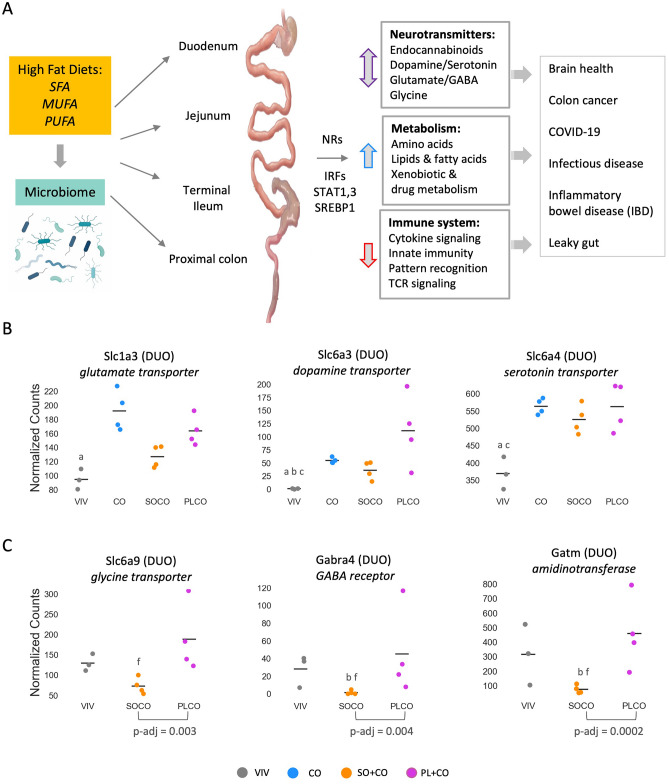
High fat diets (HFDs) have been linked to several diseases including obesity, diabetes, fatty liver, inflammatory bowel disease (IBD) and colon cancer. In this study, we examined the impact on intestinal gene expression of three isocaloric HFDs that differed only in their fatty acid composition-coconut oil (saturated fats), conventional soybean oil (polyunsaturated fats) and a genetically modified soybean oil (monounsaturated fats). Four functionally distinct segments of the mouse intestinal tract were analyzed using RNA-seq-duodenum, jejunum, terminal ileum and proximal colon. We found considerable dysregulation of genes in multiple tissues with the different diets, including those encoding nuclear receptors and genes involved in xenobiotic and drug metabolism, epithelial barrier function, IBD and colon cancer as well as genes associated with the microbiome and COVID-19. Network analysis shows that genes involved in metabolism tend to be upregulated by the HFDs while genes related to the immune system are downregulated; neurotransmitter signaling was also dysregulated by the HFDs. Genomic sequencing also revealed a microbiome altered by the HFDs. This study highlights the potential impact of different HFDs on gut health with implications for the organism as a whole and will serve as a reference for gene expression along the length of the intestines.


Conflict of interest statement

The authors declare no competing interests.

Figures

Figure 1
Figure 1
Differential impact of HFDs on gene expression across different parts of the intestines. (A) Work-flow: male C57Bl/6N male mice were weaned at 3 weeks of age to either a regular chow diet (VIV) or one of the three high fat diets—CO coconut oil, SO + CO soybean oil enriched, PL + CO low-LA soybean oil (Plenish) enriched. One centimeter of each tissue was used to perform RNA-seq (regions indicated with a circle). Post sequencing analysis was done as indicated. N = 3 per tissue for VIV and 4 per tissue for the HFDs. See Supplementary Table S1 for diet composition. (B) 3D principal component analysis (PCA) showing differential effects of the diets on different parts of the intestines. (C) Bar plot showing the number of differentially expressed genes (DEGs, up and down regulated) (p-adj ≤ 0.05 and absolute fold change ≥ 2 (abs(Log2FC) ≥ 1)) in three HFDs vs VIV chow in different parts of the intestines. See Supplementary Tables S2–S5 for complete comparison of genes between diets and Supplementary Fig. S2 for volcano plots of the most dysregulated genes. (D) Venn diagrams showing the overlap of the DEGs (p-adj < 0.05, Log2FC ≥ 1) in the indicated diet comparisons across the tissues. See Supplementary Fig. S1 for Venn analysis between HFDs. (E) Bar plot showing the number of differentially expressed genes (DEGs, up and down regulated) (p-adj ≤ 0.05 and absolute fold change ≥ 2 (abs(Log2FC) ≥ 1) between the three HFD comparisons in different parts of the intestines. (F,G) Line graph of the average normalized read counts with standard deviation (SD) of Cyp2d26 (F) and Cyp2c55 (G) in various parts of the intestines on the indicated diets (VIV, CO, SO + CO, PL + CO). Significantly different levels of expression between the diets within a given tissue denoted by p-adj ≤ 0.05 and are indicated as follows: a (VIV vs CO); b (VIV vs SO + CO); c (VIV vs PL + CO); d (CO vs SO + CO); e (CO vs PL + CO); f (SO + CO vs PL + CO). See Supplementary Figs. S3 and S4 for heatmaps and line graphs of additional Cyp, Gst and UGT genes.
Figure 2
Figure 2
Differential expression of nuclear receptors across the intestinal tract and in different HFDs. (A) Non row-normalized heatmap showing levels of all 48 nuclear receptors (NR) across the tissues in mice fed VIV chow, sorted by levels in the duodenum (DUO) and compared to non NR transcription factors (*). Normalized read counts across three biological replicates are shown. JEJ Jejunum, TI Terminal Ileum, PC Proximal colon, Arrows genes plotted in figure. Arbitrary scale of relative expression is shown. See Supplementary Fig. S5 for additional heatmaps of nuclear receptors. (B) Line graphs showing normalized read counts with standard deviation (SD) of select NRs in various parts of the intestines on the indicated diets. Significantly different genes between diets within a given tissue (p-adj ≤ 0.05) are indicated as follows: a (VIV vs CO); b (VIV vs SO + CO); c (VIV vs PL + CO); d (CO vs SO + CO). (C) As in (B) but for beta-catenin (Ctnnb1).
Figure 3
Figure 3
HFDs impact the expression of epithelial barrier function genes across the intestines. (AD) Heatmaps of genes involved in epithelial barrier function in the indicated portions of the intestines of mice fed either low fat VIV chow or one of the three HFDs. Included are genes that are significantly different between any two diets (p-adj ≤ 0.05). Solid arrow, plotted in figure; open arrow, plotted in a subsequent figure. Arbitrary scale of relative expression is shown. See Supplementary Table S6 for a complete list of genes. (EG) Line graphs showing normalized read counts with standard deviation (SD) of select genes on the indicated diets. Genes with significantly different levels of expression between the diets within a given tissue (p-adj ≤ 0.05) are indicated as follows: a (VIV vs CO); b (VIV vs SO + CO); c (VIV vs PL + CO); d (CO vs SO + CO); f (SO + CO vs PL + CO).
Figure 4
Figure 4
HFDs alter the expression of genes associated with Inflammatory Bowel Disease (IBD) and colon cancer. (A,B) Heatmaps of genes involved in IBD and colon cancer in the terminal ileum and proximal colon, respectively, of mice fed either low fat VIV chow or one of the three HFDs. Included are genes that are significantly different between any two diets (p-adj ≤ 0.05). N = 3 for Viv and 4 for HFDs per tissue. Solid arrows, plotted in this figure; open arrows, plotted in a subsequent figure. Arbitrary scale of relative expression is shown. See Supplementary Table S6 for a complete list of genes and Supplementary Fig. S6 for additional heatmaps of IBD and colon cancer genes. (CG) Line graphs showing normalized read counts with standard deviation (SD) of select genes in various parts of the intestines [only proximal colon is shown in (F)] on the indicated diets for IBD and colon cancer. Genes with significantly different levels of expression between the diets within a given tissue (p-adj ≤ 0.05) are indicated as follows: a (VIV vs CO); b (VIV vs SO + CO); c (VIV vs PL + CO); d (CO vs SO + CO).
Figure 5
Figure 5
Network analysis of differentially expressed genes (DEGs) in various HFDs and vivarium chow in various parts of the intestines. (A) Venn diagram of pairwise comparisons of differentially expressed genes (DEGs) (p-adj ≤ 0.05) between each HFD (CO, SO + CO, PL + CO) and the low-fat Vivarium chow (VIV). (BF) Networks of DEGs either up or down-regulated in the various tissues in the indicated portions of the Venn diagram in (A). C1: dysregulated in CO vs. VIV but not in SO + CO vs. VIV; S1: dysregulated in SO + CO vs. VIV but not in CO vs. VIV; S3 dysregulated in SO + CO vs. VIV but not in PL + CO vs. VIV; P3 dysregulated in PL + CO vs. VIV but not in SO + CO vs. VIV. Networks were identified in Cytoscape: Reactome (BE) or KEGG (F). Individual FDRs for the indicated pathways are shown. See Supplementary Fig. S7 for additional networks.
Figure 6
Figure 6
Impact of HFDs on the gut microbiome and related host genes. (A) Heatmap of significantly dysregulated genes involved in the microbiome response in the host. Included are genes that are significantly different between any two diets (p-adj ≤ 0.05). Solid arrows, plotted in this figure; open arrows, plotted in a subsequent figure. Arbitrary scale of relative expression is shown. See Supplementary Table S6 for a complete list of genes. (B) Line graphs showing normalized read counts with standard deviation (SD) of select genes in various parts of the intestines on the indicated diets. Genes with significantly different levels of expression between the diets within a given tissue (p-adj ≤ 0.05) are indicated as follows: (VIV, CO, SO + CO, PL + CO). a (VIV vs CO); b (VIV vs SO + CO); c (VIV vs PL + CO). (C) Taxa plots showing differentially abundant bacteria from host-associated intestinal epithelial cells in the small intestine or colon of mice fed the different diets (CO, SO + CO, PL + CO, VIV). Values in taxa plots are % IlluminaITS rRNA gene reads from intestinal epithelial cells from the indicated tissue. n = 11–12 mice for each of the four diets.
Figure 7
Figure 7
HFDs impact the expression of genes involved in SARS-CoV-2 across the intestinal tract. (AD) Heatmaps of significantly dysregulated genes involved in COVID-19. Included are genes that are significantly different between any two diets (p-adj ≤ 0.05). Solid arrows, plotted in this figure; open arrows, plotted in other (main) figures. Arbitrary scale of relative expression is shown. See Supplementary Table S6 for a complete list of genes. (EH) Line graphs showing normalized read counts with standard deviation (SD) of select genes in various parts of the intestines on the indicated diets involved in COVID-19. Genes with significantly different levels of expression between the diets within a given tissue (p-adj ≤ 0.05) are indicated as follows: a (VIV vs CO); b (VIV vs SO + CO); c (VIV vs PL + CO); d (CO vs SO + CO). (I) Interaction between indicated host proteins and SARS-Co-V2 viral proteins. (J) As in (EH) but for Srebf1.
Figure 8
Figure 8
Overview of impact of HFDs on microbiome and gene expression. (A) Overview of the role various HFDs may play in the development of disease by impacting the indicated pathways along the intestinal tract. SFA saturated fatty acids, MUFA monounsaturated fatty acids, PUFA polyunsaturated fatty acids. Image for microbiome obtained from Biorender.com. See “Discussion” for details. (B) Scatter plots showing normalized read counts of select intestinal transporters in various parts of the intestines on the indicated diets (VIV, CO, SO + CO, PL + CO). Line, mean of biological replicates. Genes with significantly different levels of expression between the diets within a given tissue (p-adj ≤ 0.02) are indicated as follows: a (VIV vs CO); b (VIV vs SO + CO); c (VIV vs PL + CO); f (SO + CO vs PL + CO). (C) As in B but for VIV, SO + CO and PL + CO diets. p-adj between SO + CO and PL + CO diets is indicated. Values for CO were higher than the other diets but had a very wide range and hence not plotted: see Supplementary Table S2 for numerical values.

Update of

Similar articles

Cited by

References

    1. Blasbalg TL, Hibbeln JR, Ramsden CE, Majchrzak SF, Rawlings RR. Changes in consumption of omega-3 and omega-6 fatty acids in the United States during the 20th century. Am. J. Clin. Nutr. 2011;93:950–962. doi: 10.3945/ajcn.110.006643. - DOI - PMC - PubMed
    1. Deol P, et al. Soybean oil is more obesogenic and diabetogenic than coconut oil and fructose in mouse: Potential role for the liver. PLoS One. 2015;10:e0132672. doi: 10.1371/journal.pone.0132672. - DOI - PMC - PubMed
    1. Deol P, et al. Omega-6 and omega-3 oxylipins are implicated in soybean oil-induced obesity in mice. Sci. Rep. 2017;7:12488. doi: 10.1038/s41598-017-12624-9. - DOI - PMC - PubMed
    1. Deol P, et al. Diet high in linoleic acid dysregulates the intestinal endocannabinoid system and increases susceptibility to colitis in Mice. Gut Microbes. 2023;15:2229945. doi: 10.1080/19490976.2023.2229945. - DOI - PMC - PubMed
    1. Lee J-Y, et al. High-fat diet and antibiotics cooperatively impair mitochondrial bioenergetics to trigger dysbiosis that exacerbates pre-inflammatory bowel disease. Cell Host Microbe. 2020;28:273–284.e6. doi: 10.1016/j.chom.2020.06.001. - DOI - PMC - PubMed