. 2023 Dec 27;13(1):22990.
doi: 10.1038/s41598-023-49996-0.

Obesity-induced PARIS (ZNF746) accumulation in adipose progenitor cells leads to attenuated mitochondrial biogenesis and impaired adipogenesis

Affiliations

Obesity-induced PARIS (ZNF746) accumulation in adipose progenitor cells leads to attenuated mitochondrial biogenesis and impaired adipogenesis

Kazuki Hachiya et al. Sci Rep. .

Abstract

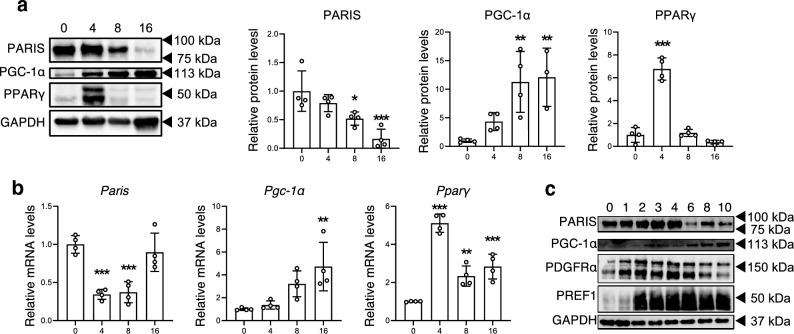
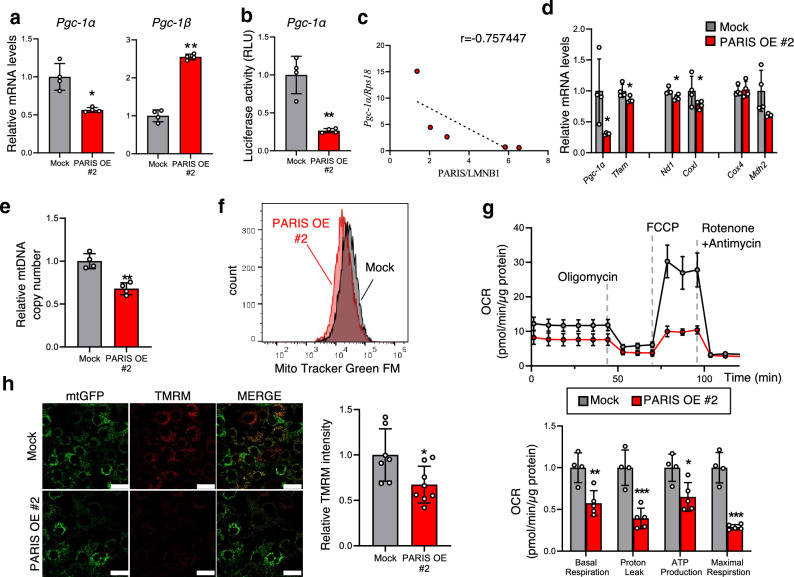
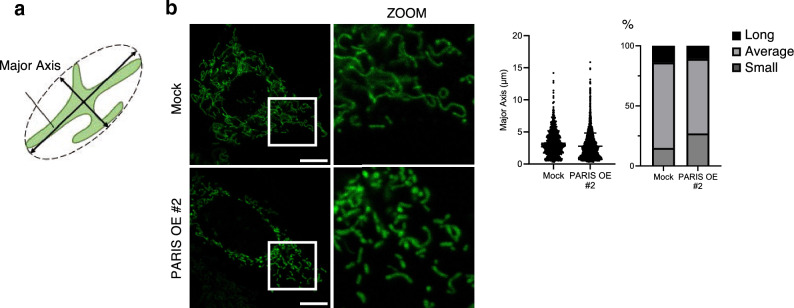
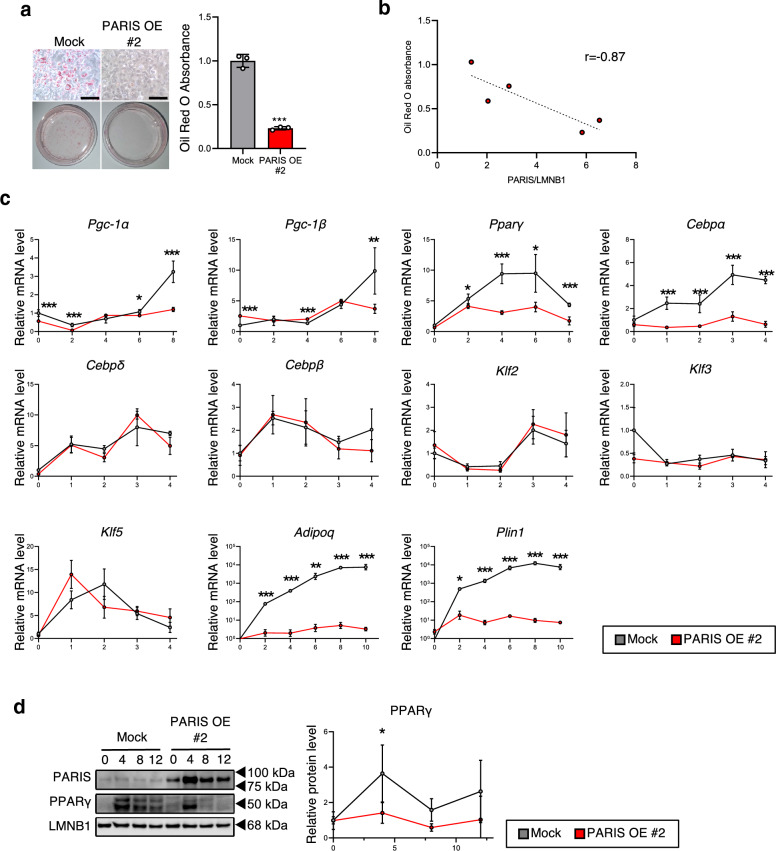
White adipose tissue (WAT) is critical for whole-body energy metabolism, and its dysfunction leads to various metabolic disorders. In recent years, many studies have suggested that impaired mitochondria may contribute to obesity-related decline in adipose tissue function, but the detailed mechanisms remain unclear. To investigate these mechanisms, we carried out a comprehensive analysis of WAT from mice with diet-induced obesity. We discovered the transcription factor Parkin interactive substrate (PARIS or ZNF746), which suppresses the expression of peroxisome proliferator-activated receptor γ coactivator-1α (PGC-1α), a key regulator of mitochondrial biogenesis, to be accumulated in adipose progenitor cells from obese mice. Furthermore, we demonstrated that 3T3-L1 preadipocytes with overexpression of PARIS protein exhibited decreased mitochondrial biogenesis and impaired adipogenesis. Our results suggest that the accumulation of PARIS protein may be a novel component in the pathogenesis of obesity-related dysfunction in WAT.


Conflict of interest statement

The authors declare no competing interests.

Figures

Figure 1
Figure 1
PARIS expression and localization analysis in healthy mice aged 20–25 weeks. (a) Western blot (left) and quantitative (right) analysis of PARIS protein levels in various mouse tissues (n = 3). (b) PARIS protein levels in ADSCs and the AEF. GAPDH was used as a loading control. (c) Fluorescent staining showing PARIS localization in the nucleus of PDGFRα-positive cells. Scale bars = 100 µm. (d) mRNA levels of Paris in several tissues (n = 3–4). Data are expressed as the mean ± standard deviation (SD). rWAT, retroperitoneal WAT; eWAT, epididymal WAT; sWAT, subcutaneous WAT; BAT, brown adipose tissue; QFM, quadriceps femoris muscle.
Figure 2
Figure 2
Analysis of PARIS quantity and localization in obese WAT. (a) Western blotting (left) and quantitative analysis (right) of PARIS protein levels in control ND and HFD mice (n = 5–6). (b) mRNA levels of Paris in WAT of ND and HFD mice (n = 7). (c) Fluorescent staining showing PARIS localization in the nucleus of PDGFRα-positive cells. Scale bars = 100 µm; ZOOM = magnification of the area indicated by the white rectangle, showing PARIS localization in the nucleus of PDGFRα-positive cells (arrowheads). (d) PARIS protein levels in ADSCs from ND and HFD mice (n = 5, pooled sample). GAPDH was used as a loading control. The blots of each protein were cropped from different parts of the same membrane. The original blots are presented in Supplementary Information 2. (e) mRNA levels of two regulators of mitochondrial biogenesis, Pgc-1α and Tfam, in ADSCs from HFD mice (n = 4–7). Data are expressed as the mean ± SD, and were analyzed by Student’s t-test; *p < 0.05, ***p < 0.001.
Figure 3
Figure 3
Western blotting and reverse transcription (RT)-PCR analysis of the indicated factors in 3T3-L1 cells and MEFs during adipogenesis. (a) Western blotting (left) and quantitative analysis (right) of the indicated proteins in 3T3-L1 cells induced to differentiate into white adipocytes and harvested at 0, 4, 8, and 16 days post induction. Successful adipogenesis was confirmed by increased protein levels of PPARγ. GAPDH was used as a loading control (n = 4). The blots of each protein were cropped from different parts of the same membrane. The original blots are presented in Supplementary Information 2. (b) RT-PCR analysis of Paris, Pgc-1α, and Pparγ mRNA levels in 3T3-L1 cells under the same conditions. (c) Western blotting of the indicated proteins from MEFs induced to differentiate into white adipocytes and harvested at 0, 1, 2, 3, 4, 6, 8, and 10 days post induction. The blots of each protein were cropped from different parts of the same membrane. The original blots are presented in Supplementary Information 2. Data are expressed as the mean ± SD and were analyzed by one–way ANOVA followed by Dunnett’s test; *p < 0.05, **p < 0.01, ***p < 0.001.
Figure 4
Figure 4
Evaluation of mitochondrial biogenesis and functions in PARIS-OE cells. (a) RT-PCR analysis of mRNA levels of Pgc-1α and Pgc-1β in 3T3-L1 cells undergoing mock transfection or transfection with a PARIS-OE vector (n = 4). (b) Luciferase reporter assay of Pgc-1α promoter activity in PARIS-OE and mock-transfected cells (n = 4). (c) Negative correlation between Pgc-1α mRNA levels and PARIS protein levels in PARIS-OE cells (n = 5). (d) RT-PCR analysis of mRNA levels of genes involved in mitochondrial biogenesis (Pgc-1α and Tfam), and those that encode mitochondrial proteins on mtDNA (Nd1 and Cox1) and nuclear DNA (Cox4 and Mdh2) in PARIS-OE and mock-transfected cells (n = 4). (e) Decreased copy number of mtDNA in PARIS-OE cells, estimated by the fold change in expression of CoxII relative to that of Hprt (n = 4). (f) Mitochondrial mass analysis showing a decreased signal intensity in PARIS-OE cells. (g) Significant decrease in OCR in PARIS-OE cells (n = 4–5). Data are expressed as the mean ± SD. (h) Confocal microscopy (left) and quantitative analysis (right) showing reduced mitochondrial membrane potential in cells with mtGFP/FLAG-PARIS OE. Scale bars = 50 µm. Data obtained from 7–8 visual fields are expressed as the mean ± SD and were analyzed by Student’s t-test; *p < 0.05, **p < 0.01, *** p < 0.001. RLU, relative light units.
Figure 5
Figure 5
Confocal microscopy analysis of mitochondrial major axis under PARIS OE. (a) Schematic illustration of the mitochondrial major axis. (b) Representative images (left) and quantitative analysis (right) of 3T3-L1 cells undergoing mock transfection or transfection with a PARIS-OE vector. Scale bars = 10 µm; ZOOM = magnification of the area indicated by the white rectangle. Mitochondria were divided into three groups by size: Small = smaller than 1.29 µm; Average = between 1.29 and 5.19 µm; Long = longer than 5.19 µm. Notably, 1.29 µm is the value of the mean minus one standard deviation of the control, while 5.19 µm is the mean plus one standard deviation of the control.
Figure 6
Figure 6
Analysis of adipocyte differentiation under PARIS-OE. (a) Oil red O staining of lipids (left) and quantitative analysis (right) of 3T3-L1 cells with mock transfection or PARIS-OE at 8 days post induction of differentiation (n = 3). Scale bars = 100 µm. (b) Scatter plot showing the negative correlation between PARIS protein levels and Oil red O absorbance in each clone at 8 days post induction of differentiation. (c) RT-PCR analysis of mRNA levels of eleven genes involved in different stages of adipocyte differentiation (n = 4). (d) Western blot (left) and quantitative analysis (right) of PPARγ expression in PARIS-OE cells at 0, 4 ,8, and 12 days post induction of differentiation (n = 4). Lamin B1 (LMNB1) was used as a loading control. The blots of each protein were cropped from different parts of the same membrane. The original blots are presented in Supplementary Information 2. Data are expressed as the mean ± SD and were analyzed by Student’s t-test; *p < 0.05, ***p < 0.001.

Similar articles

References

    1. Sakers A, De Siqueira MK, Seale P, Villanueva CJ. Adipose-tissue plasticity in health and disease. Cell. 2022;185:419–446. doi: 10.1016/j.cell.2021.12.016. - DOI - PMC - PubMed
    1. Lindroos B, Suuronen R, Miettinen S. The potential of adipose stem cells in regenerative medicine. Stem Cell Rev. Rep. 2011;7:269–291. doi: 10.1007/s12015-010-9193-7. - DOI - PubMed
    1. Heinonen S, et al. Impaired mitochondrial biogenesis in adipose tissue in acquired obesity. Diabetes. 2015;64:3135–3145. doi: 10.2337/db14-1937. - DOI - PubMed
    1. Kobayashi M, Deguchi Y, Nozaki Y, Higami Y. Contribution of PGC-1α to obesity- and caloric restriction-related physiological changes in white adipose tissue. Int. J. Mol. Sci. 2021 doi: 10.3390/ijms22116025. - DOI - PMC - PubMed
    1. Kong S, Cai B, Nie Q. PGC-1α affects skeletal muscle and adipose tissue development by regulating mitochondrial biogenesis. Mol. Genet. Genom. 2022;297:621–633. doi: 10.1007/s00438-022-01878-2. - DOI - PubMed

MeSH terms

Substances