. 2024 Mar;11(10):e2305614.
doi: 10.1002/advs.202305614. Epub 2023 Dec 27.

TREM2-IGF1 Mediated Glucometabolic Enhancement Underlies Microglial Neuroprotective Properties During Ischemic Stroke

Affiliations

TREM2-IGF1 Mediated Glucometabolic Enhancement Underlies Microglial Neuroprotective Properties During Ischemic Stroke

Sheng Yang et al. Adv Sci (Weinh). 2024 Mar.

Abstract

Microglia, the major resident immune cells in the central nervous system, serve as the frontline soldiers against cerebral ischemic injuries, possibly along with metabolic alterations. However, signaling pathways involved in the regulation of microglial immunometabolism in ischemic stroke remain to be further elucidated. In this study, using single-nuclei RNA sequencing, a microglial subcluster up-regulated in ischemic brain tissues is identified, with high expression of Igf1 and Trem2, neuroprotective transcriptional signature and enhanced oxidative phosphorylation. Microglial depletion by PLX3397 exacerbates ischemic brain damage, which is reversed by repopulating the microglia with high Igf1 and Trem2 phenotype. Mechanistically, Igf1 serves as one of the major down-stream molecules of Trem2, and Trem2-Igf1 signaling axis regulates microglial functional and metabolic profiles, exerting neuroprotective effects on ischemic stroke. Overexpression of Igf1 and supplementation of cyclocreatine restore microglial glucometabolic levels and cellular functions even in the absence of Trem2. These findings suggest that Trem2-Igf1 signaling axis reprograms microglial immunometabolic profiles and shifts microglia toward a neuroprotective phenotype, which has promising therapeutic potential in treating ischemic stroke.

Keywords: Trem2-Igf1 signaling pathway; ischemic stroke; microglia; oxidative phosphorylation.


Conflict of interest statement

The authors declare no conflict of interest.

Figures
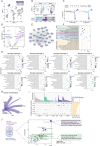
Figure 1
Figure 1
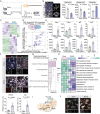
A microglial subcluster, identified in ischemic hemisphere after MCAO in mice. A) UMAP and unsupervised clustering of all cells and identification of microglia using specific microglial biomarkers. B) Re‐clustering of microglia, with subcluster 2 and subcluster 0 specifically colorized. Proportions of different microglial subclusters between Sham group and MCAO group. C) Pseudotime analysis of microglia clusters. Subcluster 2 and subcluster 0 were highlighted with different colors. D,E) Volcano plots and PPI analysis depicting differentially expressed genes (DEGs) between microglial subcluster 2 and subcluster 0. F) GO biological processes of the DEGs with respect to activities of other cell types and microglial functions under the threshold of p value < 0.05 and q value < 0.05. G) GO terms enriched for different microglial subclusters under the threshold of p value < 0.05 and q value < 0.05. H) CellChat interactions of microglia subcluster 2 with other cells. I) STRING analysis revealing ligand‐receptor interactions between microglial subcluster 2 and other cells. J) Comparison of the transcriptional profiles of microglial subcluster 2 and disease‐associated microglia (DAM).
Figure 2
Figure 2
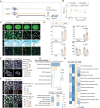
Activated microglial phenotype with enhanced glucometabolic levels and cellular activity. A) Schematic image of the workflow. B) Immunofluorescence staining and morphological analysis of Iba‐1+ microglia from both Sham‐operated group and MCAO ischemic lesions. Scale Bar: 50 µm for the left immunofluorescence plots, 10 µm for reconstructed 3D plots. N = 5 per group. Data are expressed as mean ± SD, Unpaired t‐test. C) Heatmap of all the differentially expressed genes between microglia from MCAO group and Sham‐operated group under the threshold of qvalue < 0.05 and absolute value of log2FoldChange > 0.5. D) Venn diagrams indicate significantly differentially expressed genes in each comparison, and report overlapping genes in Bulk‐RNA‐Seq and sn‐RNA‐Seq. E) Barplots showing the indicated gene expression in microglia sorted from Sham group and MCAO mice. F) Immunofluorescence staining and proportions of TREM2+ Iba‐1+ and IGF1+ Iba‐1+ cells in microglia. Scale Bar: 20 µm. G) IPA analysis of the DEGs identified between microglia sorted from wild‐type MCAO and sham‐operated group. H) Gene set variation analysis of the DEGs identified between microglia sorted from wild‐type MCAO and sham‐operated group. I) A brief plot depicting tricarboxylic acid cycle. Key enzyme such as Pyruvate Dehydration A (PDHA1) is highlighted. J) Representative images of immunofluorescence staining of PDHA1+IGF1+Iba‐1+ in ischemic lesions and Sham brains. Scale Bar: 20 µm.
Figure 3
Figure 3
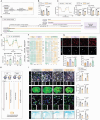
Microglia expressing Trem2 and Igf1 were indispensable in neurological recovery following ischemic stroke. A) Schematic plot illustrating three strategies adopted in this part of experiment. B,C) Immunofluorescence staining and quantitative analysis of Iba‐1+ microglia density in the ischemic hemisphere of Vehicle, depletion and repopulation mice at different time points (1 day, 3 days and 7 days) after surgery. N = 5 per group. Scale Bar: 500 µm. D) Heatmap showing microglial subcluster 2 genes expression detected by RT‐PCR. Vehicle versus Sham and Repop versus Sham. * P < 0.05, ** P < 0.01, *** P < 0.001, N = 4 per group. one‐way ANOVA followed by Bonferroni's post hoc test. E) Immunofluorescence staining and density of IGF1+ Iba‐1+, APOE+ Iba‐1+ and TREM2+ Iba‐1+ cells in microglia in Vehicle group, Depletion group and Repopulation group. Scale Bar: 20 µm. N = 5 per group. Data are expressed as mean ± SD, one‐way ANOVA followed by Bonferroni's post hoc test. F) Neurological deficits were evaluated using mNSS score. N = 10‐12 per group. Data are expressed as mean ± SD, one‐way ANOVA followed by Bonferroni's post hoc test, * P < 0.05 Vehicle versus Depletion group, ***P < 0.001 Vehicle versus Depletion group, ## P < 0.01 Repop versus Depletion group. G) Immunofluorescence staining of MAP2 and LFB staining of three different groups in the ischemic hemisphere of Vehicle, depletion and repopulation mice at 7 days post MCAO. Scale Bar: 1 mm. N = 5 per group. Data are expressed as mean ± SD, one‐way ANOVA followed by Bonferroni's post hoc test.
Figure 4
Figure 4
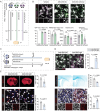
Trem2 deficiency exacerbates ischemic injury and dampens microglial functions. A) Schematic plot illustrating the workflow of this part of experiment. B) Neurological deficits were evaluated using mNSS score. N = 12 per group. Data are expressed as mean ± SD, two‐way ANOVA followed by Bonferroni's post hoc test, ***P < 0.001 versus the WT MCAO group. C) Immunofluorescence staining of MAP2, TUNEL+ NeuN+ apoptotic neurons, Olig2+ oligodendrocytes and LFB staining in mice of wild‐type sham, Trem2–/– sham, wild‐type MCAO, and Trem2–/– MCAO groups. Scale Bar: 1 mm for MAP2 staining and LFB staining, and 20 µm for the rest. D) Quantitative analysis of infarct area proportion, TUNEL+ NeuN+ apoptotic neurons proportion, demyelination area proportion and Olig2+ oligodendrocytes density. N = 5 per group. Data are expressed as mean ± SD, two‐way ANOVA followed by Bonferroni's post hoc test. E) Immunofluorescence staining and morphological analysis of Iba‐1+ microglia in wild‐type MCAO, and Trem2−/− MCAO mice. Scale Bar: 20 µm for immunofluorescence and 5 µm for 3D reconstruction. N = 5 per group. Data are expressed as mean ± SD, unpaired t‐test. F) Immunofluorescence staining and quantitative analysis of Iba‐1+Ki67+ proliferative microglia and Iba‐1+CD68+ phagocytic microglia in ischemic lesions of wild‐type and Trem2−/− mice. Scale Bar: 20 µm. N = 4–5 per group. Data are expressed as mean ± SD, unpaired t‐test. G) Ingenuity pathway analysis (IPA) of the differentially expressed genes between Trem2−/− MCAO and WT MCAO microglia. Pathways up‐regulated in Trem2−/− MCAO were marked in yellow and pathways down‐regulated were marked in blue. H) Gene set variation analysis (GSVA) of biological processes and pathways related with microglial activities and aerobic respiration in microglia from wild‐type sham, Trem2−/− sham, wild‐type MCAO, and Trem2−/− MCAO groups.
Figure 5
Figure 5
Trem2‐Igf1 signaling axis possibly regulates microglial metabolism and functions in ischemic stroke. A) Trend analysis of the Bulk‐RNA‐Seq data of the sorted microglia from the four groups (Wild‐type sham, Trem2−/− sham, Wild‐type MCAO, Trem2−/− MCAO). B) Venn diagrams indicate significantly differentially expressed genes in each comparison, and report 11 overlapping genes in Bulk‐RNA‐Seq, sn‐RNA‐Seq and group 1 identified in trend analysis. C) Barplots showing the indicated gene expression in microglia sorted from wild‐type sham, Trem2−/− sham, wild‐type MCAO, and Trem2−/− MCAO mice. Data are expressed as mean ± SD, N = 3–4 per group. D) Immunofluorescence staining of TREM2+ IGF1+ Iba‐1+ microglia in wild‐type MCAO and Trem2−/− MCAO mice. Scale Bar: 20 µm. N = 5 per group. Data are expressed as mean ± SD, unpaired t‐test. E) Gene Ontology enrichment analysis of biological processes based on the genes identified between microglia sorted from wild‐type MCAO and Trem2−/− MCAO mice. Biological processes with p value < 0.05 and q value < 0.05 are considered statistically significant. F) Heatmap depicting expression levels of genes related with oxidative phosphorylation, ATP metabolic pathways and Respirasome in microglia sorted from four groups (Wild‐type sham, Trem2−/− sham, Wild‐type MCAO, Trem2−/− MCAO).
Figure 6
Figure 6
Overexpression of Igf1 or supplementation of cyclocreatine boosts microglial OXPHOS and shows neuroprotective effects. A) Schematic plot of the workflow in wild‐type Control, Trem2−/− Control, wild‐type OGD/R, Trem2−/− OGD/R in vitro. B) Expression level of Igf1 in wild‐type Control, Trem2−/− Control, wild‐type OGD/R, Trem2−/− OGD/R detected by RT‐PCR. N = 4 per group, mean ± SD, two‐way ANOVA followed by Bonferroni's post hoc test. C) Oxygen consumption rate (OCR) was measured over time using a Seahorse XFe24 analyzer. Quantification of basal OCR and maximal OCR. N = 4 per group, mean ± SD, two‐way ANOVA followed by Bonferroni's post hoc test. D) Schematic plot of the workflow of Igf1 overexpression and cyclocreatine treatment in Trem2−/− microglia in vitro. E) Oxygen consumption rate (OCR) was measured over time using a Seahorse XFe24 analyzer. Quantification of basal OCR and maximal OCR. N = 4 per group, mean ± SD, Igf1‐transfection versus negative control (NC). Unpaired t test. F) Heatmap showing expression levels of genes related with phagocytosis, OXPHOS and tissue repair detected by RT‐PCR. N = 4 per group, mean ± SD, Cyclo versus Vehicle and Igf‐1 transfection versus NC. * P < 0.05, ** P < 0.01, *** P < 0.001, **** P < 0.0001, unpaired t test. G) Immunofluorescence staining of Mitotracker and Ki67+ proliferative microglia in the four groups: Vehicle, Cyclocreatine, Negative control, Igf1 transfection. Scale Bar: 20 µm. Quantitative analysis of Mean Fluorescence Intensity (MFI) of mitotracker per cell and Ki67+ proliferative microglia proportion. N = 4 per group. Data are expressed as mean ± SD, unpaired t test. H) Schematic plot of the workflow of cyclocreatine treatment in wild‐type and Trem2−/− mice. I. Immunofluorescence staining of TREM2+ IGF1+ Iba‐1+ microglia, MAP2, TUNEL+ NeuN+ apoptotic neurons, and LFB staining in mice of wild‐type Vehicle, wild‐type Cyclo, Trem2−/− Vehicle, and Trem2−/− Cyclo. Scale Bar: 1 mm for MAP2 staining and LFB staining and 20 µm for the rest. Quantitative analysis of IGF1+ Iba‐1+ microglia proportion, infarct area percentage, TUNEL+ NeuN+ apoptotic neurons proportion, and demyelination area proportion. N = 5 per group, two‐way ANOVA followed by Bonferroni's post hoc test.
Figure 7
Figure 7
Over‐expression of microglial Igf1 protects against ischemic stroke injuries. A) Workflow of the AAV‐DIO‐siTrem2 infection strategy. B) Validation of AAV infection efficiency and Trem2 silencing efficiency. Proportions of GFP positive microglia and TREM2 positive microglia were calculated, and morphological features of microglia across different groups were analyzed. N = 5, mean ± SD, one‐way ANOVA followed by Bonferroni's post hoc test. Scale Bar: 20 um. C) Workflow of the AAV‐DIO‐Igf1 overexpression strategy under Trem2 silencing. D) AAV‐DIO‐Igf1 infection boosts microglial Igf1 expression in ischemic stroke. Proportions of IGF1 positive microglia were analyzed between AAV‐DIO‐NC and AAV‐DIO‐Igf1 overexpression groups. N = 5, mean ± SD, one‐way ANOVA followed by Bonferroni's post hoc test. Scale Bar: 20 um. E) Immunofluorescence staining of MAP2, NeuN+TUNEL+ apoptotic neurons, LFB staining and Iba‐1+PDHA1+ in Cx3cr1‐Cre+ mice injected with AAV‐DIO‐siTrem2+AAV‐DIO‐Igf1 or AAV‐DIO‐siTrem2+AAV‐DIO‐NC. Scale Bar: 1 mm for MAP2 staining and LFB staining and 20 µm for NeuN/TUNEL staining. Quantitative analysis of infarct area percentage, TUNEL+ NeuN+ apoptotic neurons proportion, and demyelination area proportion. N = 5 per group, mean ± SD, unpaired t test.

References

    1. Montaner J., Ramiro L., Simats A., Tiedt S., Makris K., Jickling G. C., Debette S., Sanchez J.‐C., Bustamante A., Nat. Rev. Neurol. 2020, 16, 247. - PubMed
    1. a) Qin C., Zhou L.‐Q., Ma X.‐T., Hu Z.‐W., Yang S., Chen M., Bosco D. B., Wu L.‐J., Tian D.‐S., Neuroscience Bulletin 2019, 35, 921; - PMC - PubMed
    2. b) Ma Y., Wang J., Wang Y., Yang G.‐Y., Progress in Neurobiology 2017, 157, 247. - PubMed
    1. Shi L., Sun Z., Su W., Xu F., Xie D., Zhang Q., Dai X., Iyer K., Hitchens T. K., Foley L. M., Li S., Stolz D. B., Chen K., Ding Y., Thomson A. W., Leak R. K., Chen J., Hu X., Immunity 2021, 54, 1527. - PMC - PubMed
    1. Monsorno K., Buckinx A.n, Paolicelli R. C., Trends Endocrinol. Metab. 2022, 33, 186. - PubMed
    1. Van Den Bossche J., O'neill L. A., Menon D., Trends Immunol. 2017, 38, 395. - PubMed

Publication types

MeSH terms