

TGFA expression is associated with poor prognosis and promotes the development of cervical cancer
- PMID: 38152044
- PMCID: PMC10844698
- DOI: 10.1111/jcmm.18086
TGFA expression is associated with poor prognosis and promotes the development of cervical cancer
Abstract
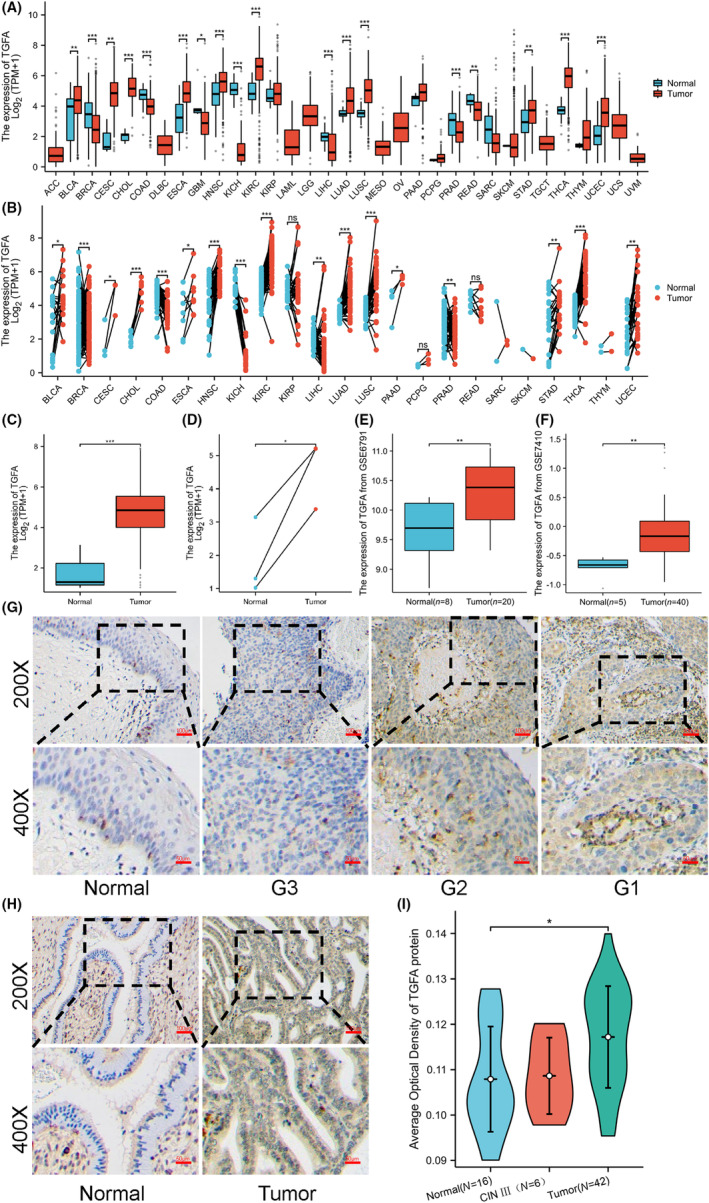
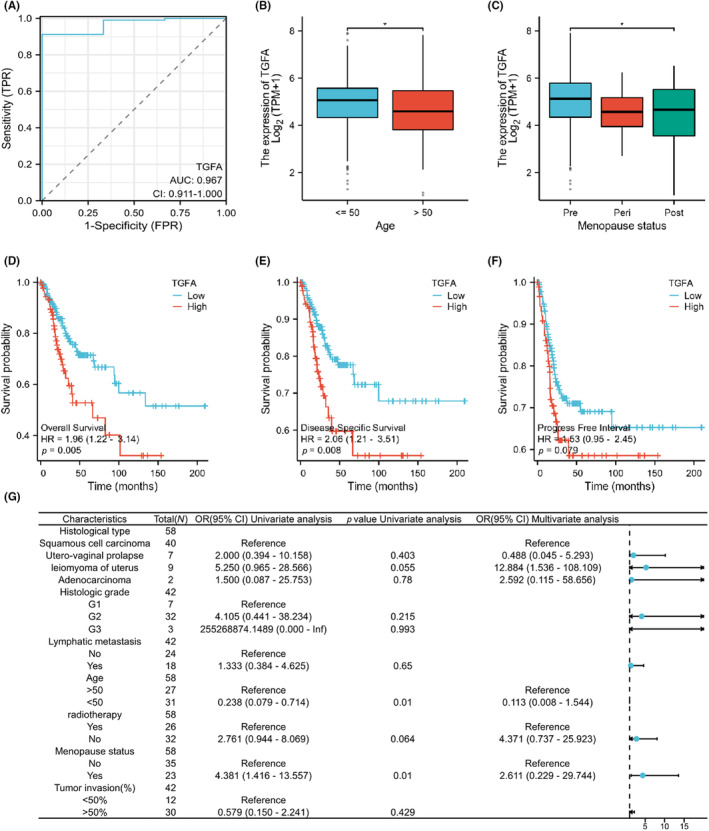
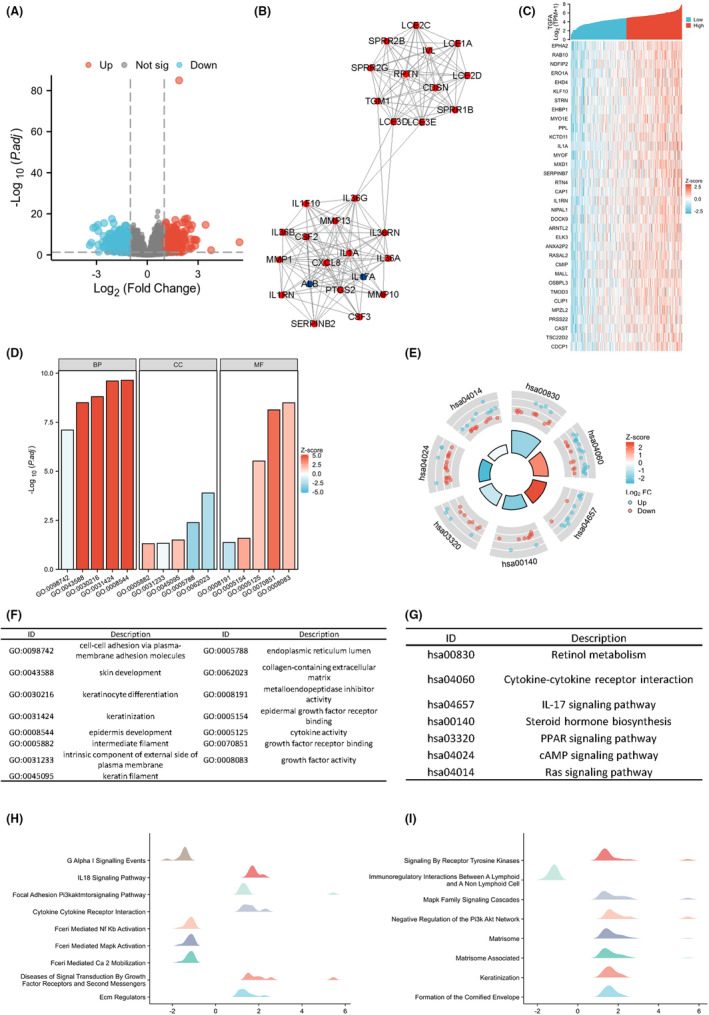
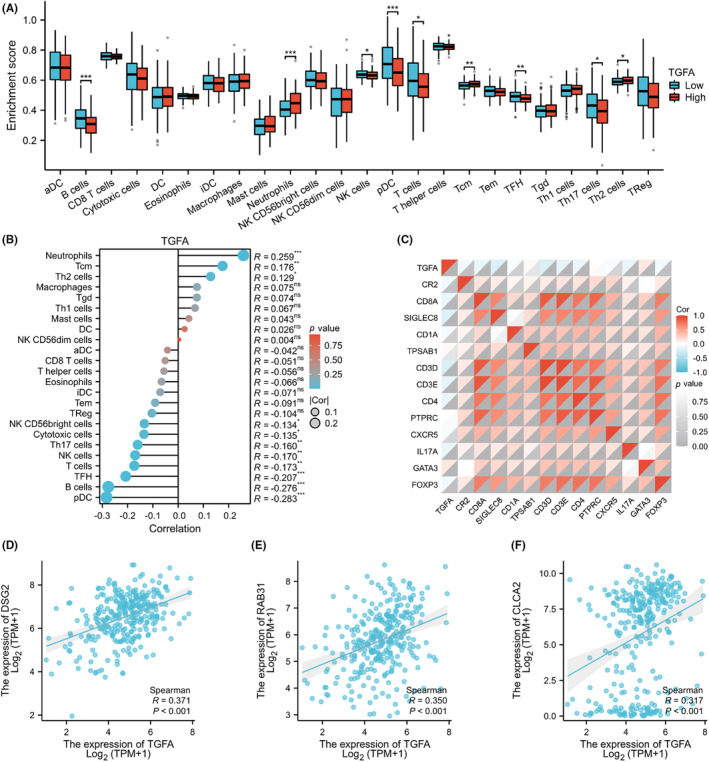
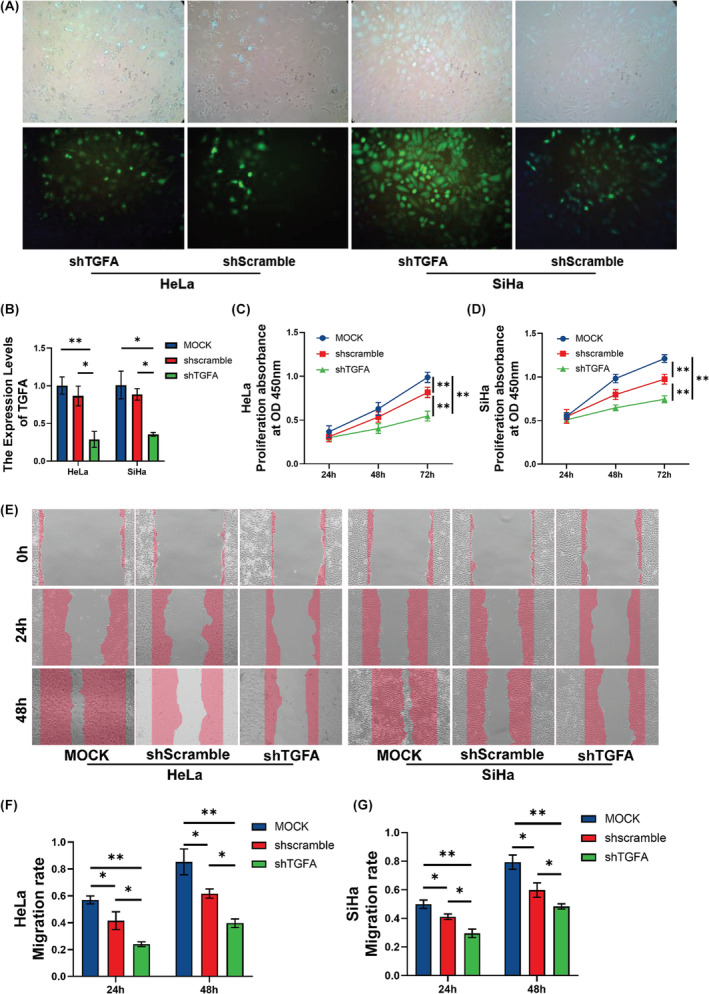
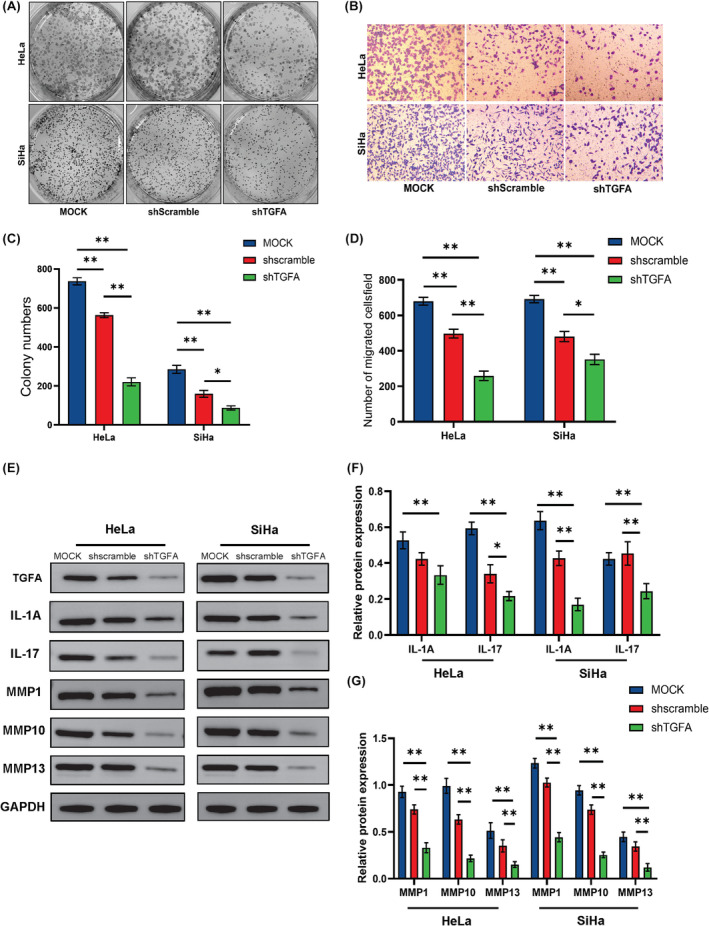
Cervical squamous cell carcinoma and endocervical adenocarcinoma (CESC) are the second most common cancers in women aged 20-39. While HPV screening can help with early detection of cervical cancer, many patients are already in the medium to late stages when they are identified. As a result, searching for novel biomarkers to predict CESC prognosis and propose molecular treatment targets is critical. TGFA is a polypeptide growth factor with a high affinity for the epidermal growth factor receptor. Several studies have shown that TGFA can improve cancer growth and progression, but data on its impact on the occurrence and advancement of CESC is limited. In this study, we used clinical data analysis and bioinformatics techniques to explore the relationship between TGFA and CESC. The results showed that TGFA was highly expressed in cervical cancer tissues and cells. TGFA knockdown can inhibit the proliferation, migration and invasion of cervical cancer cells. In addition, after TGFA knockout, the expression of IL family and MMP family proteins in CESC cell lines was significantly reduced. In conclusion, TGFA plays an important role in the occurrence and development of cervical cancer. Therefore, TGFA may become a new target for cervical cancer treatment.
Keywords: TGFA; bioinformatics; biomarker; cervical cancer; prognosis.
© 2023 The Authors. Journal of Cellular and Molecular Medicine published by Foundation for Cellular and Molecular Medicine and John Wiley & Sons Ltd.
Conflict of interest statement
The authors declare that they have no competing interests.
Figures
Similar articles
-
Exploration of potential therapeutic and prognostic value of CXC chemokines in cervical squamous cell carcinoma and endocervical adenocarcinoma based on bioinformatics analysis.Math Biosci Eng. 2021 Sep 18;18(6):8201-8222. doi: 10.3934/mbe.2021407. Math Biosci Eng. 2021. PMID: 34814296
-
Down-regulation of S1PR2 is correlated with poor prognosis and immune infiltrates in cervical squamous cell carcinoma and endocervical adenocarcinoma.Int J Immunopathol Pharmacol. 2023 Jan-Dec;37:3946320231178131. doi: 10.1177/03946320231178131. Int J Immunopathol Pharmacol. 2023. PMID: 37232164 Free PMC article.
-
ZNF695, A Potential Prognostic Biomarker, Correlates with Im mune Infiltrates in Cervical Squamous Cell Carcinoma and Endoce rvical Adenocarcinoma: Bioinformatic Analysis and Experimental Verification.Curr Gene Ther. 2024;24(5):441-452. doi: 10.2174/0115665232285216240228071244. Curr Gene Ther. 2024. PMID: 38441026
-
Metallothionein-like 5 expression is correlated with poor prognosis and promotes proliferation of cervical squamous cell carcinoma.Bioengineered. 2022 Mar;13(3):6955-6965. doi: 10.1080/21655979.2022.2036901. Bioengineered. 2022. PMID: 35249447 Free PMC article.
-
ZIC5 promotes aggressiveness and cancer stemness in cervical squamous cell carcinoma.Pathol Res Pract. 2023 Jan;241:154268. doi: 10.1016/j.prp.2022.154268. Epub 2022 Dec 5. Pathol Res Pract. 2023. PMID: 36495760
Cited by
-
Knockdown of HGH1 in breast cancer cell lines can inhibit the viability, invasion and migration of tumor cells.Cell Adh Migr. 2025 Dec;19(1):1-14. doi: 10.1080/19336918.2024.2442349. Epub 2024 Dec 18. Cell Adh Migr. 2025. PMID: 39691959 Free PMC article.
-
N6-methyladenosine RNA modification regulates the transcription of SLC7A11 through KDM6B and GATA3 to modulate ferroptosis.J Biomed Sci. 2025 Jan 13;32(1):8. doi: 10.1186/s12929-024-01100-y. J Biomed Sci. 2025. PMID: 39800682 Free PMC article.
-
The S341P mutant MYOC renders the trabecular meshwork sensitive to cyclic mechanical stretch.Heliyon. 2024 Aug 29;10(17):e37137. doi: 10.1016/j.heliyon.2024.e37137. eCollection 2024 Sep 15. Heliyon. 2024. PMID: 39286096 Free PMC article.
References
-
- Siegel RL, Miller KD, Fuchs HE, Jemal A. Cancer statistics, 2022. CA Cancer J Clin. 2022;72(1):7‐33. - PubMed
-
- Berman TA, Schiller JT. Human papillomavirus in cervical cancer and oropharyngeal cancer: one cause, two diseases. Cancer. 2017;123(12):2219‐2229. - PubMed
-
- Markowitz LE, Liu G, Hariri S, Steinau M, Dunne EF, Unger ER. Prevalence of HPV after introduction of the vaccination program in the United States. Pediatrics. 2016;137(3):e20151968. - PubMed
-
- Tsu V, Jerónimo J. Saving the World's women from cervical cancer. N Engl J Med. 2016;374(26):2509‐2511. - PubMed
-
- Kudlow JE, Bjorge JD. TGF alpha in normal physiology. Semin Cancer Biol. 1990;1(4):293‐302. - PubMed
Publication types
MeSH terms
Substances
Grants and funding
LinkOut - more resources
Full Text Sources
Medical
Molecular Biology Databases
Research Materials
