

Comparison of the effects of BDNF/TRKB signalling on metabolic biomarkers in the liver of sedentary and trained rats with normal and knockout BDNF genotypes
- PMID: 38152248
- PMCID: PMC10751318
- DOI: 10.3389/fphys.2023.1268648
Comparison of the effects of BDNF/TRKB signalling on metabolic biomarkers in the liver of sedentary and trained rats with normal and knockout BDNF genotypes
Abstract
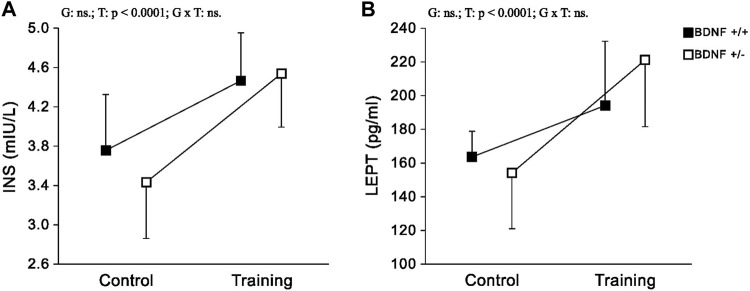
Introduction: The effect of brain-derived neurotrophic factor (BDNF) on the modulation of metabolic processes in the liver is poorly understood. Therefore, the aim of this study was to investigate whether hepatic concentrations or activities of metabolic biomarkers depend on altered BDNF/TrkB content in the liver, resulting from different BDNF genotypes of rats. In addition, it was assessed whether 5-week moderate endurance training modifies the levels of BDNF/Trk-B signaling and studied hepatic markers. Methods: Experiments were performed on wild-type and heterozygous BDNF knockout (HET, SD-Bdnf) rats, which were divided into four groups: control with normal genotype (Bdnf+/+), control with BDNF knockout genotype (Bdnf+/-), trained with normal genotype (Bdnf+/+T) and trained with BDNF knockout genotype (Bdnf +/-T). BDNF/TrkB concentrations as well as selected metabolic biomarkers including lipids-total cholesterol (CHOL), low-density lipoprotein (LDL), triglycerides (TG); enzymes-alanine aminotransferase (ALAT), aspartate aminotransferase (ASAT), gamma-glutamyl transferase (GGT), lactate dehydrogenase (LDH), alkaline phosphatase (ALP); hormones-insulin (INS) and leptin (LEPT) as well as interleukin-6 (IL-6) as regeneration indicator were measured directly in liver homogenates. Results and Discussion: The study showed that Bdnf+/- rats exhibited reduced BDNF/TrkB signaling (BDNF, p < 0.0001; Trk-B, p = 0.0005), altered lipid levels (CHOL, p < 0.0001; LDL, p < 0.0001; TG, p = 0.0006) and reduced hepatic ALAT (p = 0.0004) and GGT (p < 0.0001) activity, which may contribute to hepatic steatosis and obesity, as well as indicate impairment of specific metabolic pathways in the liver. Interestingly, endurance training did not alter hepatic BDNF and TrkB content, but improved ALAT (p = 0.0366) and ASAT (p = 0.0191) activities and increased hepatic IL-6 (p = 0.0422) levels in Bdnf +/- rats, suggesting enhanced liver regeneration in animals with BDNF allele loss.
Keywords: BDNF; endurance training; knockout genotype; liver; rats.
Copyright © 2023 Grzelak, Kaczmarek and Mrówczyński.
Conflict of interest statement
The authors declare that the research was conducted in the absence of any commercial or financial relationships that could be construed as a potential conflict of interest.
Figures


Similar articles
-
Myocardial Disorders in BDNF-Deficient Rats: Limited Recovery Post-Moderate Endurance Training.Diabetes Metab Syndr Obes. 2024 Dec 5;17:4649-4660. doi: 10.2147/DMSO.S486807. eCollection 2024. Diabetes Metab Syndr Obes. 2024. PMID: 39654953 Free PMC article.
-
Influence of altered serum and muscle concentrations of BDNF on electrophysiological properties of spinal motoneurons in wild-type and BDNF-knockout rats.Sci Rep. 2023 Mar 20;13(1):4571. doi: 10.1038/s41598-023-31703-8. Sci Rep. 2023. PMID: 36941445 Free PMC article.
-
Effects of exercise training and TrkB blockade on cardiac function and BDNF-TrkB signaling postmyocardial infarction in rats.Am J Physiol Heart Circ Physiol. 2018 Dec 1;315(6):H1821-H1834. doi: 10.1152/ajpheart.00245.2018. Epub 2018 Oct 12. Am J Physiol Heart Circ Physiol. 2018. PMID: 30311496
-
[Mechanism of catgut embedding at back-shu points for nonalcoholic steatohepatitis based on IKK/IKB/NF-κB signaling pathway].Zhongguo Zhen Jiu. 2020 Jan 12;40(1):59-66. doi: 10.13703/j.0255-2930.20181204-0002. Zhongguo Zhen Jiu. 2020. PMID: 31930901 Chinese.
-
Crosstalk between the muscular estrogen receptor α and BDNF/TrkB signaling alleviates metabolic syndrome via 7,8-dihydroxyflavone in female mice.Mol Metab. 2021 Mar;45:101149. doi: 10.1016/j.molmet.2020.101149. Epub 2020 Dec 19. Mol Metab. 2021. PMID: 33352311 Free PMC article.
Cited by
-
Ketamine attenuates kidney damage and depression-like behaviors in mice with cisplatin-induced acute kidney injury.Transl Psychiatry. 2024 Nov 9;14(1):468. doi: 10.1038/s41398-024-03176-4. Transl Psychiatry. 2024. PMID: 39521765 Free PMC article.
-
The interaction of BDNF with estrogen in the development of hypertension and obesity, particularly during menopause.Front Endocrinol (Lausanne). 2024 Nov 25;15:1384159. doi: 10.3389/fendo.2024.1384159. eCollection 2024. Front Endocrinol (Lausanne). 2024. PMID: 39655343 Free PMC article. Review.
-
Myocardial Disorders in BDNF-Deficient Rats: Limited Recovery Post-Moderate Endurance Training.Diabetes Metab Syndr Obes. 2024 Dec 5;17:4649-4660. doi: 10.2147/DMSO.S486807. eCollection 2024. Diabetes Metab Syndr Obes. 2024. PMID: 39654953 Free PMC article.
References
LinkOut - more resources
Full Text Sources
Miscellaneous