

Comprehensive Integration of Multiple Single-Cell Transcriptomic Data Sets Defines Distinct Cell Populations and Their Phenotypic Changes in Murine Atherosclerosis
- PMID: 38152886
- PMCID: PMC11285358
- DOI: 10.1161/ATVBAHA.123.320030
Comprehensive Integration of Multiple Single-Cell Transcriptomic Data Sets Defines Distinct Cell Populations and Their Phenotypic Changes in Murine Atherosclerosis
Abstract
Background: The application of single-cell transcriptomic (single-cell RNA sequencing) analysis to the study of atherosclerosis has provided unique insights into the molecular and genetic mechanisms that mediate disease risk and pathophysiology. However, nonstandardized methodologies and relatively high costs associated with the technique have limited the size and replication of existing data sets and created disparate or contradictory findings that have fostered misunderstanding and controversy.
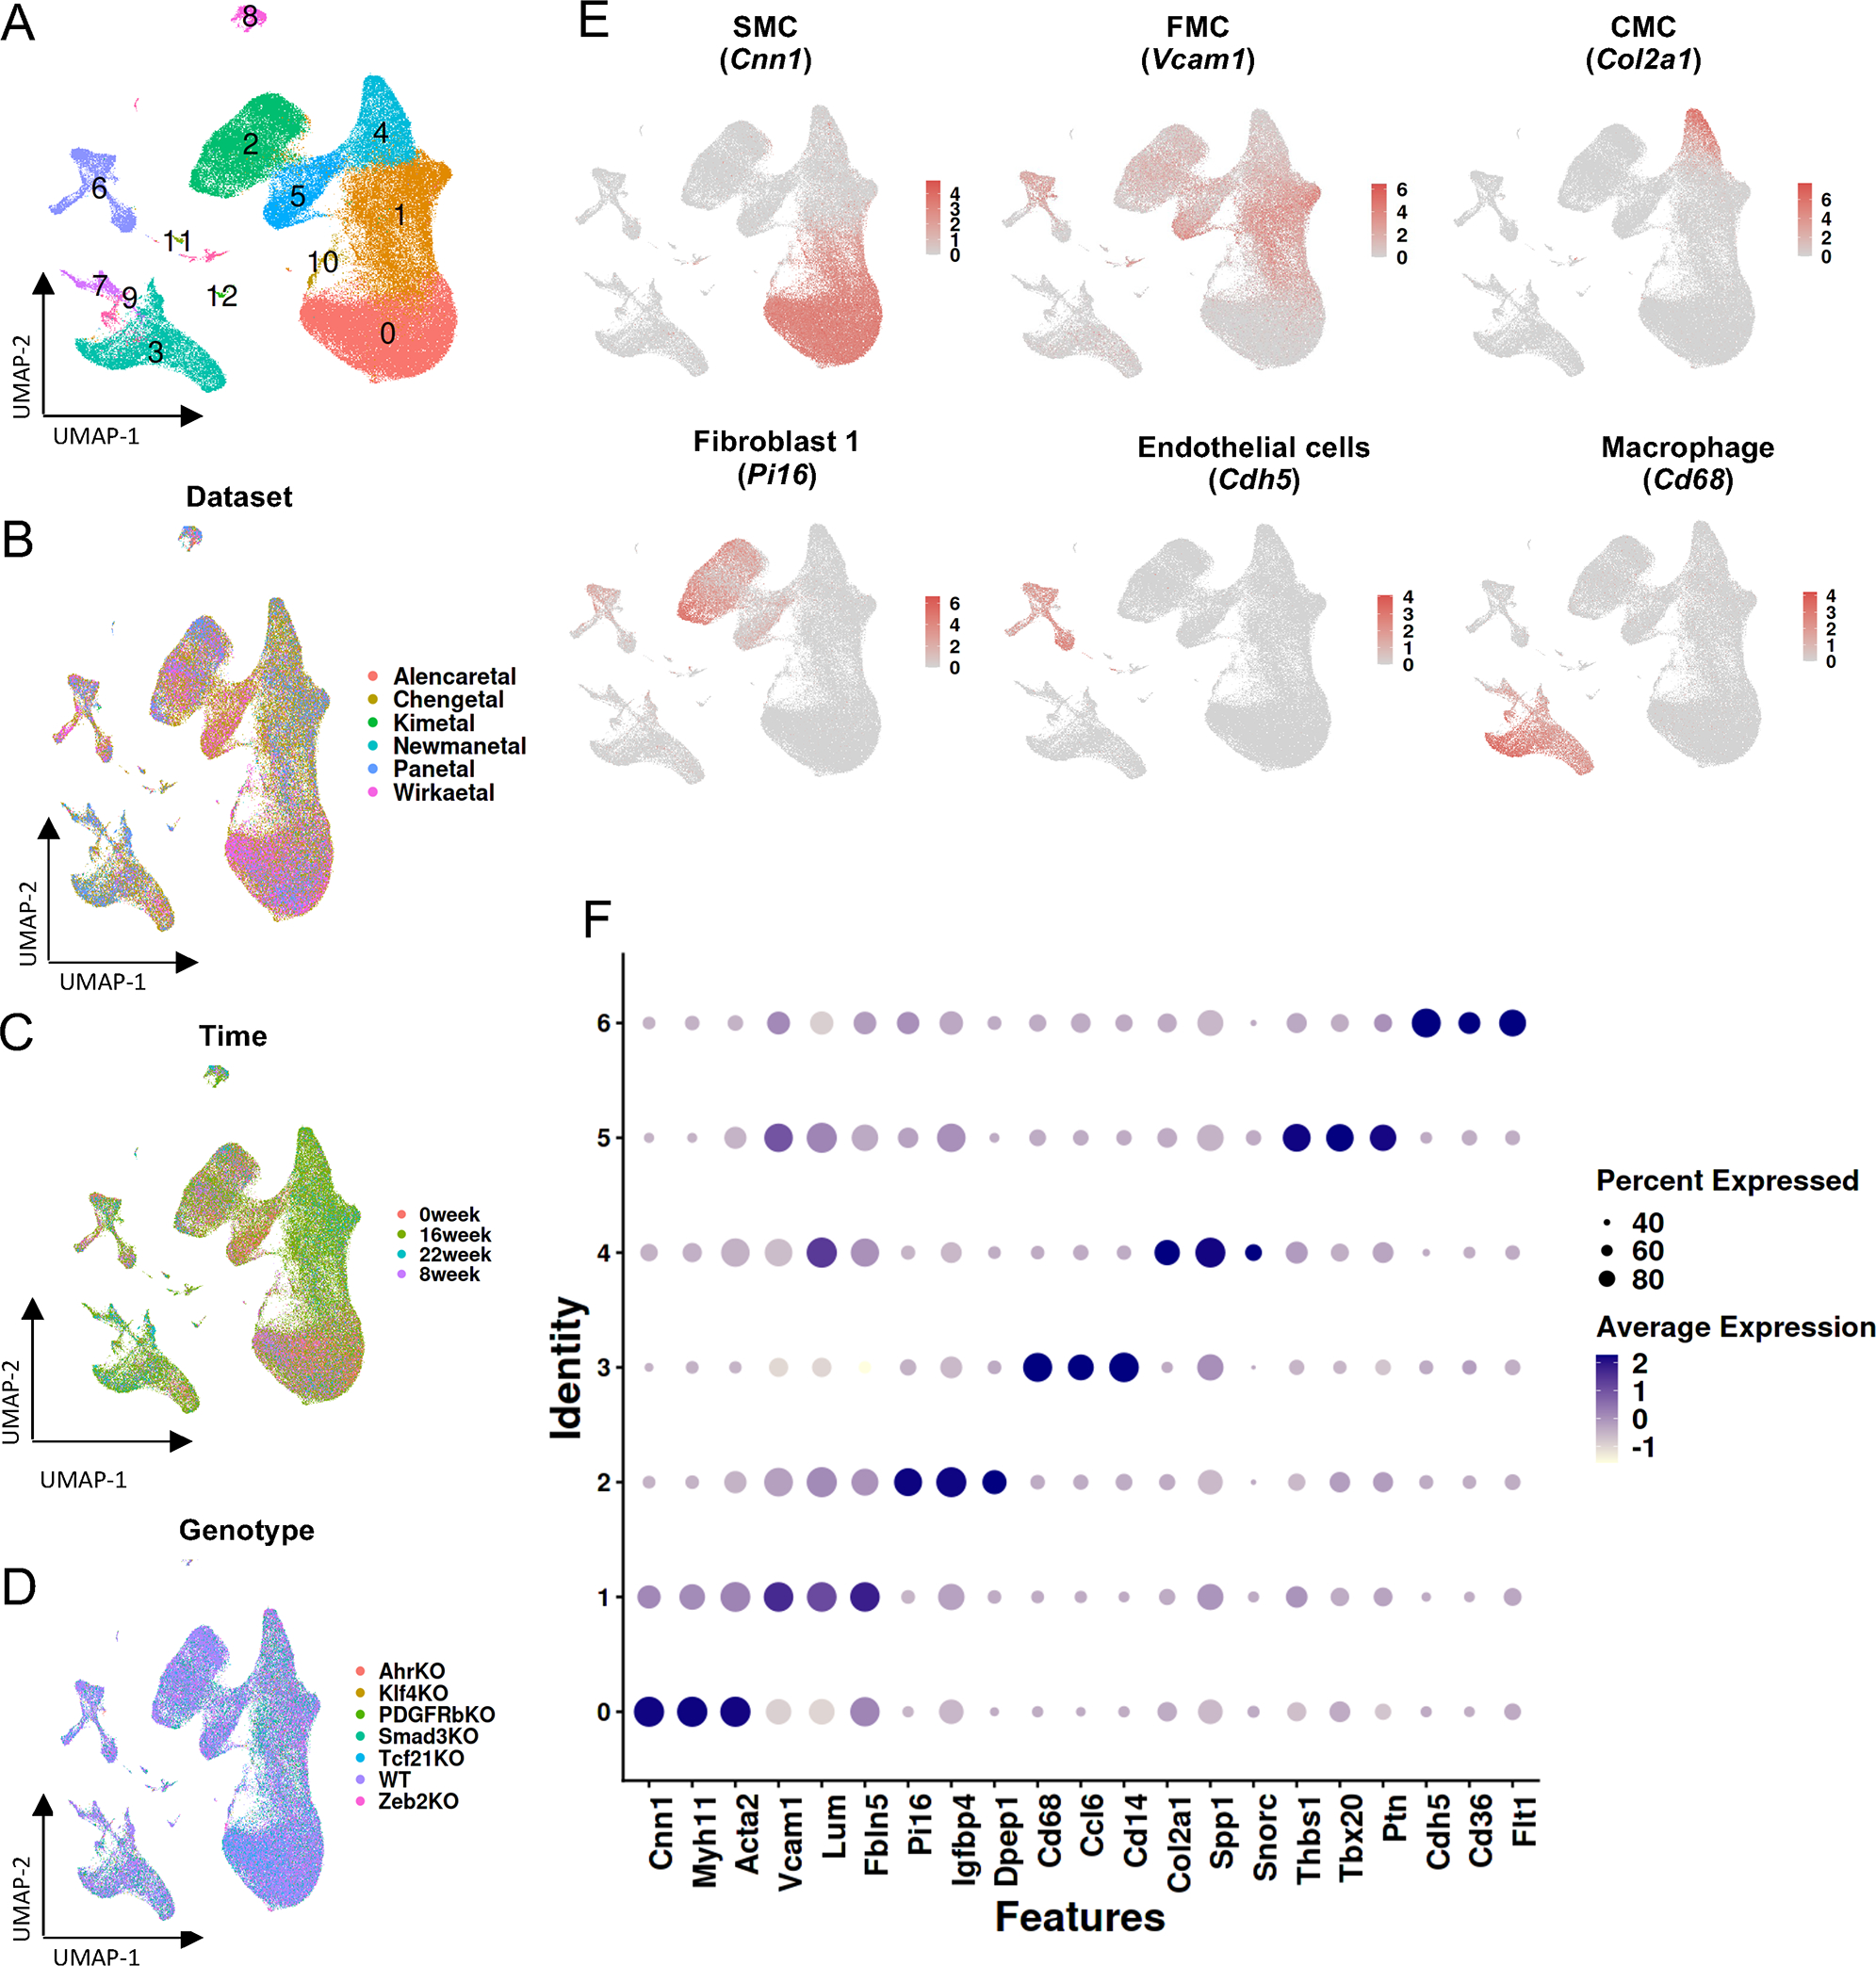
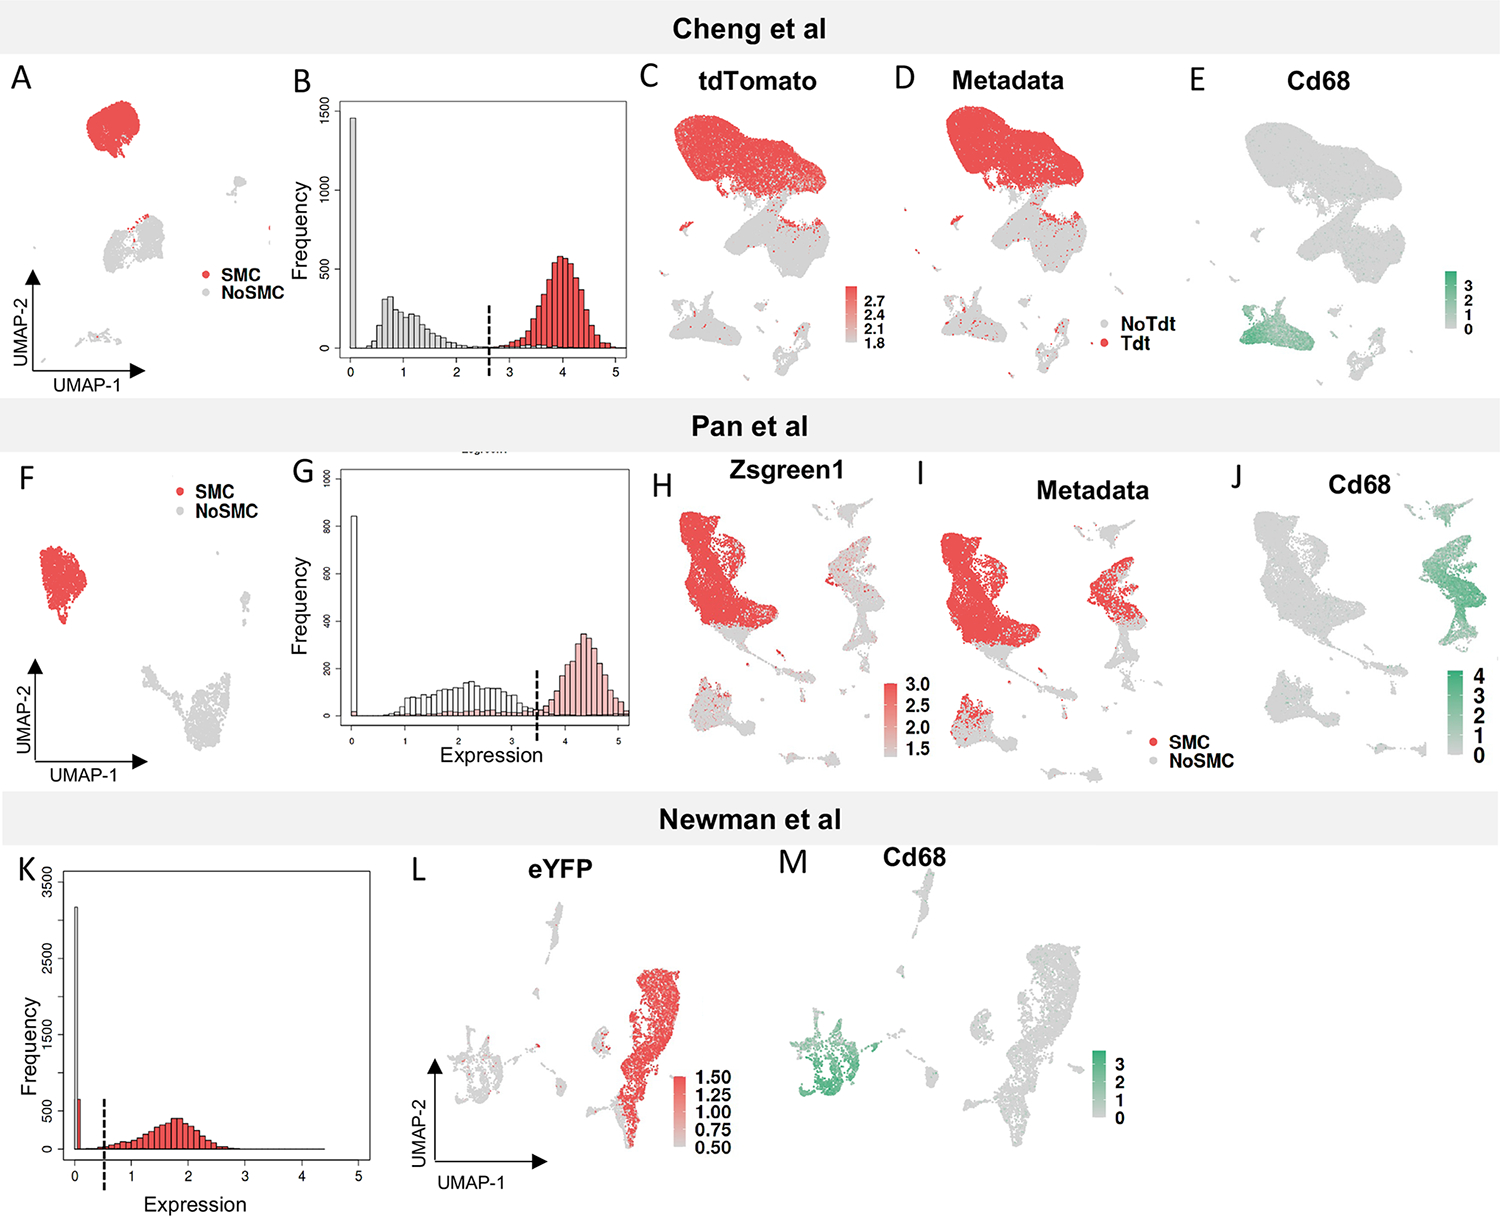
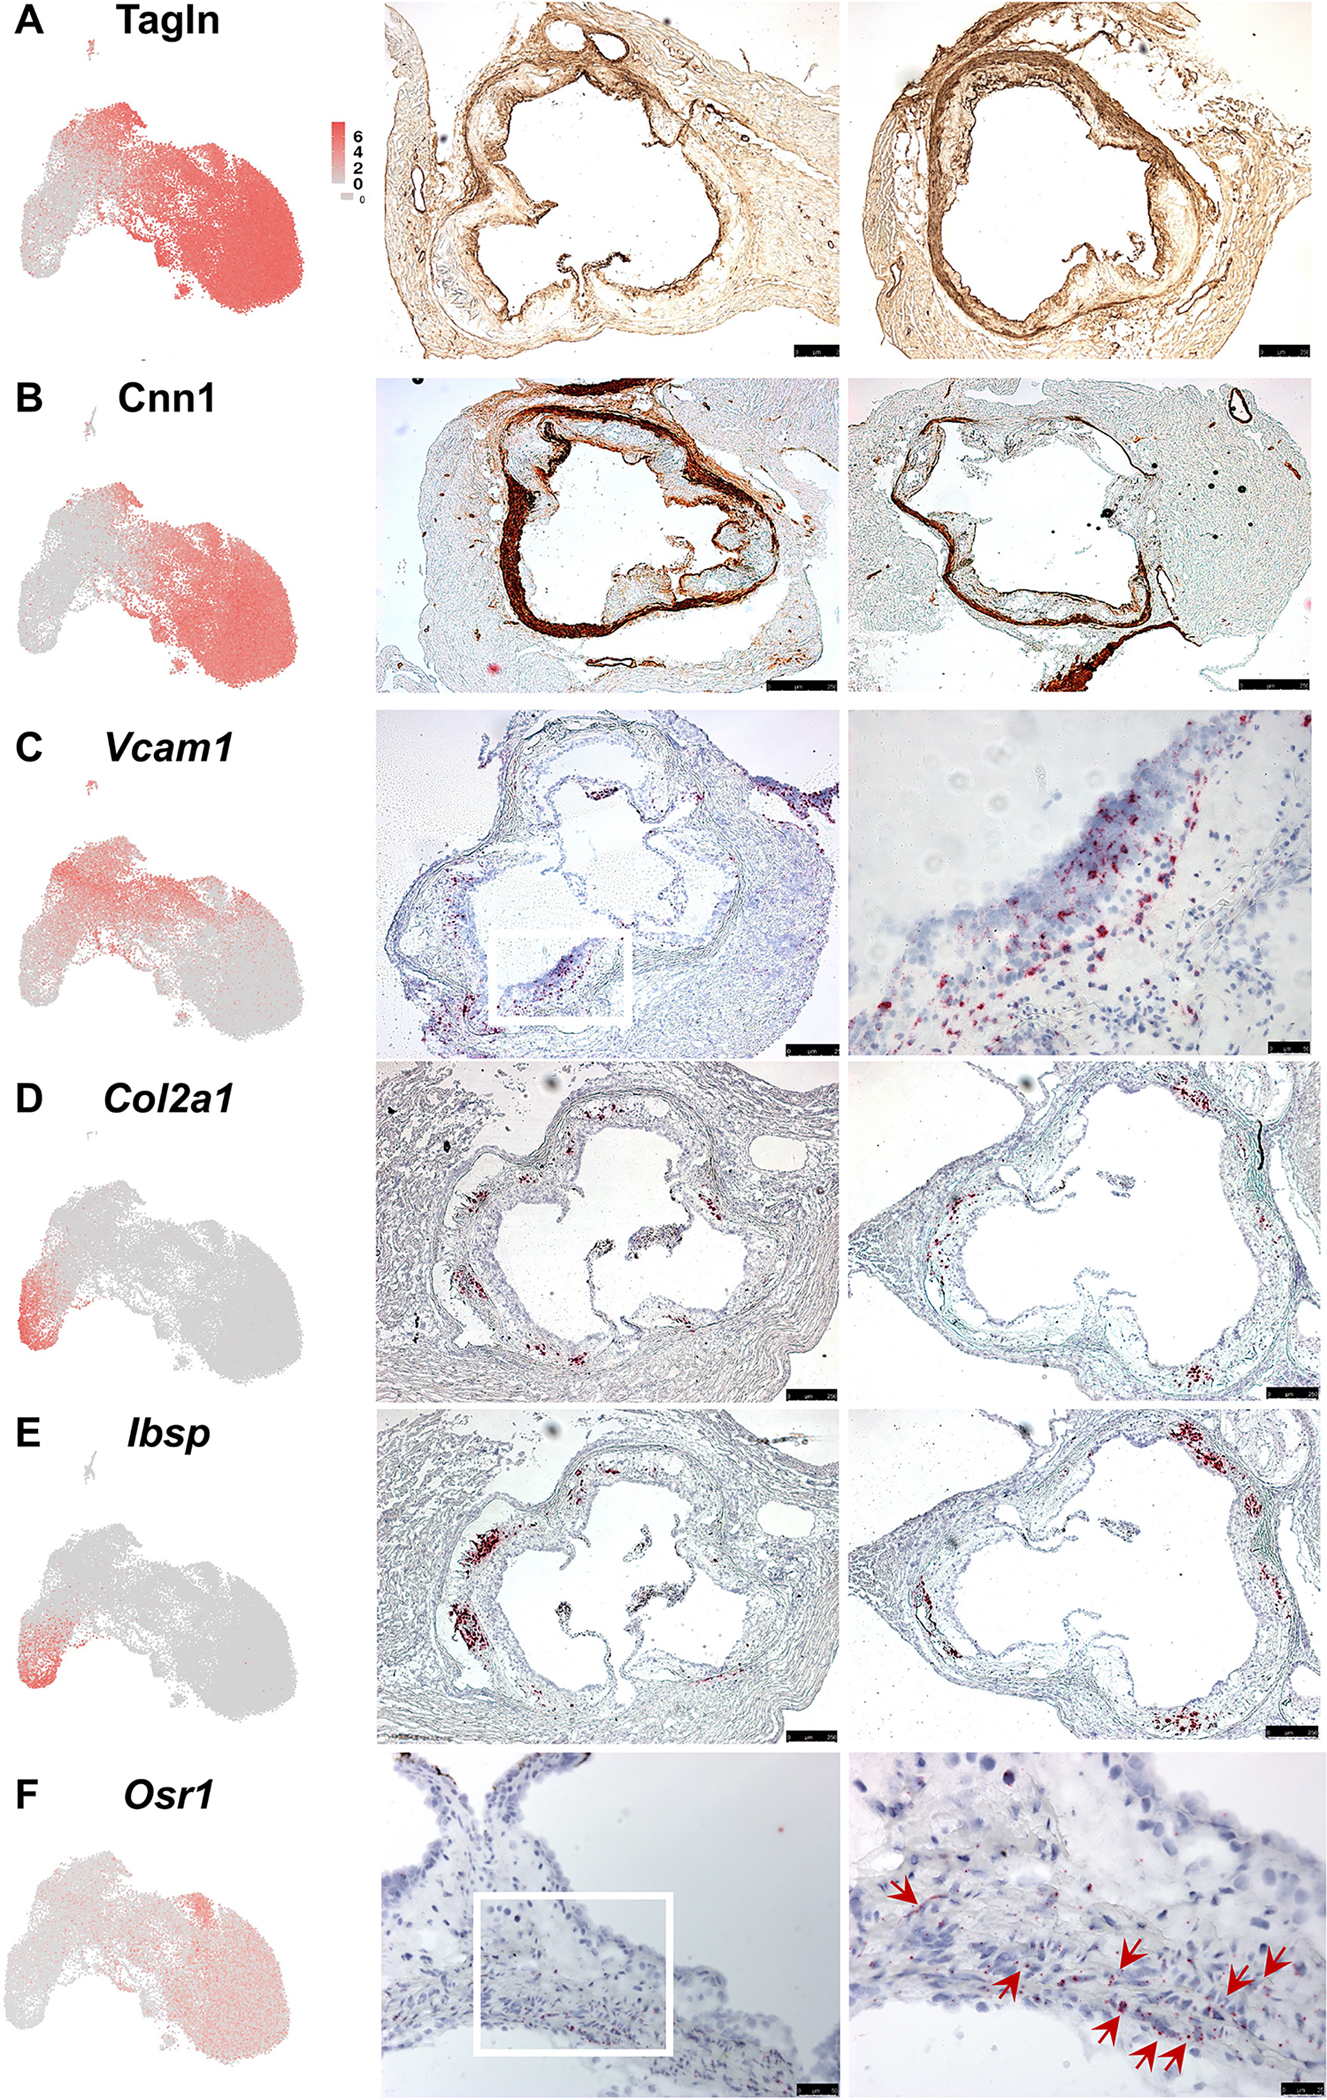
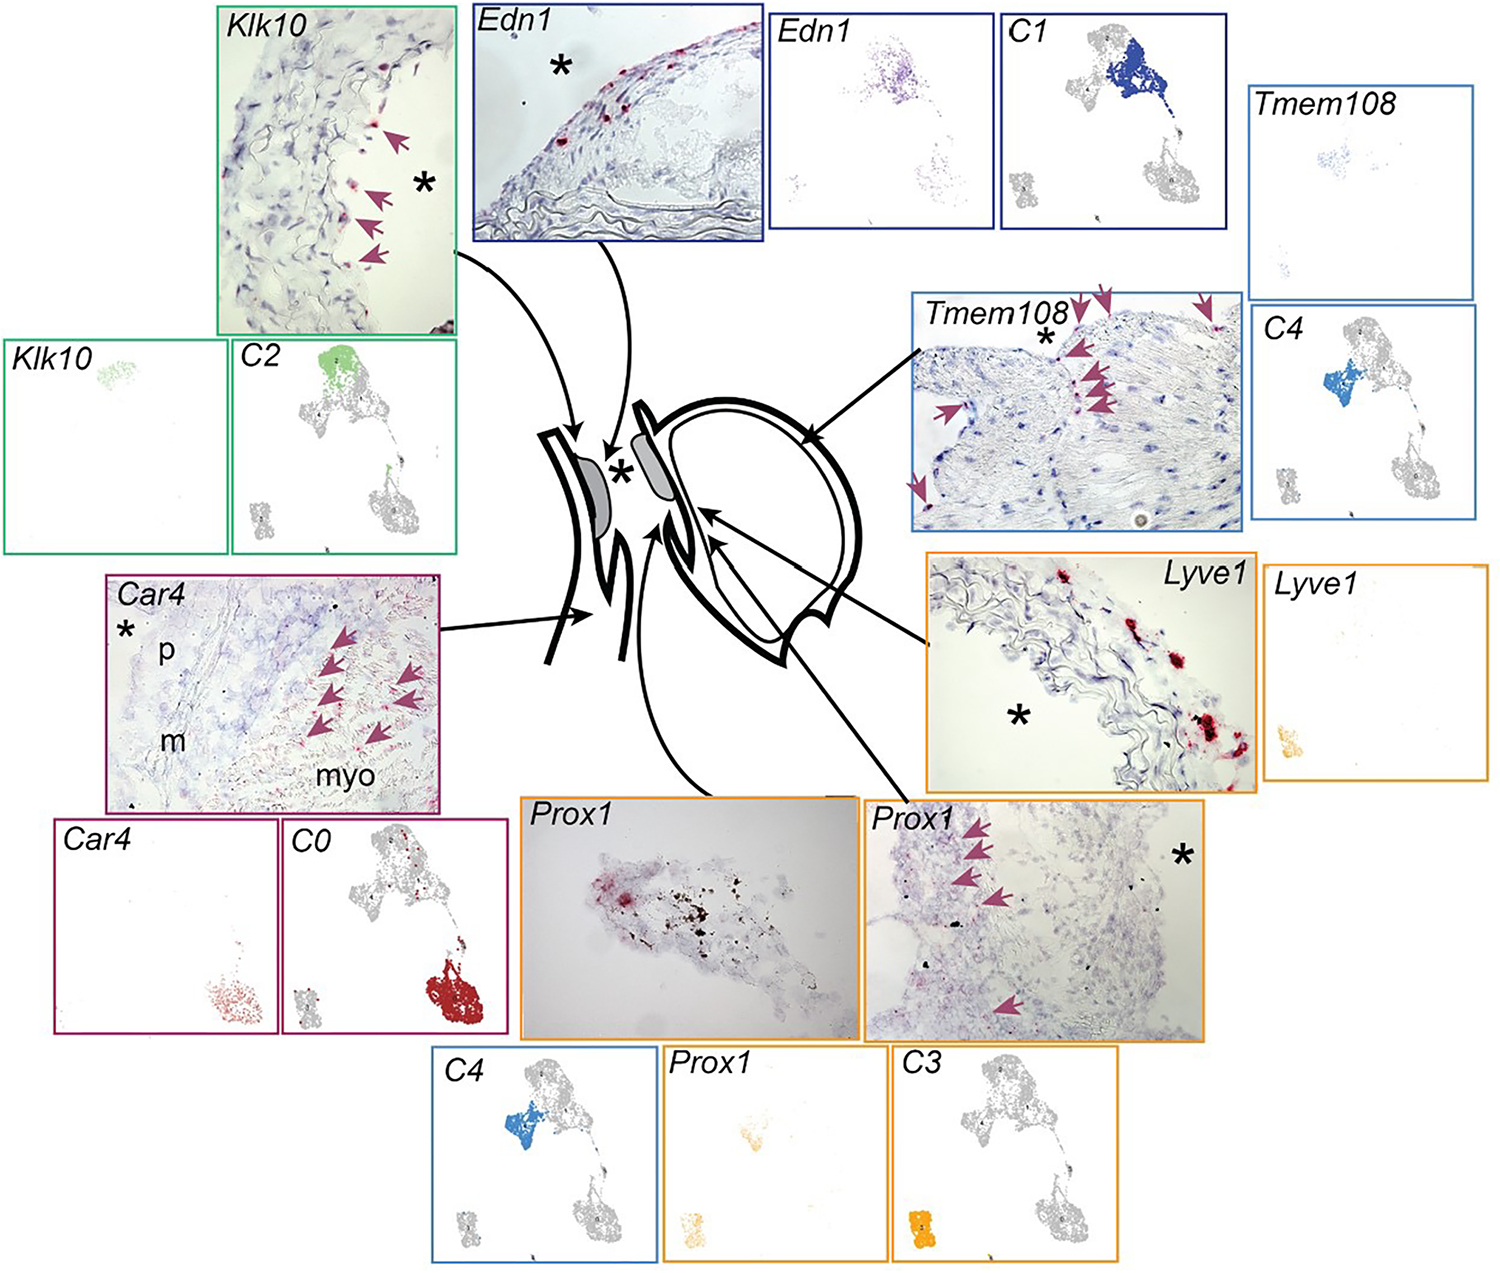
Methods: To address these uncertainties, we have performed a conservative integration of multiple published single-cell RNA sequencing data sets into a single meta-analysis, performed extended analysis of native resident vascular cells, and used in situ hybridization to map the disease anatomic location of the identified cluster cells. To investigate the transdifferentiation of smooth muscle cells to macrophage phenotype, we have developed a classifying algorithm based on the quantification of reporter transgene expression.
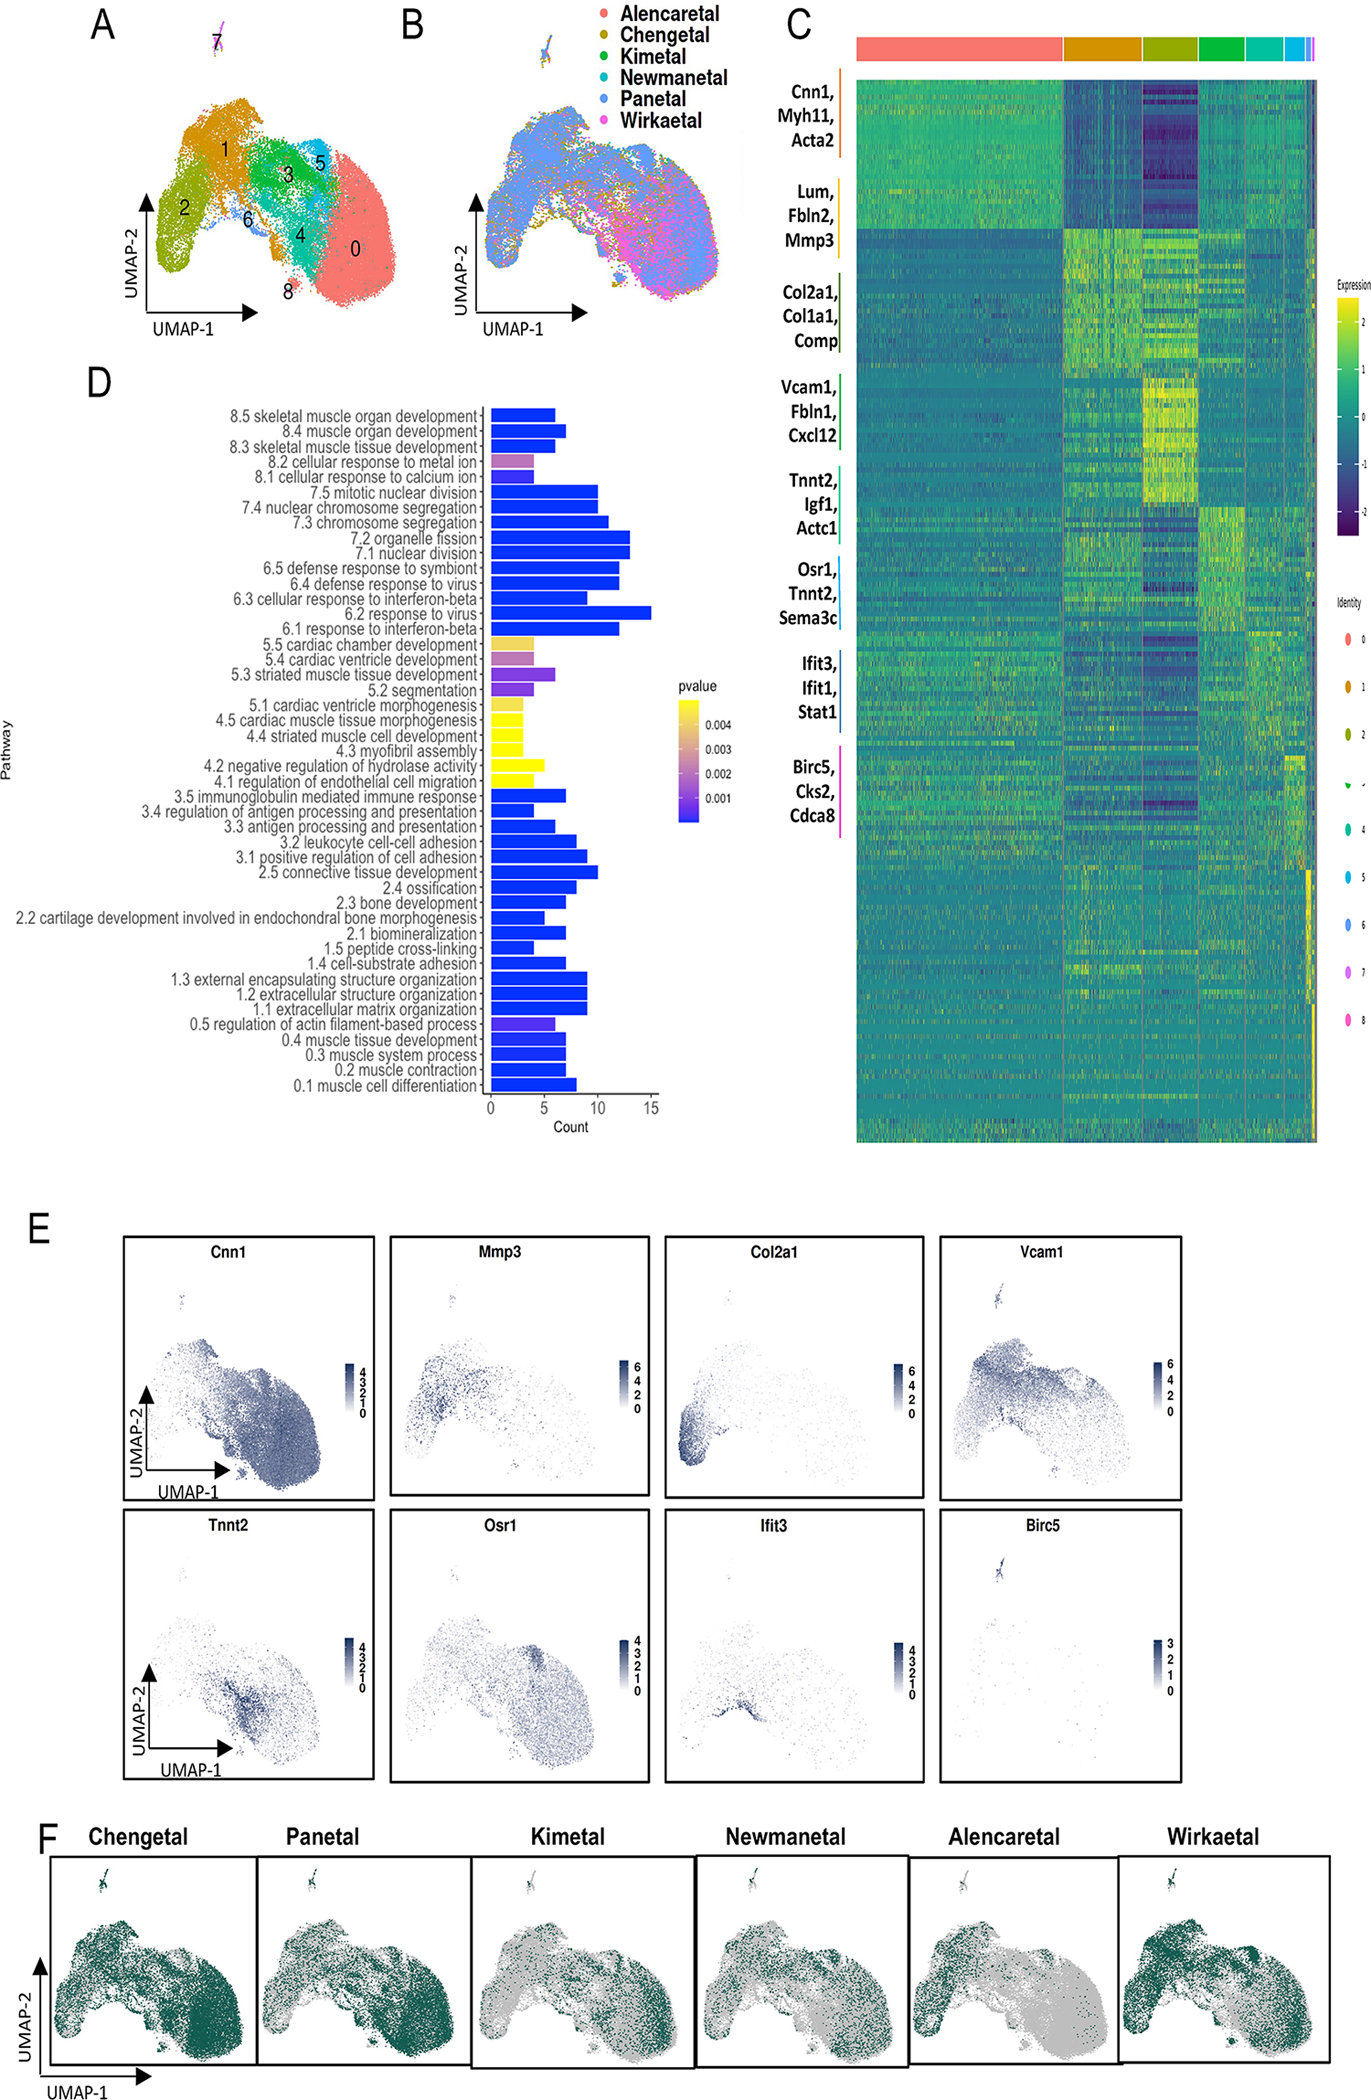
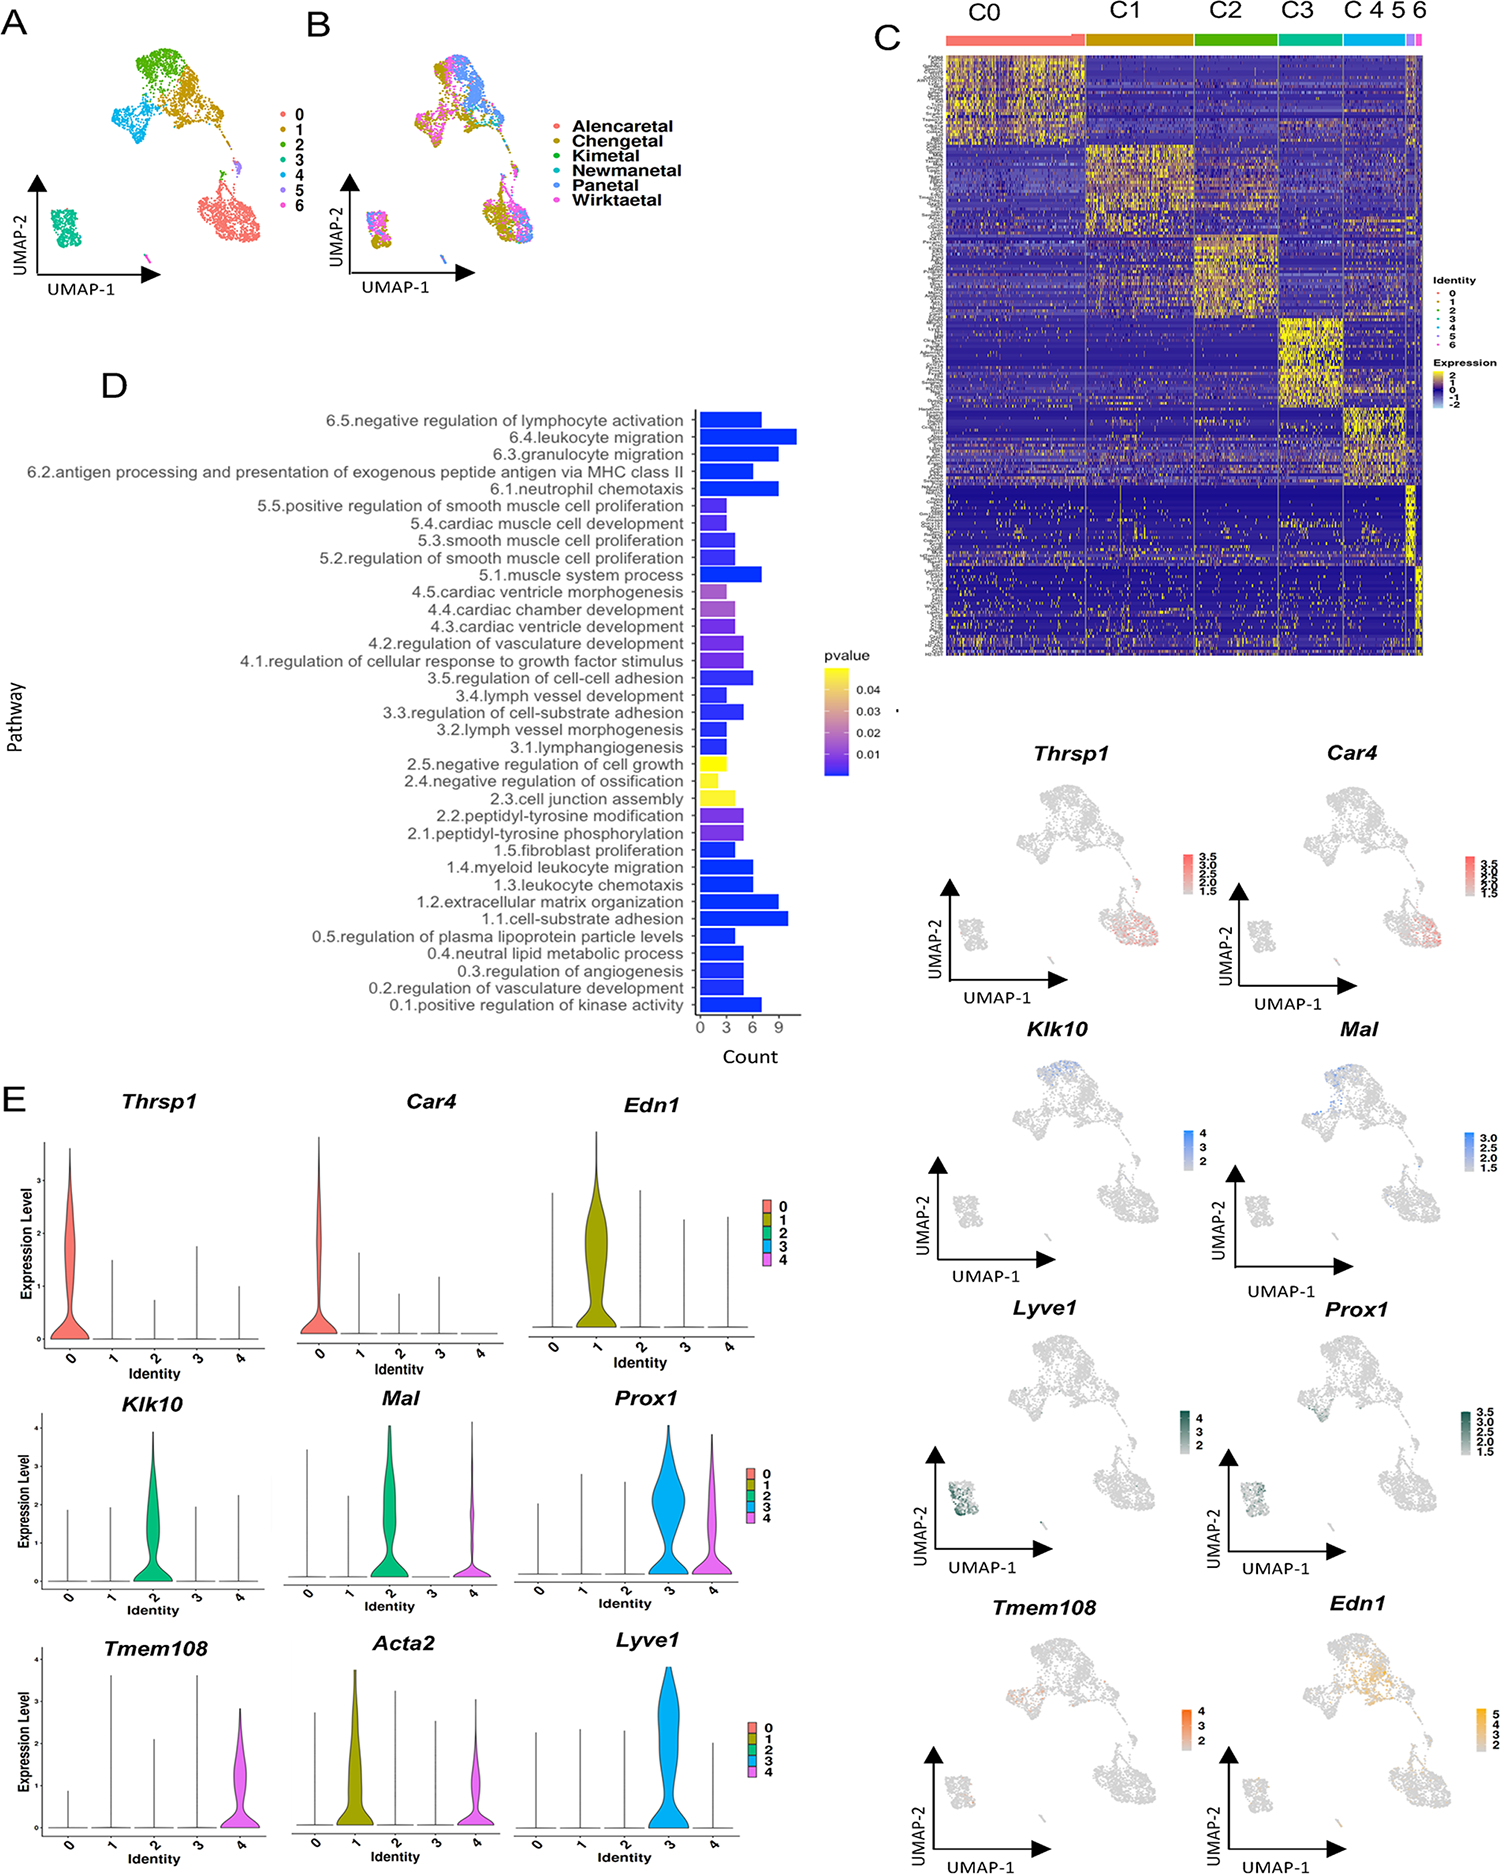
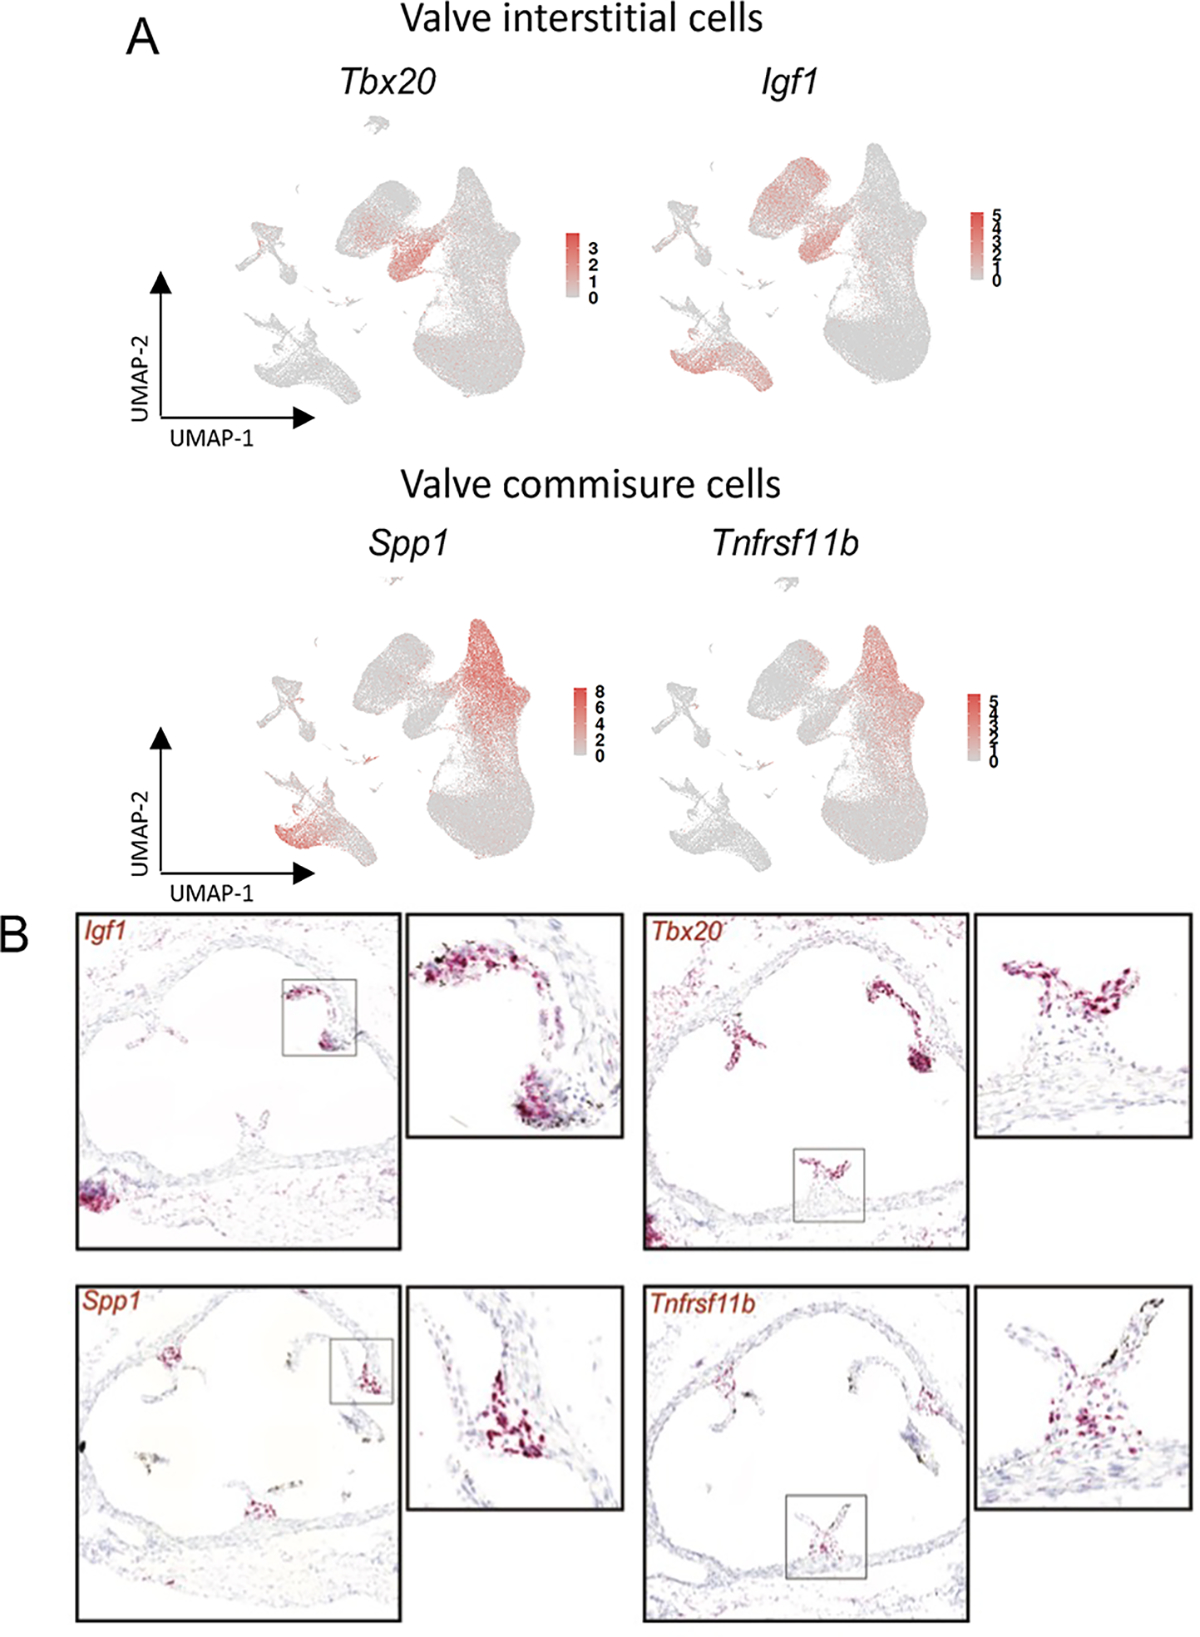
Results: The reporter gene expression tool indicates that within the experimental limits of the examined studies, transdifferentiation of smooth muscle cell to the macrophage lineage is extremely rare. Validated transition smooth muscle cell phenotypes were defined by clustering, and the location of these cells was mapped to lesion anatomy with in situ hybridization. We have also characterized 5 endothelial cell phenotypes and linked these cellular species to different vascular structures and functions. Finally, we have identified a transcriptomically unique cellular phenotype that constitutes the aortic valve.
Conclusions: Taken together, these analyses resolve a number of outstanding issues related to differing results reported with vascular disease single-cell RNA sequencing studies, and significantly extend our understanding of the role of resident vascular cells in anatomy and disease.
Keywords: algorithms; aortic valve; disease; gene expression; phenotype.
Conflict of interest statement
Figures
Similar articles
-
Single-cell RNA sequencing reveals the cellular heterogeneity of aneurysmal infrarenal abdominal aorta.Cardiovasc Res. 2021 Apr 23;117(5):1402-1416. doi: 10.1093/cvr/cvaa214. Cardiovasc Res. 2021. PMID: 32678909 Free PMC article.
-
Microanatomy of the Human Atherosclerotic Plaque by Single-Cell Transcriptomics.Circ Res. 2020 Nov 6;127(11):1437-1455. doi: 10.1161/CIRCRESAHA.120.316770. Epub 2020 Sep 28. Circ Res. 2020. PMID: 32981416 Free PMC article.
-
CD8+ T Cells Drive Plaque Smooth Muscle Cell Dedifferentiation in Experimental Atherosclerosis.Arterioscler Thromb Vasc Biol. 2024 Aug;44(8):1852-1872. doi: 10.1161/ATVBAHA.123.320084. Epub 2024 Jun 13. Arterioscler Thromb Vasc Biol. 2024. PMID: 38868941
-
An update on the phenotypic switching of vascular smooth muscle cells in the pathogenesis of atherosclerosis.Cell Mol Life Sci. 2021 Dec 22;79(1):6. doi: 10.1007/s00018-021-04079-z. Cell Mol Life Sci. 2021. PMID: 34936041 Free PMC article. Review.
-
Six Shades of Vascular Smooth Muscle Cells Illuminated by KLF4 (Krüppel-Like Factor 4).Arterioscler Thromb Vasc Biol. 2021 Nov;41(11):2693-2707. doi: 10.1161/ATVBAHA.121.316600. Epub 2021 Sep 2. Arterioscler Thromb Vasc Biol. 2021. PMID: 34470477 Free PMC article. Review.
Cited by
-
Delineation of a thrombin receptor-stimulated vascular smooth muscle cell transition generating cells in the plaque-stabilizing fibrous cap.Cardiovasc Res. 2025 Aug 14;121(9):1359-1372. doi: 10.1093/cvr/cvaf112. Cardiovasc Res. 2025. PMID: 40577585 Free PMC article.
-
Endothelial YAP/TAZ activation promotes atherosclerosis in a mouse model of Hutchinson-Gilford progeria syndrome.J Clin Invest. 2024 Oct 1;134(22):e173448. doi: 10.1172/JCI173448. J Clin Invest. 2024. PMID: 39352768 Free PMC article.
-
Spatial transcriptomic mapping of coronary atherosclerosis in the luminal plaque and beyond.Nat Cardiovasc Res. 2025 Jan;4(1):8-10. doi: 10.1038/s44161-024-00568-z. Nat Cardiovasc Res. 2025. PMID: 39747456 No abstract available.
-
Cellular communication network factor 2 regulates smooth muscle cell transdifferentiation and lipid accumulation in atherosclerosis.Cardiovasc Res. 2024 Dec 31;120(17):2191-2207. doi: 10.1093/cvr/cvae215. Cardiovasc Res. 2024. PMID: 39365752
-
A Concept of "Athero-Oncology": Tumor-Like Smooth Muscle Cells Drive Atherosclerosis.Circulation. 2024 Jun 11;149(24):1899-1902. doi: 10.1161/CIRCULATIONAHA.124.069446. Epub 2024 Jun 10. Circulation. 2024. PMID: 38857330 Free PMC article. No abstract available.
References
-
- Hansson GK. Inflammation, atherosclerosis, and coronary artery disease. N Engl J Med. 2005;352:1685–1695. - PubMed
-
- Turner AW, Hu SS, Mosquera JV, et al. Author Correction: Single-nucleus chromatin accessibility profiling highlights regulatory mechanisms of coronary artery disease risk. Nat Genet. 2022;54:1259–1259. - PubMed
Publication types
MeSH terms
Grants and funding
- R01 HL109512/HL/NHLBI NIH HHS/United States
- R01 HL158525/HL/NHLBI NIH HHS/United States
- R01 HL151535/HL/NHLBI NIH HHS/United States
- T32 HL098049/HL/NHLBI NIH HHS/United States
- R01 HL139478/HL/NHLBI NIH HHS/United States
- R01 HL134817/HL/NHLBI NIH HHS/United States
- R01 HL145708/HL/NHLBI NIH HHS/United States
- R33 HL120757/HL/NHLBI NIH HHS/United States
- UM1 HG011972/HG/NHGRI NIH HHS/United States
- R21 HL120757/HL/NHLBI NIH HHS/United States
- F32 HL143847/HL/NHLBI NIH HHS/United States
- K08 HL152308/HL/NHLBI NIH HHS/United States
- R01 HL156846/HL/NHLBI NIH HHS/United States
- K08 HL153798/HL/NHLBI NIH HHS/United States
LinkOut - more resources
Full Text Sources
Medical
