. 2024 Mar 21;52(5):2609-2624.
doi: 10.1093/nar/gkad1215.

The disordered N-terminal tail of SARS-CoV-2 Nucleocapsid protein forms a dynamic complex with RNA

Affiliations

The disordered N-terminal tail of SARS-CoV-2 Nucleocapsid protein forms a dynamic complex with RNA

Jasmine Cubuk et al. Nucleic Acids Res. .

Abstract

The SARS-CoV-2 Nucleocapsid (N) protein is responsible for condensation of the viral genome. Characterizing the mechanisms controlling nucleic acid binding is a key step in understanding how condensation is realized. Here, we focus on the role of the RNA binding domain (RBD) and its flanking disordered N-terminal domain (NTD) tail, using single-molecule Förster Resonance Energy Transfer and coarse-grained simulations. We quantified contact site size and binding affinity for nucleic acids and concomitant conformational changes occurring in the disordered region. We found that the disordered NTD increases the affinity of the RBD for RNA by about 50-fold. Binding of both nonspecific and specific RNA results in a modulation of the tail configurations, which respond in an RNA length-dependent manner. Not only does the disordered NTD increase affinity for RNA, but mutations that occur in the Omicron variant modulate the interactions, indicating a functional role of the disordered tail. Finally, we found that the NTD-RBD preferentially interacts with single-stranded RNA and that the resulting protein:RNA complexes are flexible and dynamic. We speculate that this mechanism of interaction enables the Nucleocapsid protein to search the viral genome for and bind to high-affinity motifs.


Figures

Graphical Abstract
Graphical Abstract
Figure 1.
Figure 1.
Nucleocapsid protein constructs in this study. (left) RNA binding domain (RBD) with dyes in position 68 and 172. (center) NTD-RBD construct with dyes in position 1 and 68, sampling the disordered region. (right) NTD-RBD construct with dyes in position 68 and 172 to sample conformational changes and interactions in the RBD domain.
Figure 2.
Figure 2.
poly(rU) binding to RBD and NTD-RBD. (A) Representative distributions of transfer efficiencies at different concentrations of poly(rU) for RBDL. Distributions are fitted to a single Gaussian distribution. (B) Representative distributions of transfer efficiencies at different concentrations of poly(rU) for NTD-RBDL. Distributions are fitted to a single Gaussian distribution. (C) Representative distributions of transfer efficiencies at different concentrations of poly(rU) for NTDL-RBD. Distributions are fitted to two Gaussian distributions. (D) Variations in the mean transfer efficiency of RBDL upon binding poly(rU). (E) Variations in the mean transfer efficiency of NTD-RBDL upon binding poly(rU). (F) Fraction bound of NTDL -RBD as a function of poly(rU) concentration. Solid lines represent the fit to the binding Equation (5). Best fit values of Kint are shown in Supplementary Table S6.
Figure 3.
Figure 3.
Length dependence of poly(rU) binding to NTD-RBD and RBD. (A, B) Representative histograms of NTDL-RBD (A) and RBDL (B) for rUn with nucleotide length n equal to 10, 15, 20, 25, 30, 40. The line of the transfer efficiency distribution varies from black (no RNA, starting condition) to the representative color of the specific length with increasing concentration of RNA. Black solid vertical line identifies the mean transfer efficiency at the starting condition (E0), red vertical dashed line identifies the mean transfer efficiency at ‘saturation’. (C, D) Transfer efficiency changes upon (rU)n binding, EE0, for RBDL (C) and NTDL-RBD (D) for all nucleotide lengths. Compare with single titrations in Supplementary Figure S2 for replicates and errors associated with each point. Solid lines are fit to Equation (1). (E) Variation range of transfer efficiency E with respect to the transfer efficiency E0 measured in absence of ligands for both NTDL-RBD and RBDL constructs. (F) Root-mean-square (rms) interdye distance of the disordered tail as measured by the labeling positions in NTDL-RBD and as a function of nucleic acid length. (G, H) Association constants as a function of the number of nucleotide bases in (rU)n.
Figure 4.
Figure 4.
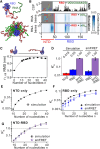
Coarse-grained simulations of the Nucleocapsid protein with ssRNA. (A) The Mpipi forcefield is used to model SARS-CoV-2 N-protein interactions with ssRNA (rU)n(28). Each amino acid and nucleotide is represented as a single bead (see Materials and methods). The Nucleocapsid-RNA bound state is highly dynamic (bottom). (B) Simulations of RBD + (rU)10 (middle) or NTD-RBD + (rU)10 (bottom) enable the assessment of which residues engage in direct RNA interactions. Protein:RNA contacts are quantified by calculating the contact fraction, defined as the fraction of the simulation in which each amino acid-nucleotide pair is under a threshold distance of 14 Å. The specific threshold chosen does not alter which residues are identified as RNA-interacting (Supplementary Figure S3). The pattern of residues identified from simulations shows qualitative agreement with chemical shift perturbation data of the RBD (amino acids 44–173) observed upon binding to a 10-mer ssRNA (5′- UCUCUAAACG-3′)(31). (C) Root-mean-square distance (RMSD) between residues 1 and 68 increases upon ssRNA binding, with a modest increase observed in the RNA-bound state as a function of RNA length up to (rU)20. (D) The normalized binding affinity (KA*) of the NTD, RBD or NTD-RBD binding to (rU)n is calculated as the apparent binding affinity divided by the apparent binding affinity for NTD-RBD binding (rU)25. KA* can be calculated in a self-consistent manner for simulations (left) and experiment (right). (E) Length dependent KA* of the NTD + (rU)n. (F) Length dependent KA* of the RBD + (rU)n. (G) Length-dependent KA* of the NTD-RBD + (rU)n. For (E–G) KA* is calculated by dividing the apparent KA from the specific (rU)n length by the apparent KA from the NTD-RBD + (rU)25 simulation.
Figure 5.
Figure 5.
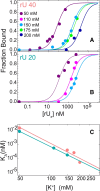
Salt dependence of binding association constant. Fraction bound is determined from single-molecule FRET experiments of the NTDL-RBD as a function of (rU)40 (A) and (rU)20 (B) concentration. Each curve is measured in 50 mM Tris buffer and increasing KCl concentration: 50 mM (purple), 110 mM (magenta), 150 mM (cyan), 175 mM (green), 200 mM (blue) KCl. See corresponding histograms in Supplementary Figures S7–S8. Solid lines are fit to Equation (2). C. Association constants determined from the measurements in panel A ((rU)40, pink) and panel B ((rU)20, cyan) are plotted against the concentration of K+ ions on a log-log plot. Solid lines represent the linear fit of Log(KA) as a function of Log([K+]). Results for total ion concentration are reported in Supplementary Figure S9. The similar slope of (rU)40 and (rU)20 data suggests that the same net ion release occurs upon binding of the two different lengths of nucleic acids (see Supplementary Table S11).
Figure 6.
Figure 6.
Specific ssRNA binding to NTDL-RBD. (A) Representative distributions of transfer efficiencies upon binding of V21. Increasing concentration of RNA leads to a first conformational change of the tail that appears to be largely completed at ∼3 μM. Further increasing the concentration of V21 leads to a second conformational change of the disordered region, indicating that the protein is binding two copies of the nucleic acids. Areas are fitted according to Equations (3) and (4). (B) Graphical representation of the SARS-CoV-2 5′ UTR based on Iserman et al. (10), highlighting the region corresponding to V21. (C) Fraction of each state: unbound (fu), bound to one V21 molecule (fb1) and bound to two V21 molecules (fb2). Corresponding values of the fit are reported in Supplementary Table S13.
Figure 7.
Figure 7.
Specific hairpin RNA (hpRNA) binding to NTD-RBD. (A) Position of studied hpRNA sequences in the viral genome. (B) Hairpin structures and sequences based off of the SARS-CoV-2 NSP15 hpRNA. (C) Hairpin structures and sequences based off of the SARS-CoVS-2 SL5B and SARS-CoV-1 SL5B hpRNA. (DE) Variation in the mean transfer efficiency of the NTDL-RBD as a function of hpRNA concentration from (B) and (C). When no hpRNA is present, transfer efficiency is ∼0.68 (compare with Supplementary Figure S10). Solid lines are fit to Equation (1).
Figure 8.
Figure 8.
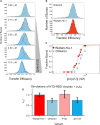
Omicron variant. (A) Transfer efficiency distributions for the Omicron variant as function of poly(rU) concentration. Distributions are fitted with up to two Gaussian distributions to quantify the mean transfer efficiency and relative fraction of bound and unbound fractions. (B) Comparison of unbound configuration of disordered tail for Wuhan-Hu-1 (red) and Omicron variant (cyan) reveals no significant variations in overall conformations. (C) Comparison of binding affinity for Wuhan-Hu-1 (red) and Omicron variant (cyan) reveals different affinities for poly(rU). Solid lines are fit to Equation (2). (D) Trend of the normalized binding affinity (KA*) predicted by simulations with Mpipi model for the Omicron mutant and additional variants.

References

    1. Lu R., Zhao X., Li J., Niu P., Yang B., Wu H., Wang W., Song H., Huang B., Zhu N. et al. . Genomic characterisation and epidemiology of 2019 novel coronavirus: implications for virus origins and receptor binding. Lancet. 2020; 395:565–574. - PMC - PubMed
    1. Laue M., Kauter A., Hoffmann T., Möller L., Michel J., Nitsche A. Morphometry of SARS-CoV and SARS-CoV-2 particles in ultrathin plastic sections of infected Vero cell cultures. Sci. Rep. 2021; 11:3515. - PMC - PubMed
    1. Klein S., Cortese M., Winter S.L., Wachsmuth-Melm M., Neufeldt C.J., Cerikan B., Stanifer M.L., Boulant S., Bartenschlager R., Chlanda P. SARS-CoV-2 structure and replication characterized by in situ cryo-electron tomography. Nat Commun. 2020; 11:5885. - PMC - PubMed
    1. Yao H., Song Y., Chen Y., Wu N., Xu J., Sun C., Zhang J., Weng T., Zhang Z., Wu Z. et al. . Molecular architecture of the SARS-CoV-2 virus. Cell. 2020; 183:730–738. - PMC - PubMed
    1. Bárcena M., Oostergetel G.T., Bartelink W., Faas F.G.A., Verkleij A., Rottier P.J.M., Koster A.J., Bosch B.J. Cryo-electron tomography of mouse hepatitis virus: insights into the structure of the coronavirion. Proc. Natl. Acad. Sci. U.S.A. 2009; 106:582–587. - PMC - PubMed

MeSH terms

Substances

Supplementary concepts