Review
. 2024 Jul 1;104(3):1265-1333.
doi: 10.1152/physrev.00017.2023. Epub 2023 Dec 28.

Computational modeling of cardiac electrophysiology and arrhythmogenesis: toward clinical translation

Affiliations
Review

Computational modeling of cardiac electrophysiology and arrhythmogenesis: toward clinical translation

Natalia A Trayanova et al. Physiol Rev. .

Abstract

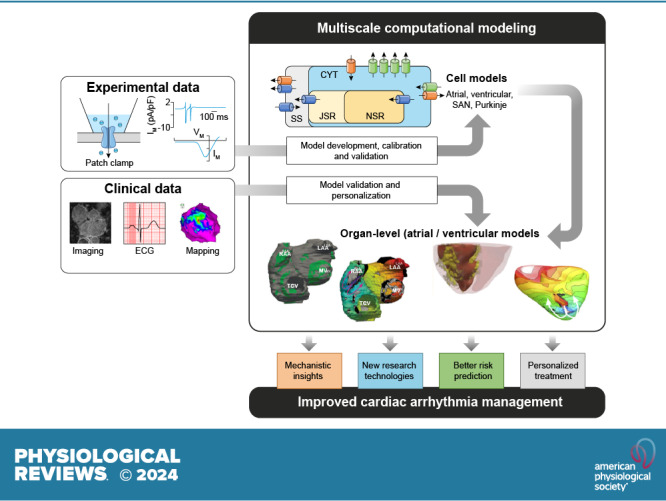
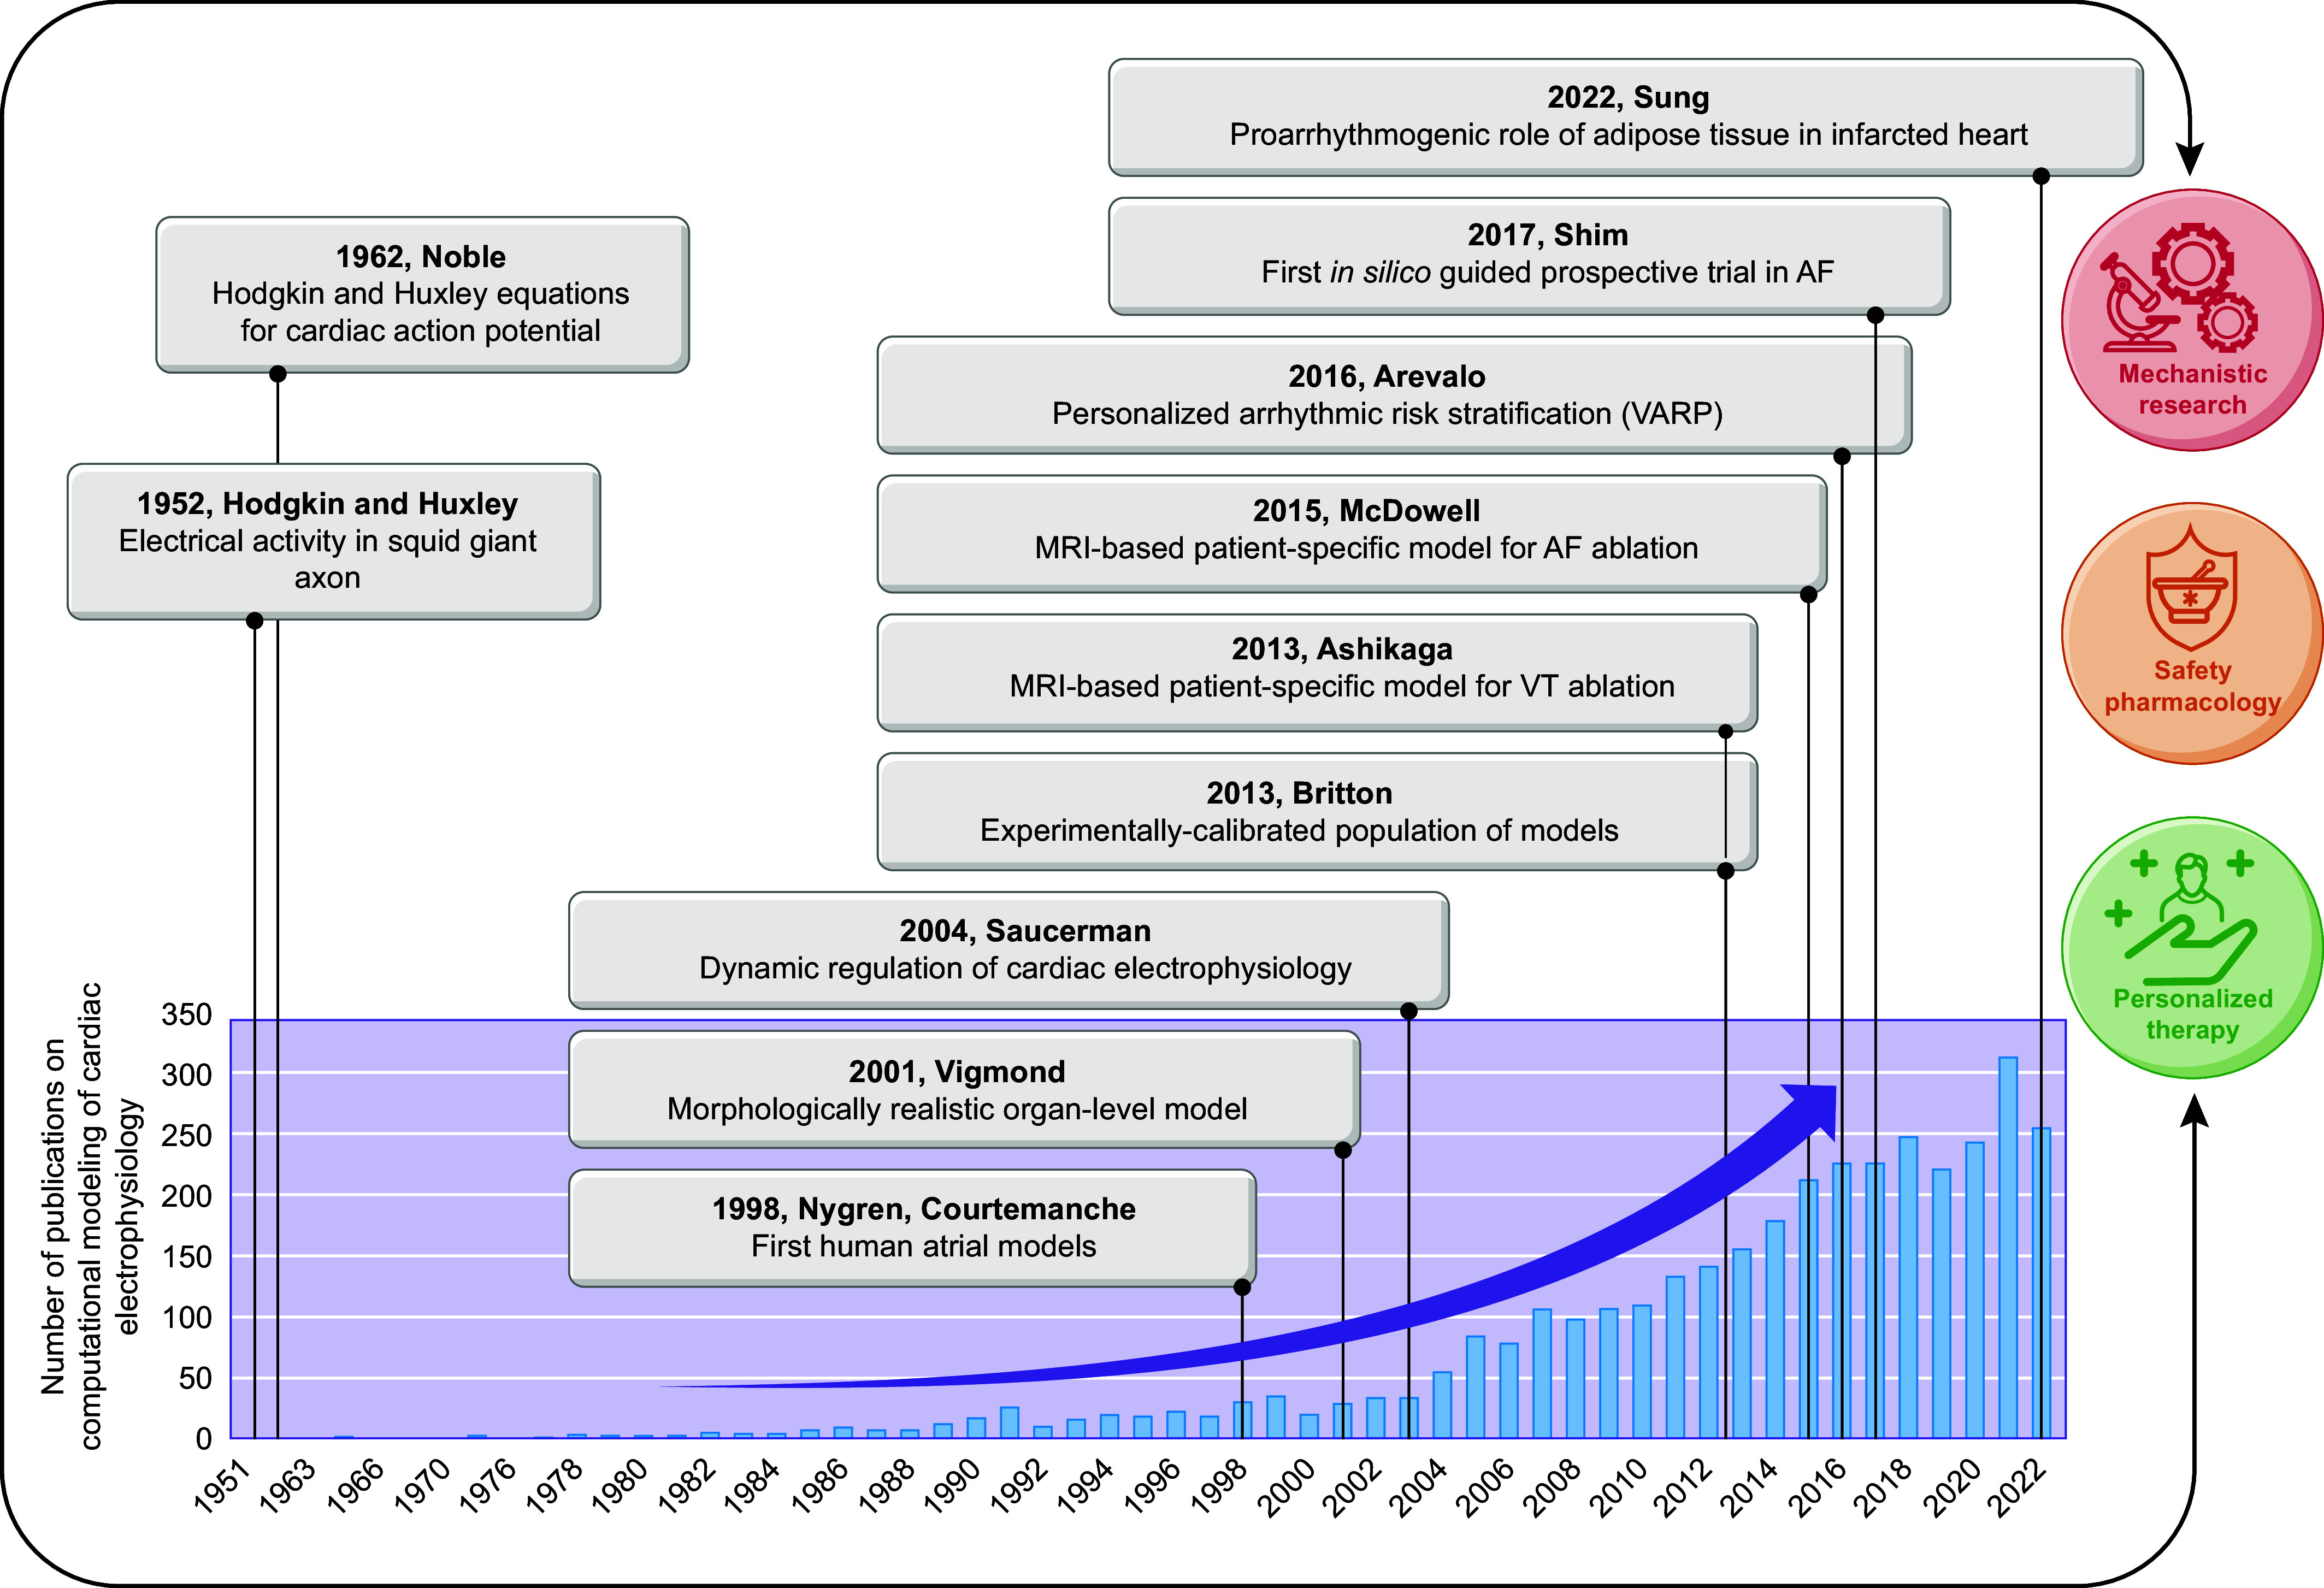
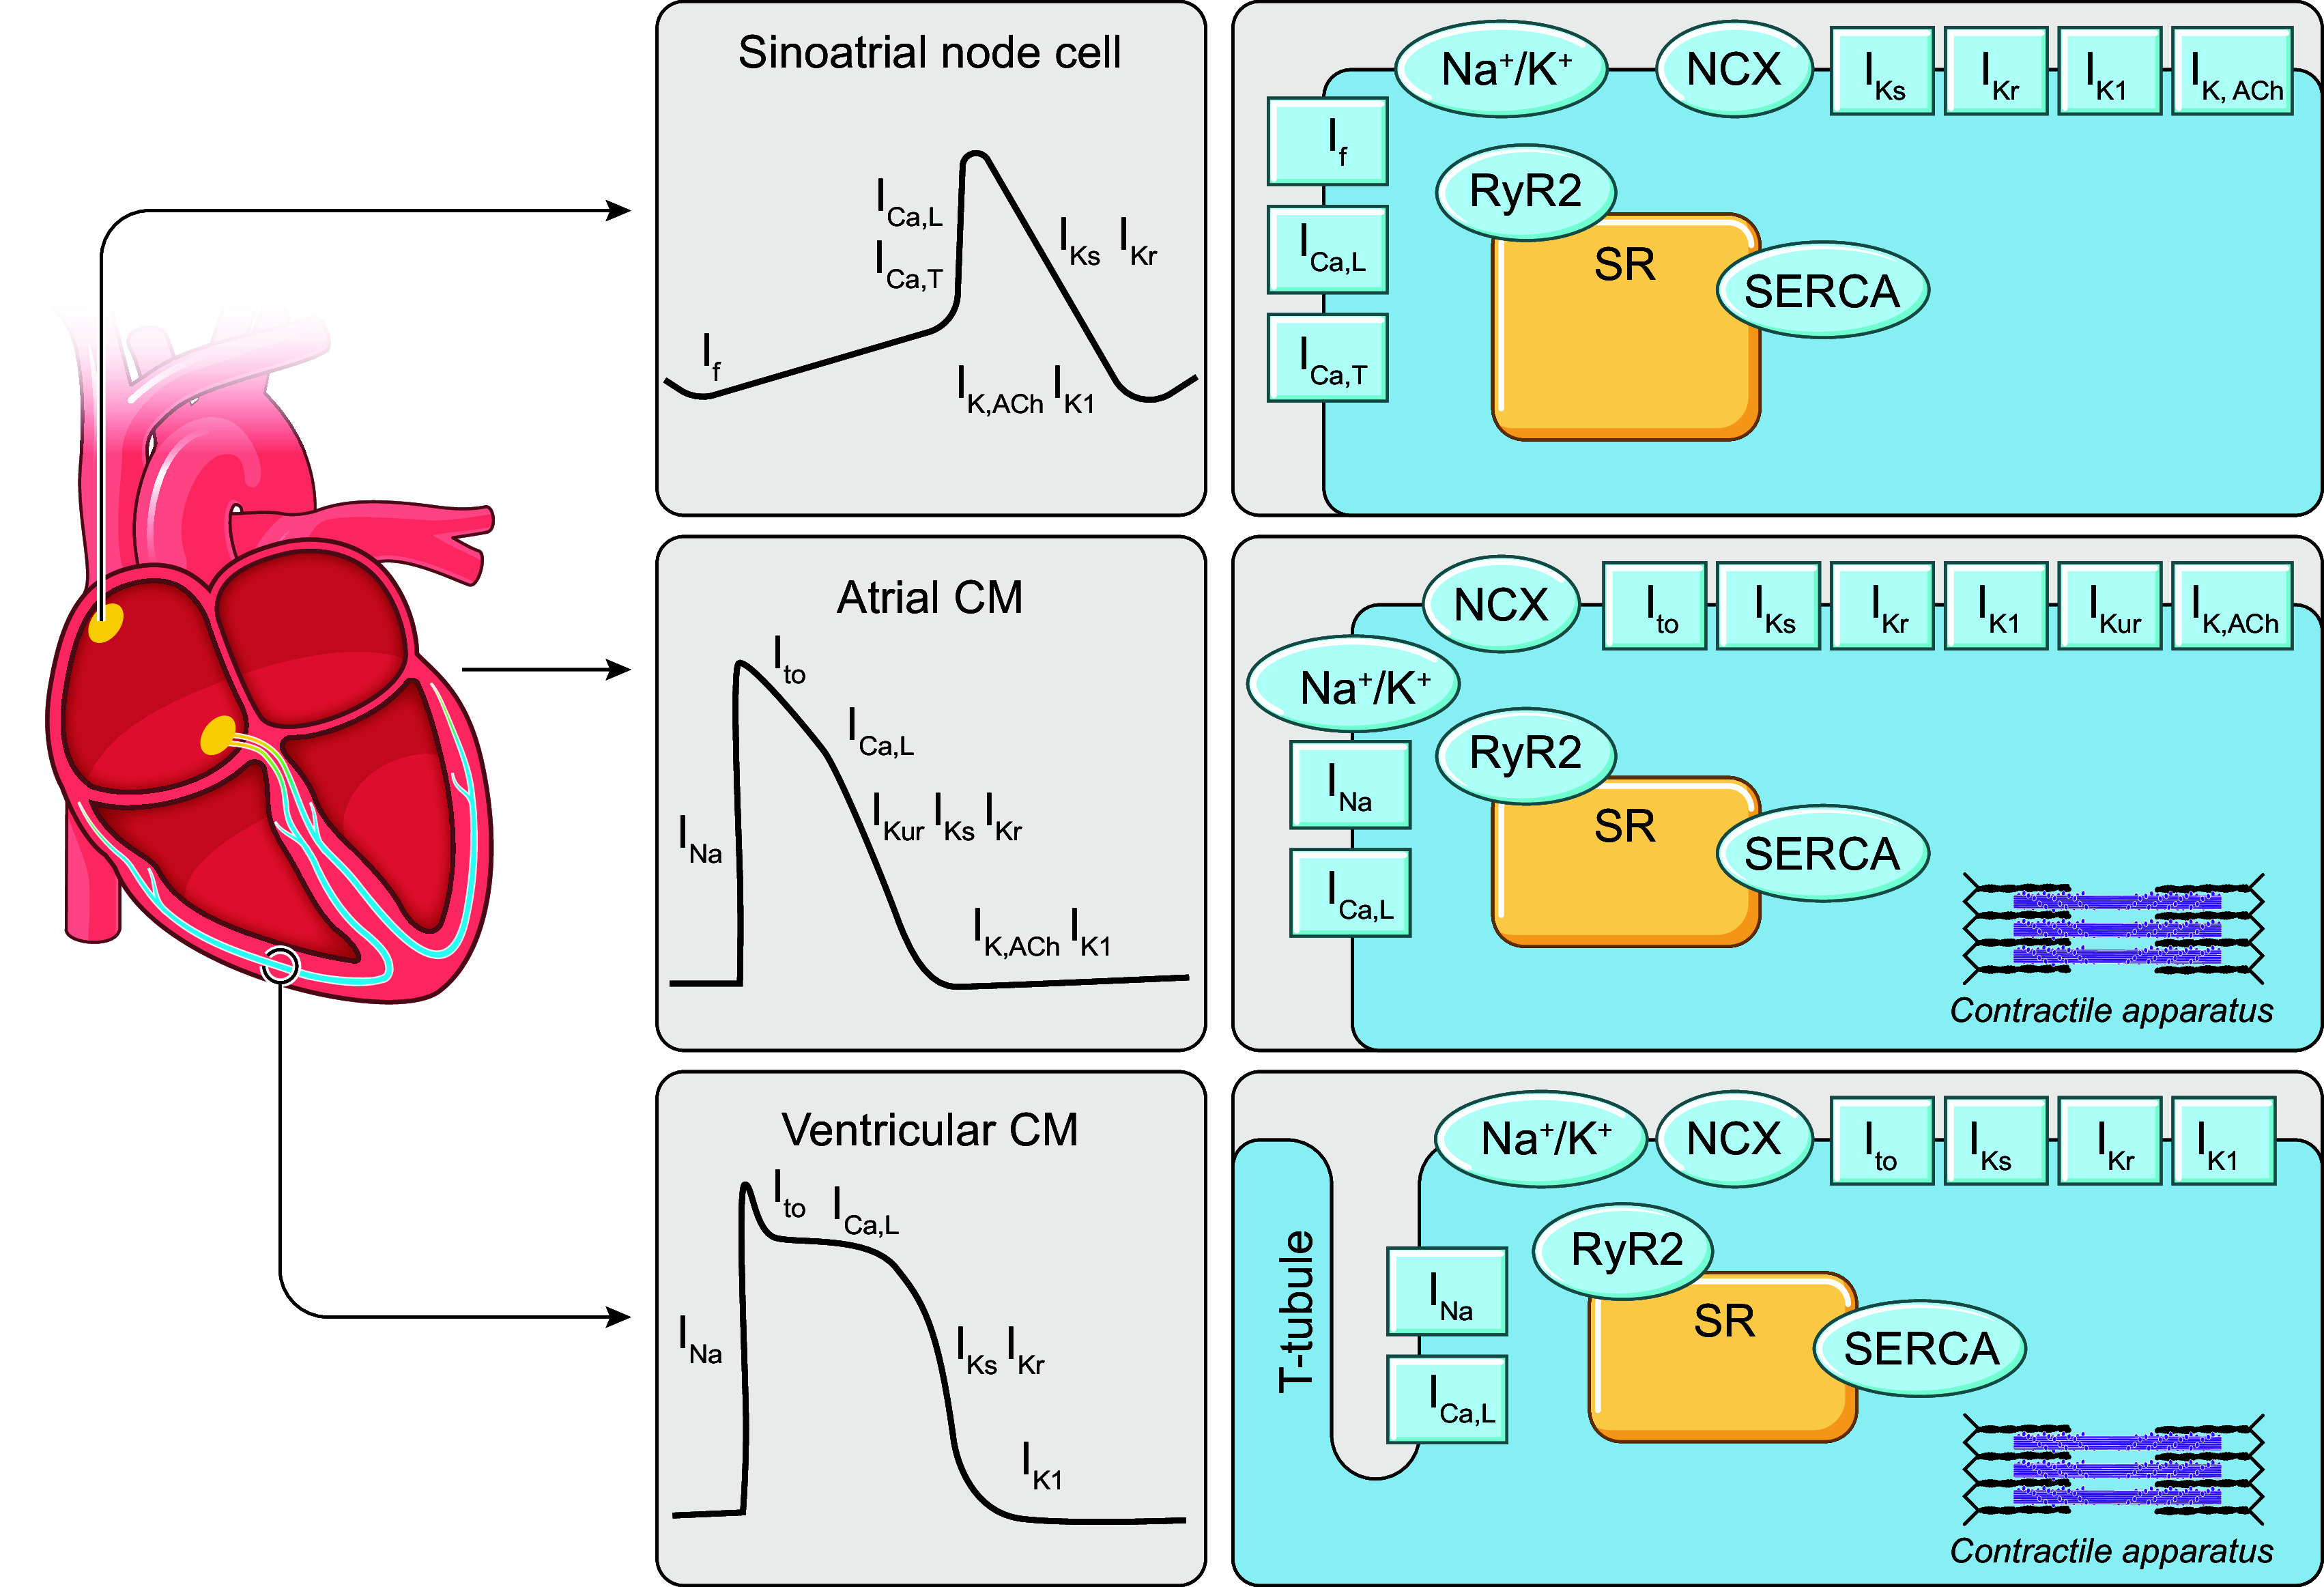
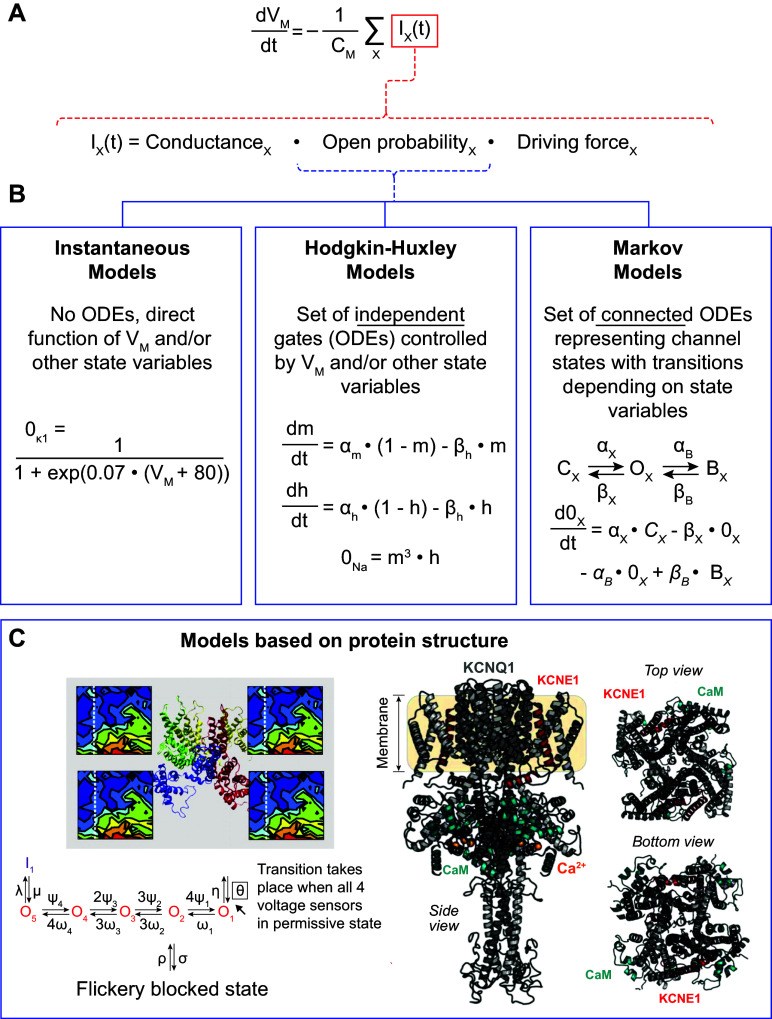
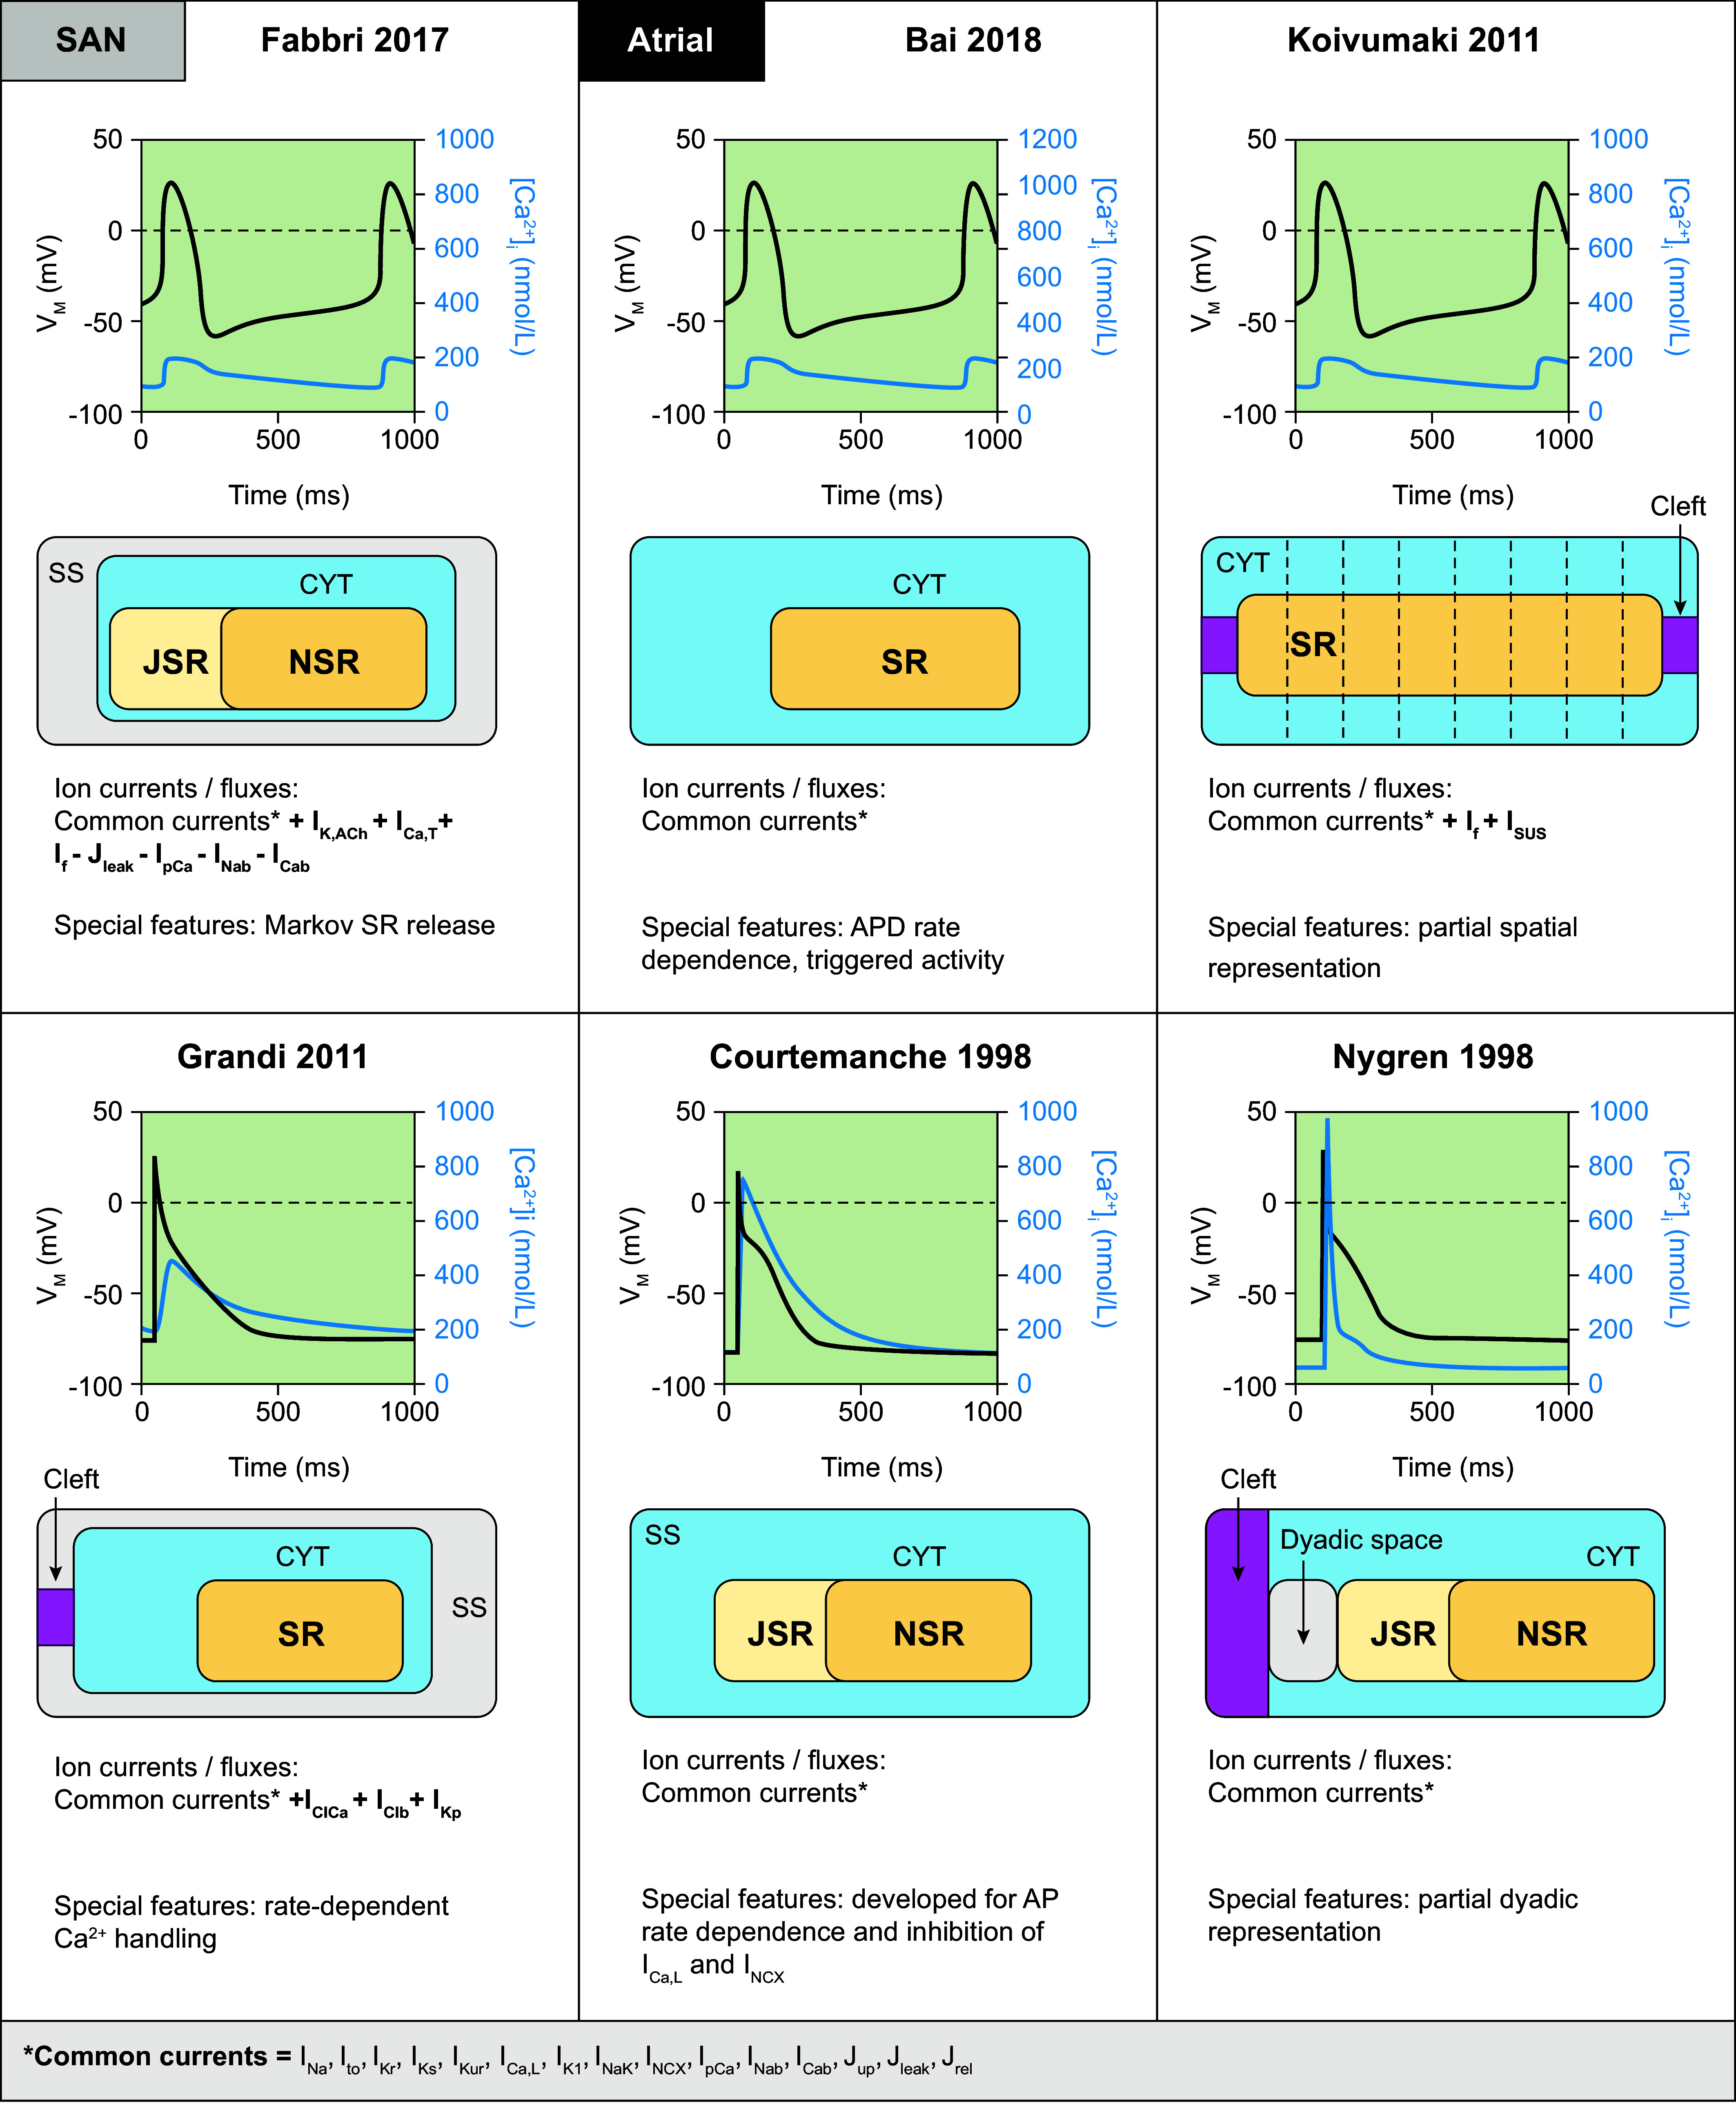
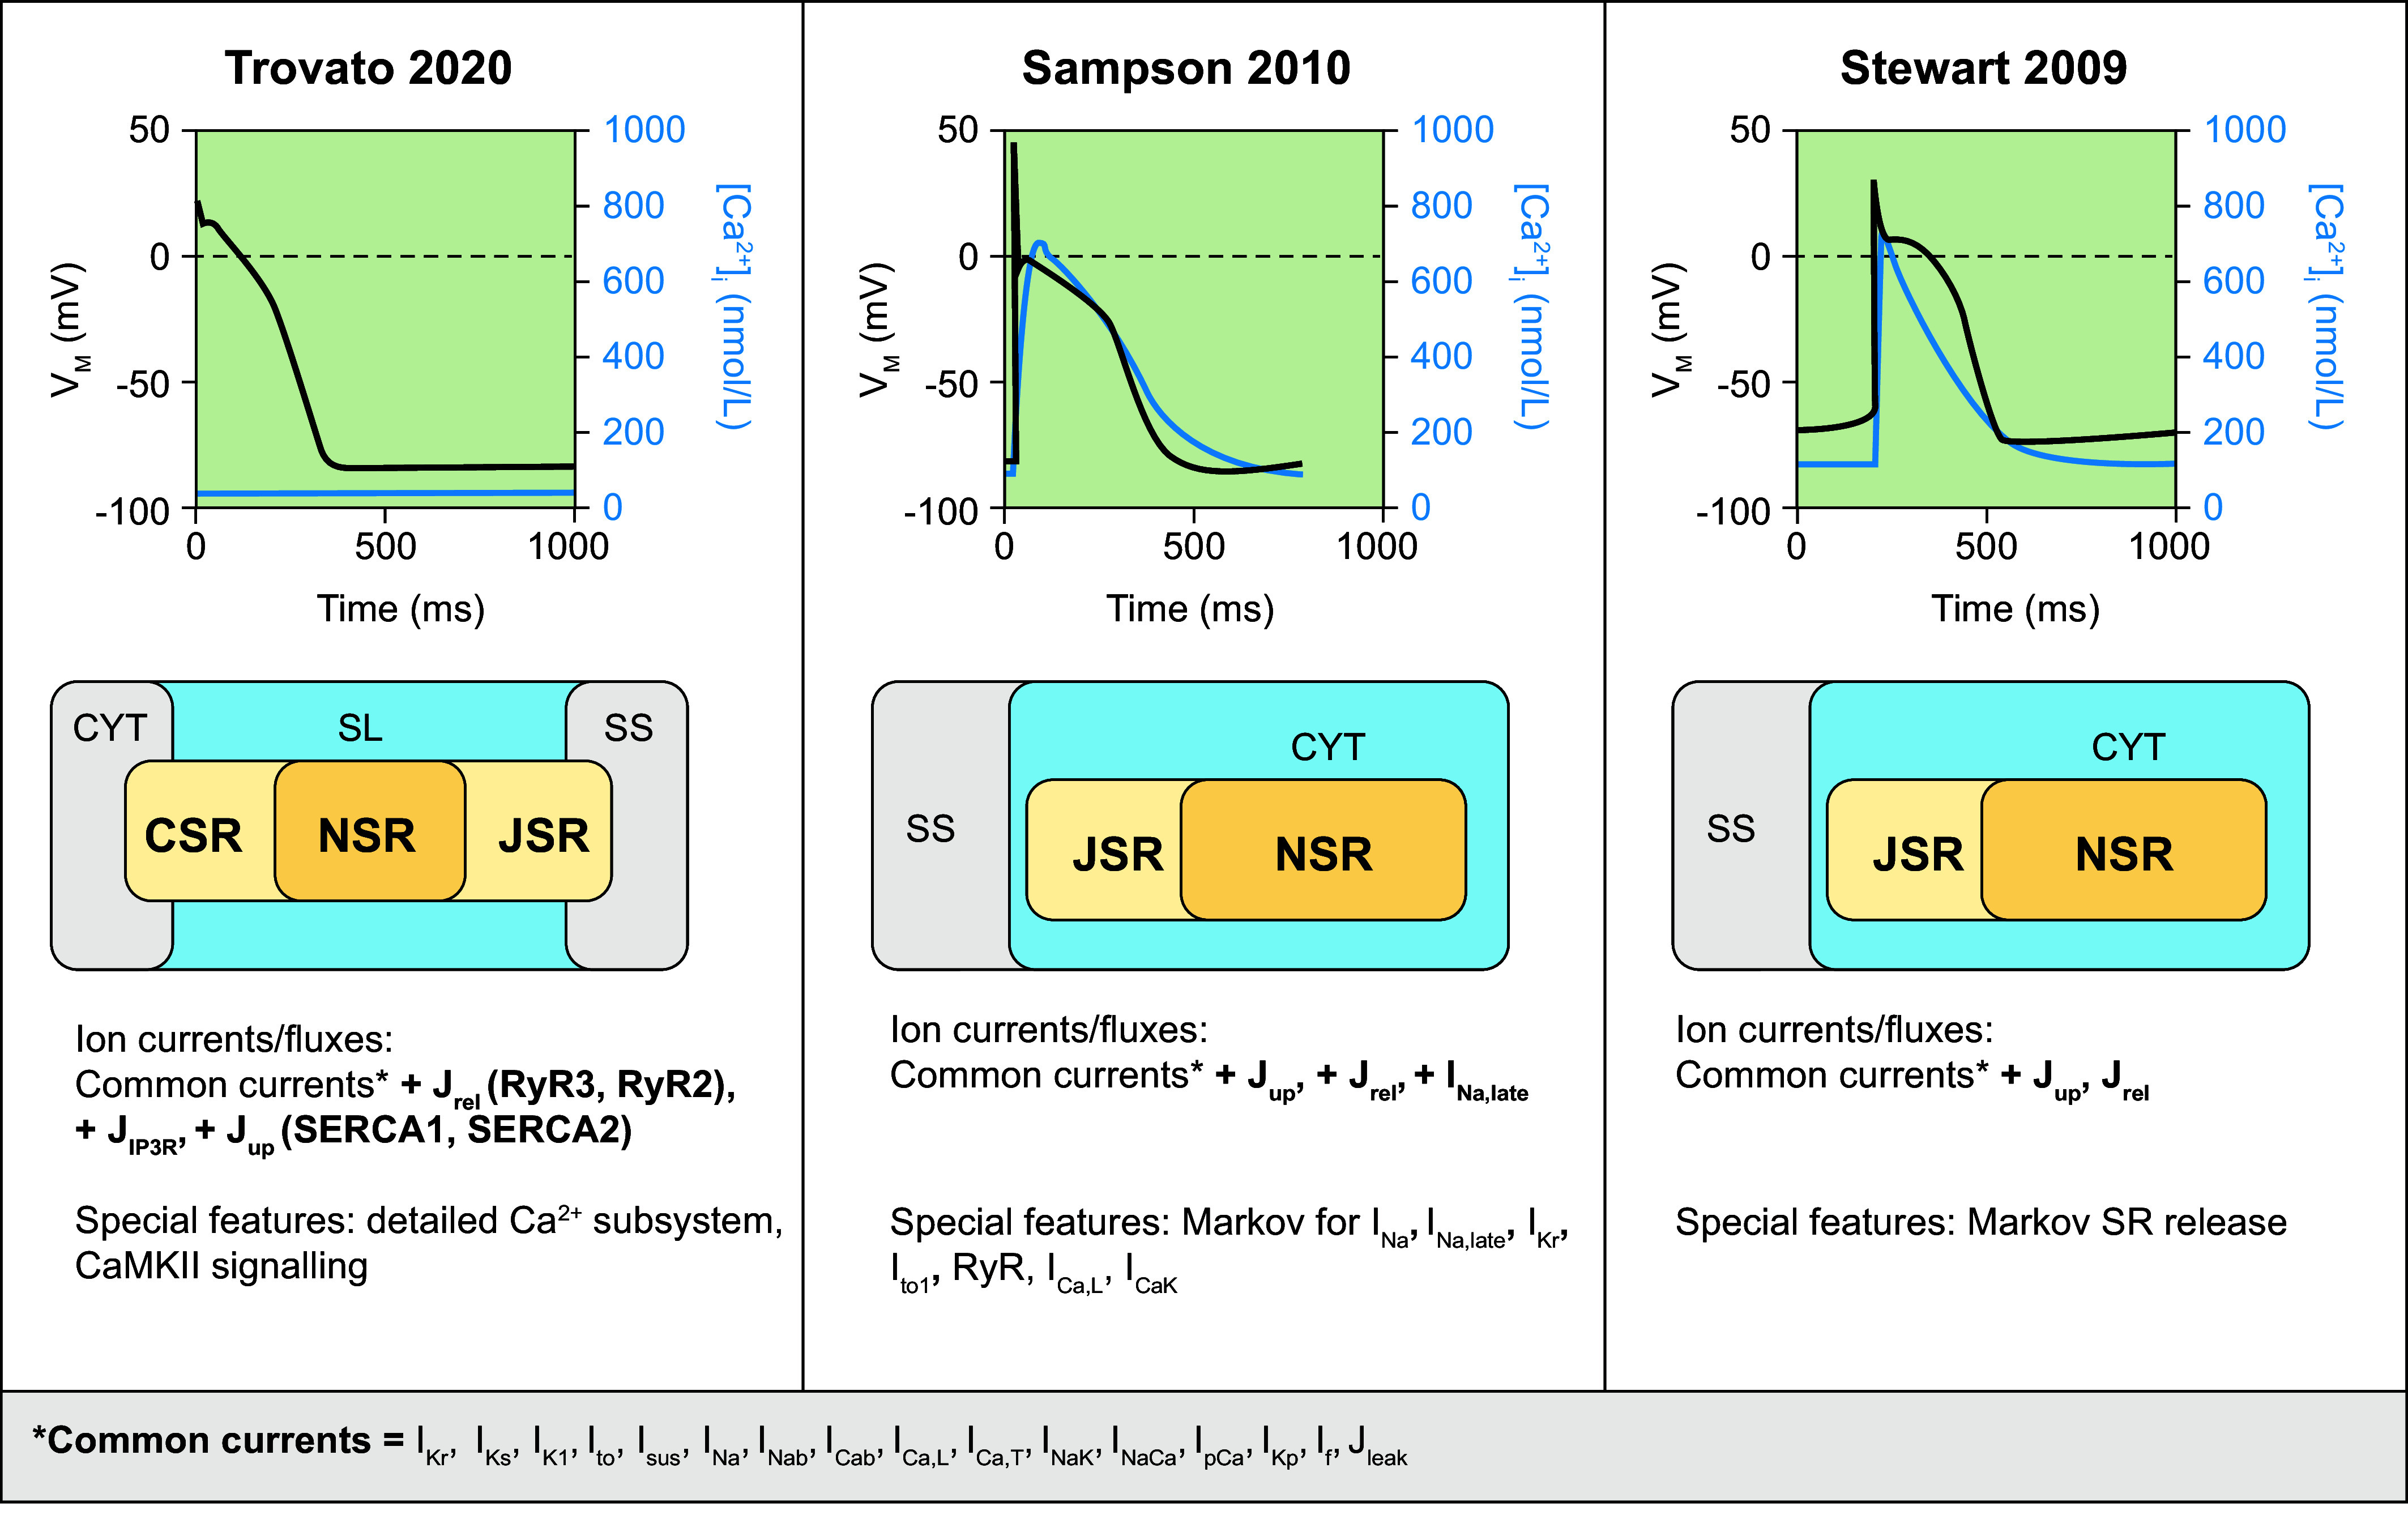
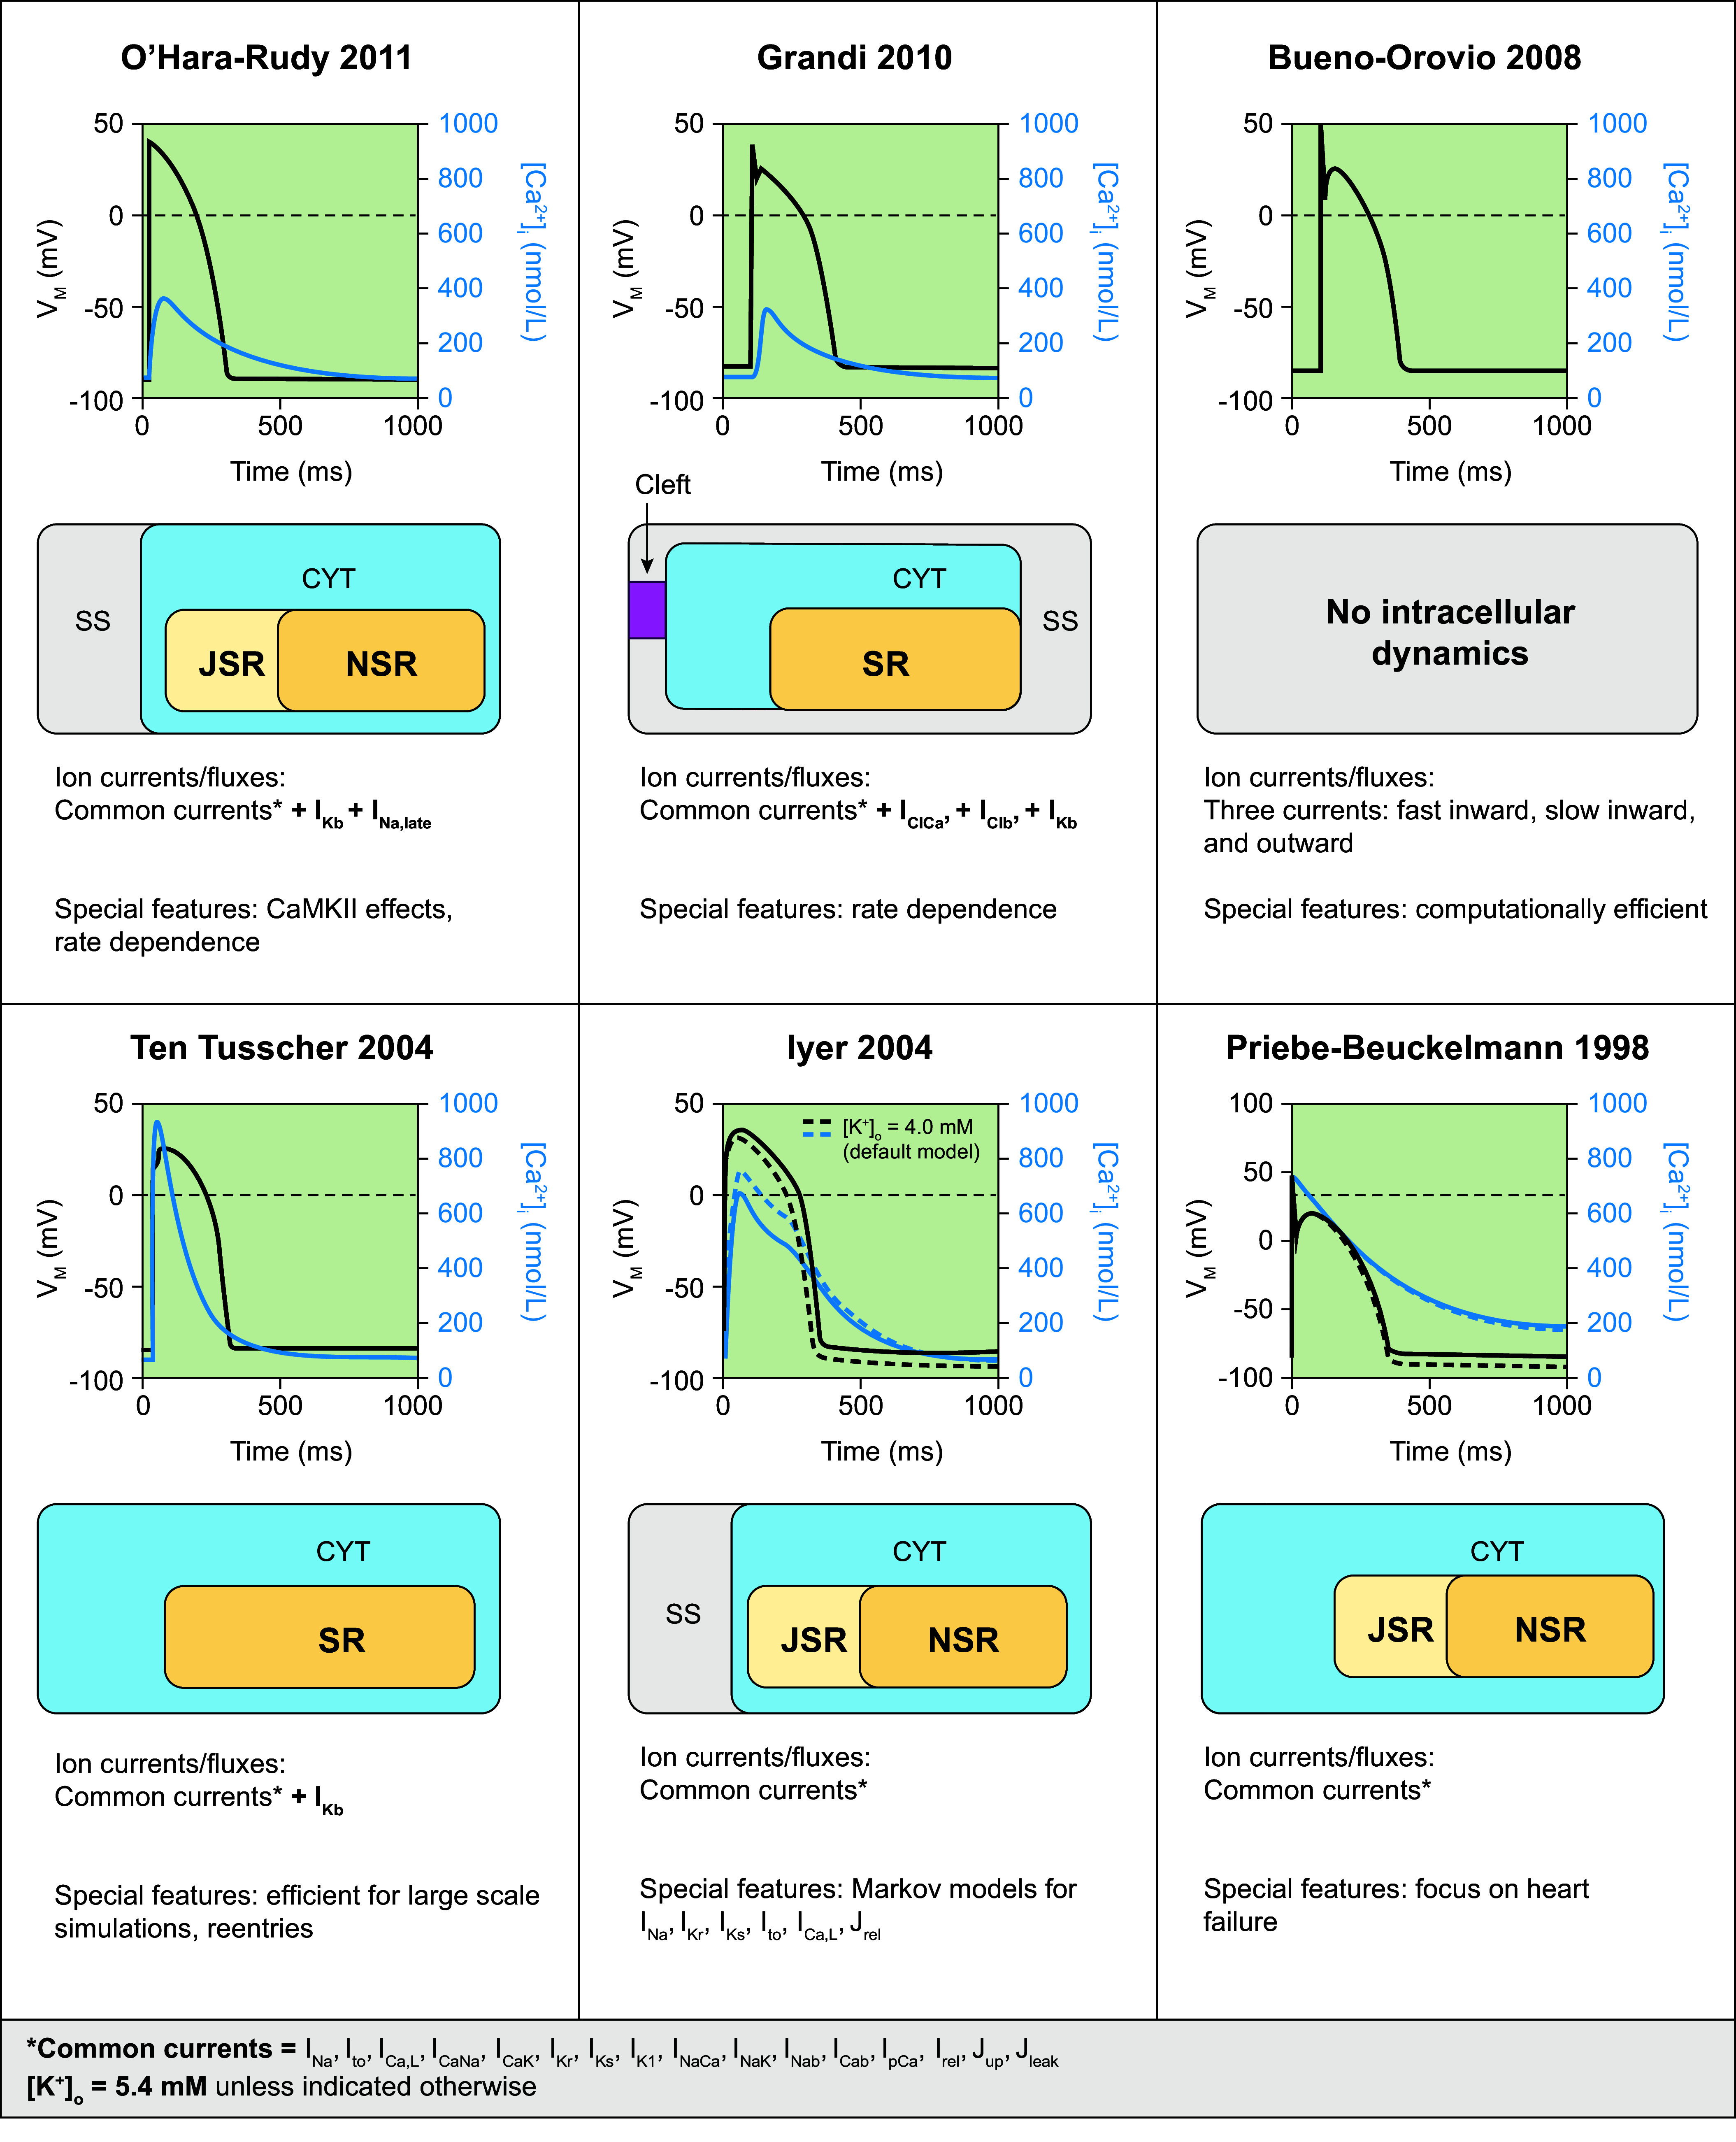
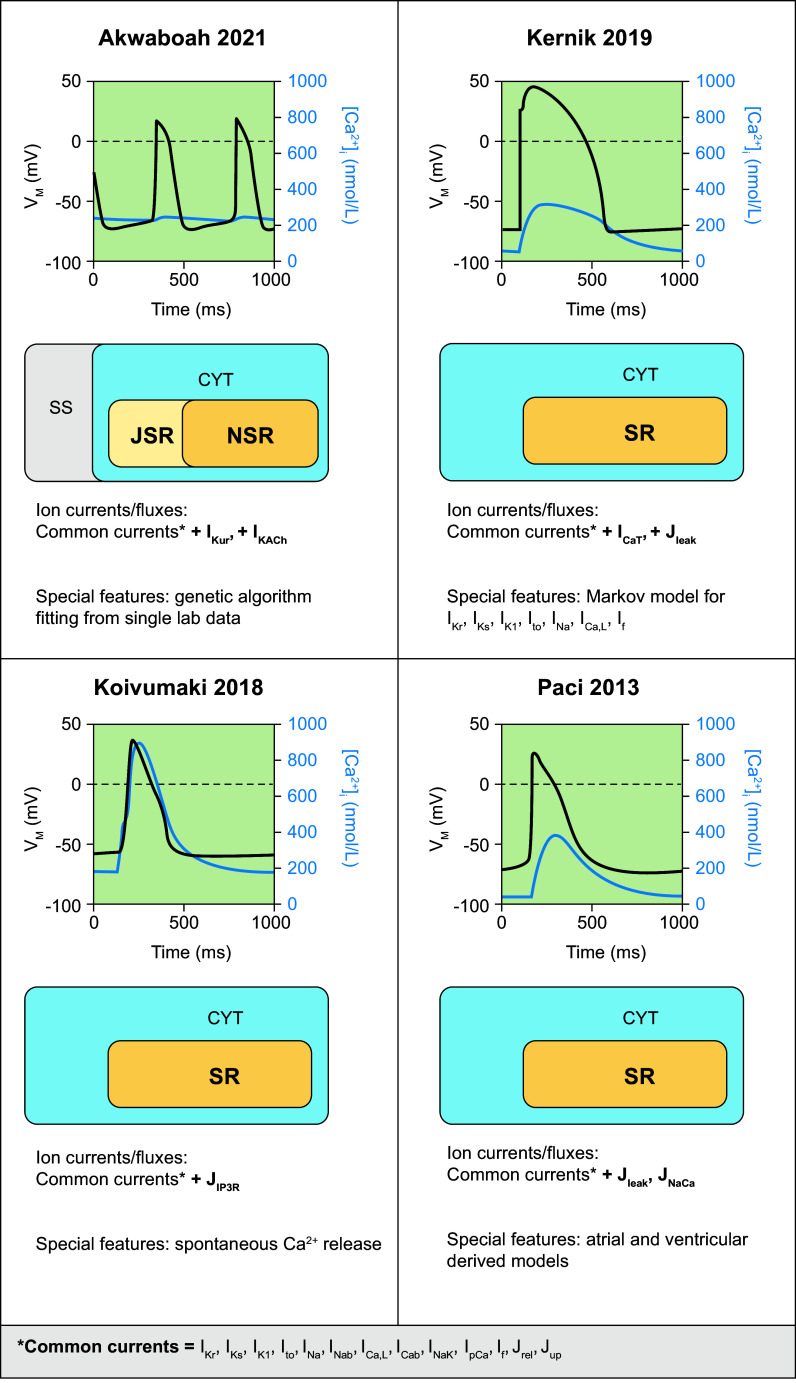
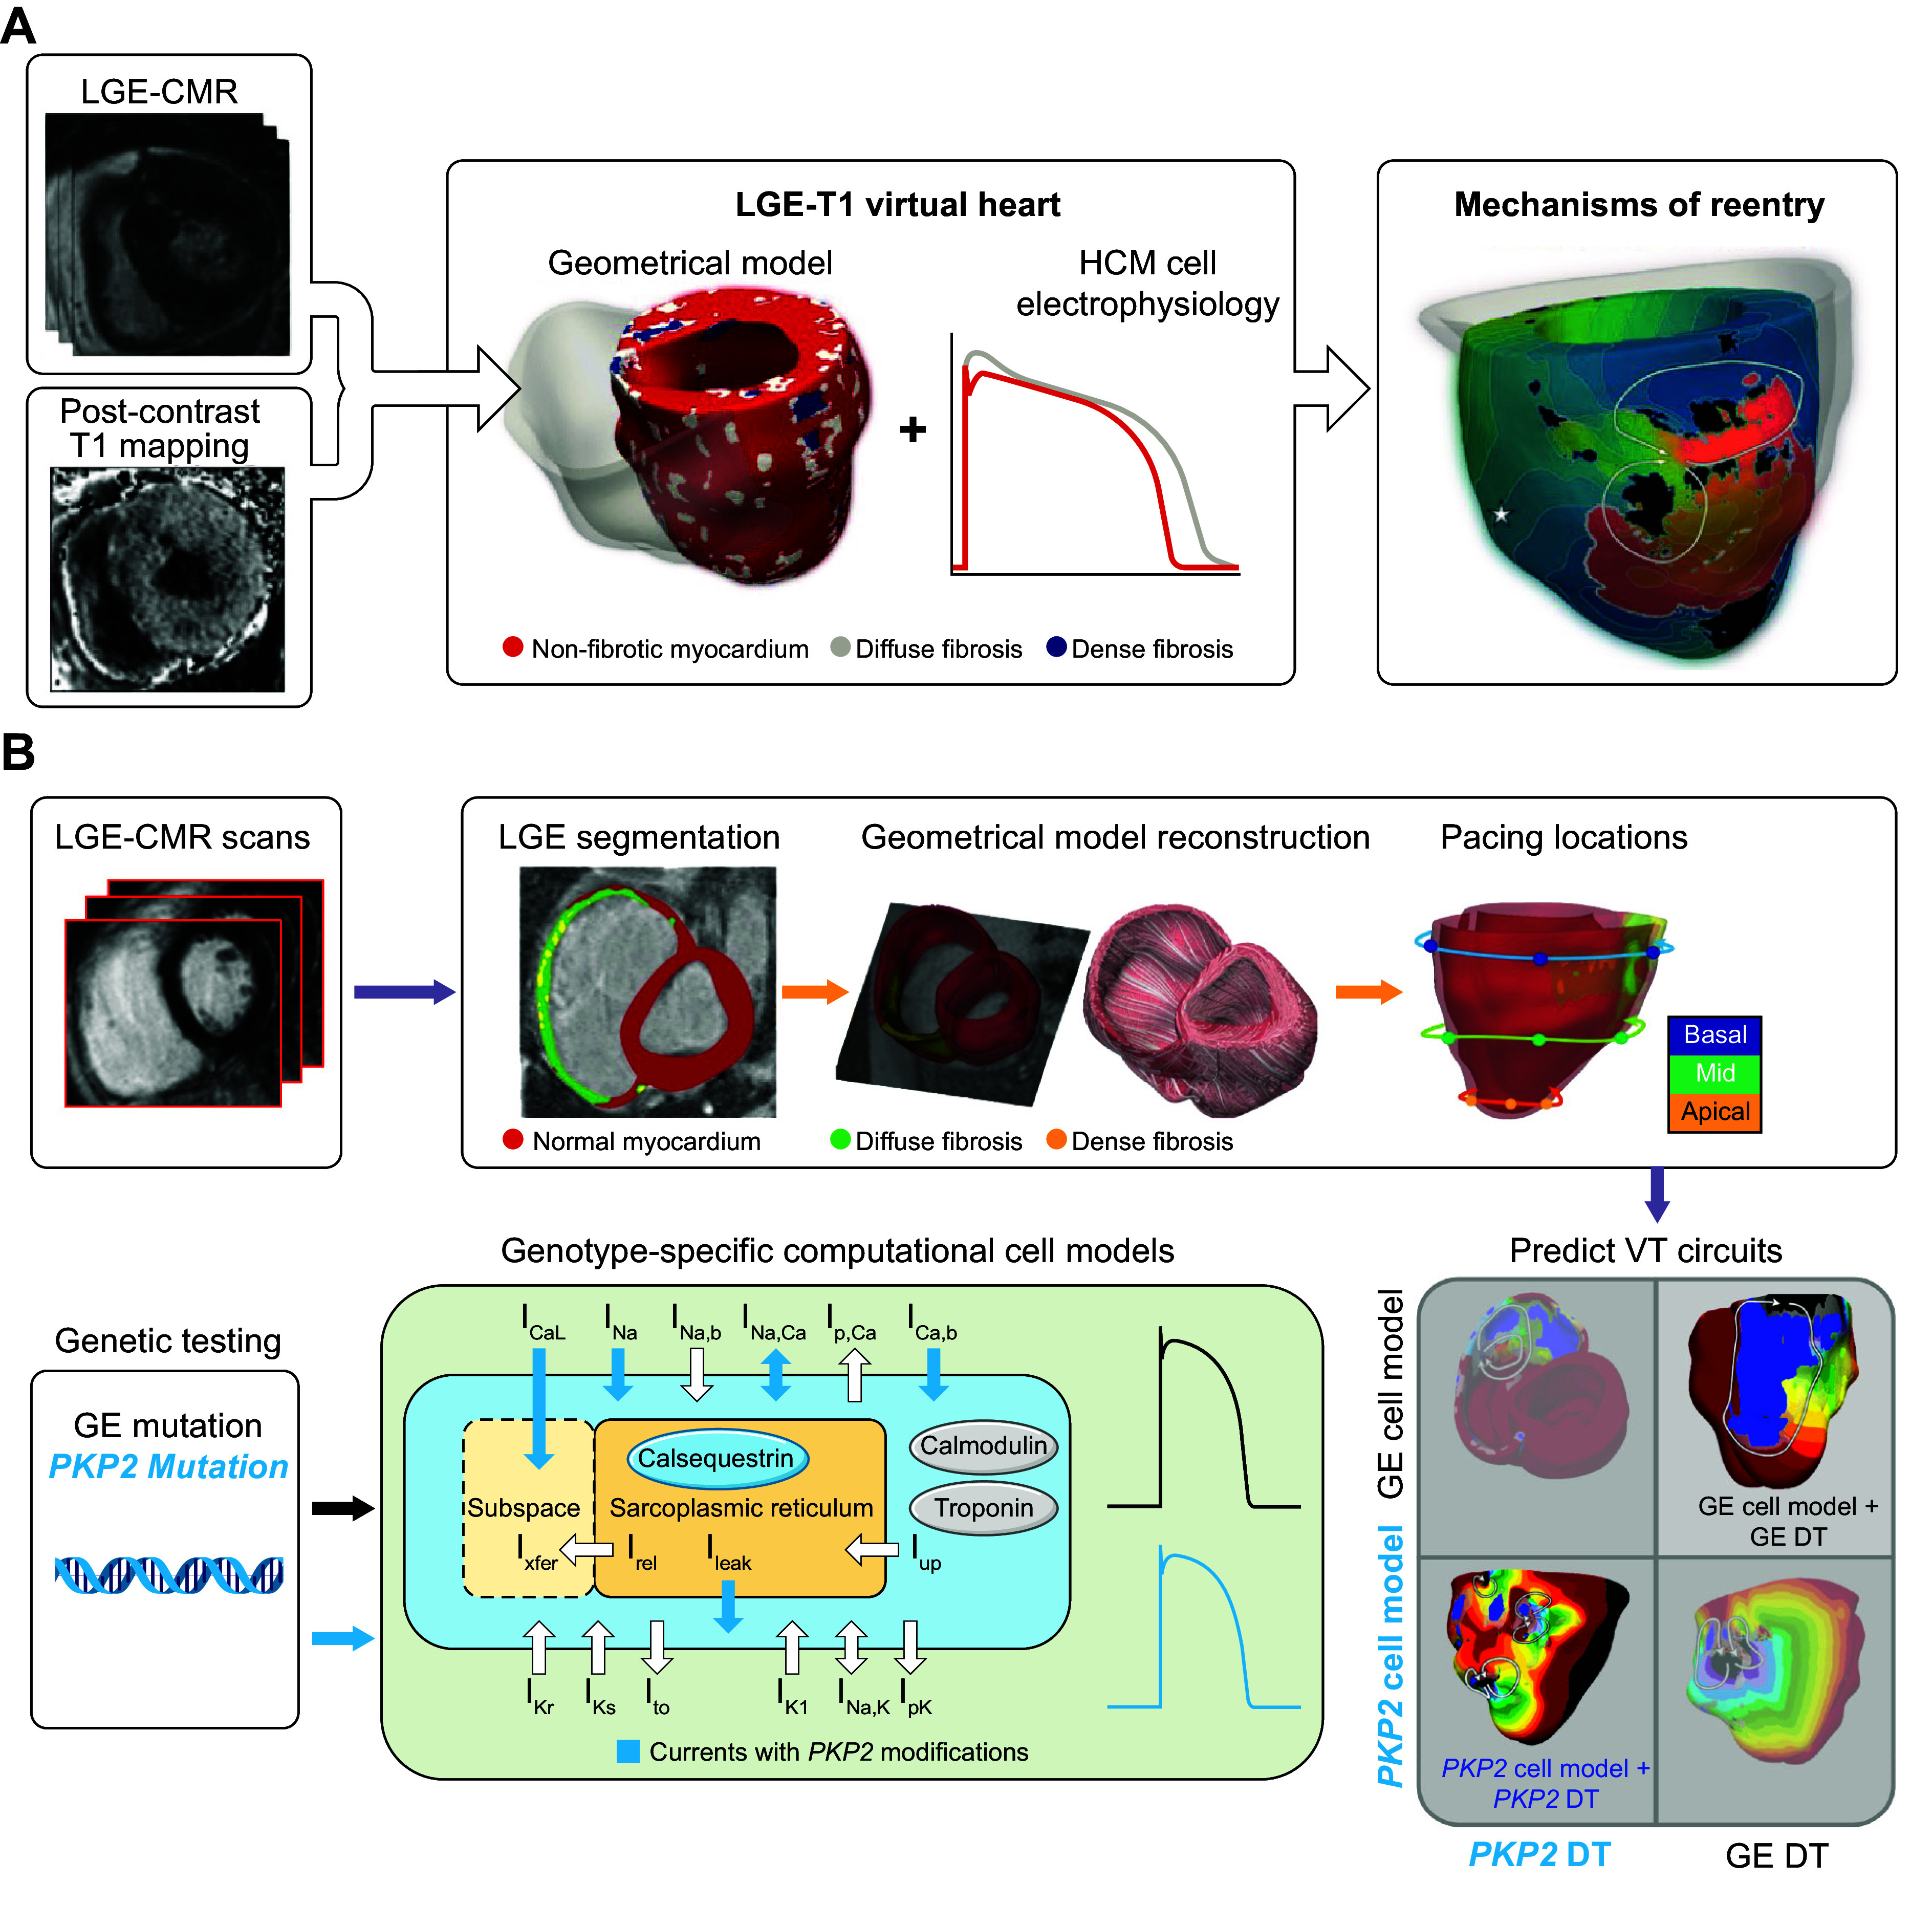
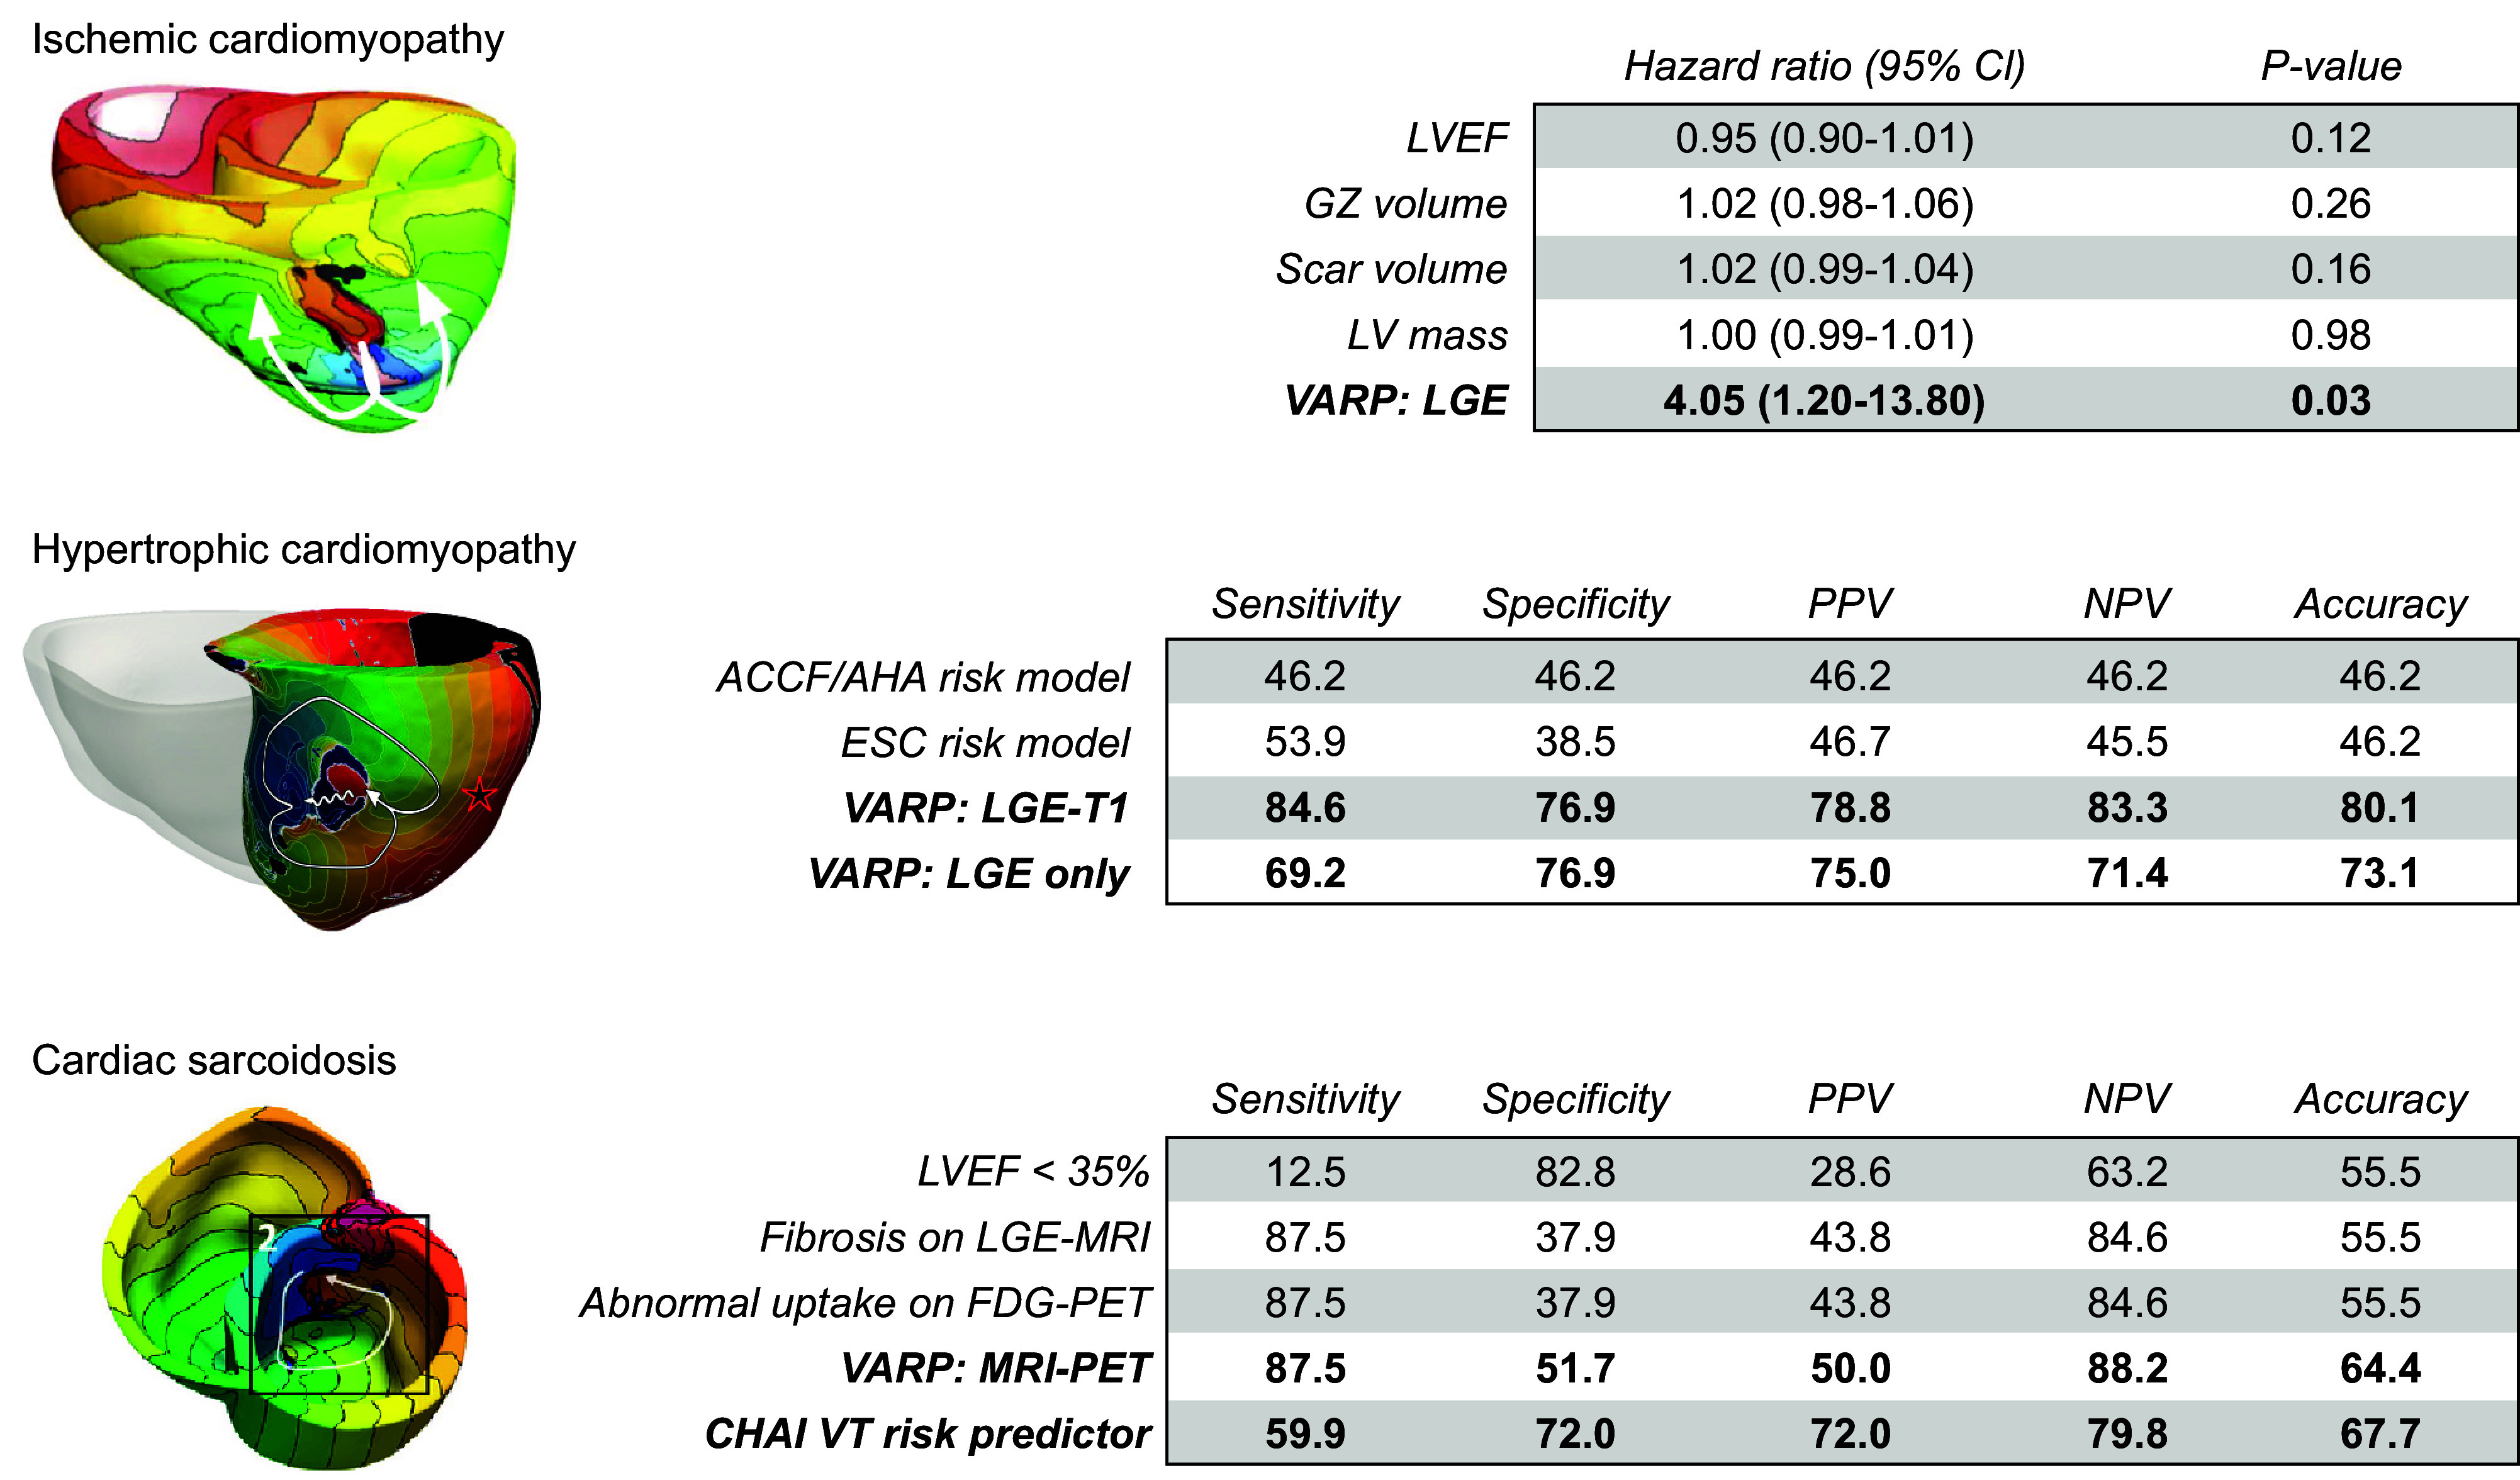
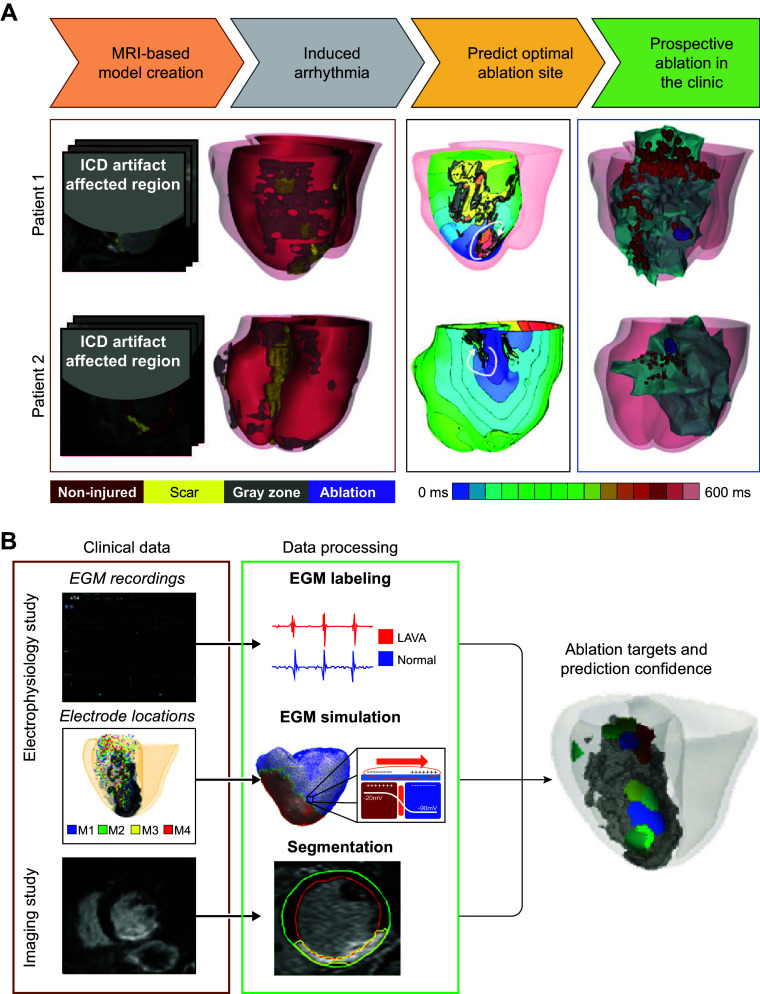
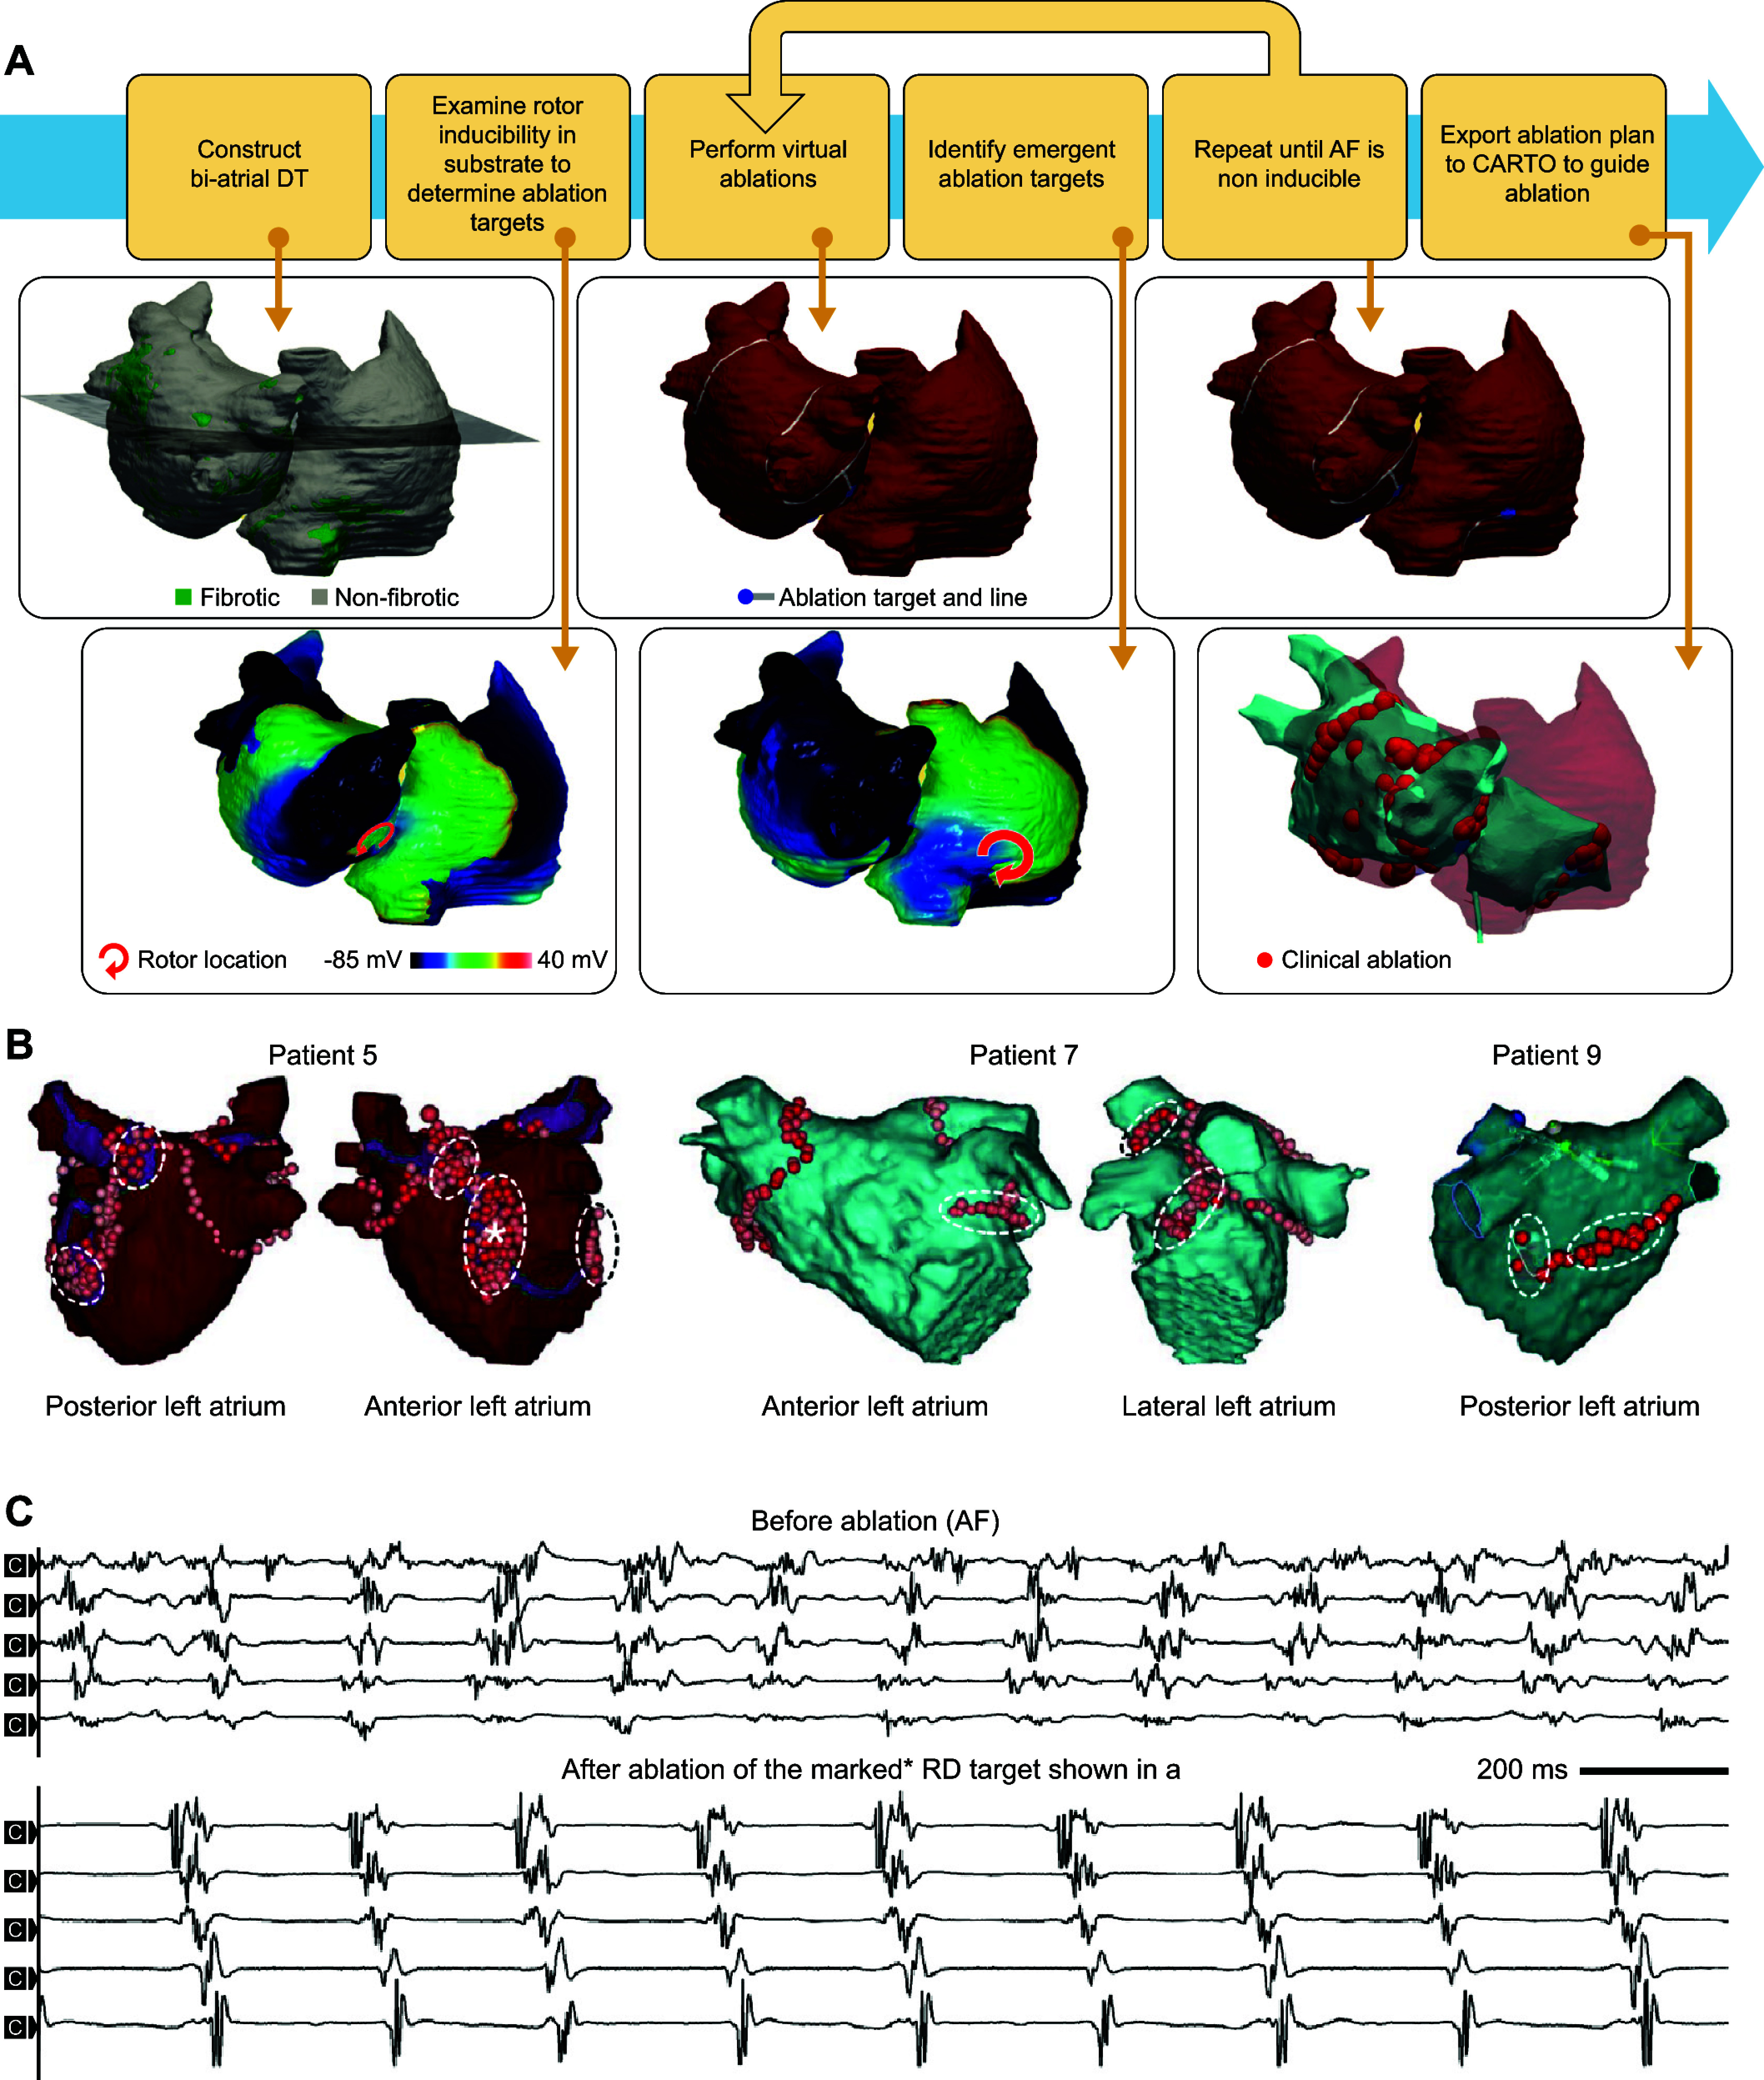
The complexity of cardiac electrophysiology, involving dynamic changes in numerous components across multiple spatial (from ion channel to organ) and temporal (from milliseconds to days) scales, makes an intuitive or empirical analysis of cardiac arrhythmogenesis challenging. Multiscale mechanistic computational models of cardiac electrophysiology provide precise control over individual parameters, and their reproducibility enables a thorough assessment of arrhythmia mechanisms. This review provides a comprehensive analysis of models of cardiac electrophysiology and arrhythmias, from the single cell to the organ level, and how they can be leveraged to better understand rhythm disorders in cardiac disease and to improve heart patient care. Key issues related to model development based on experimental data are discussed, and major families of human cardiomyocyte models and their applications are highlighted. An overview of organ-level computational modeling of cardiac electrophysiology and its clinical applications in personalized arrhythmia risk assessment and patient-specific therapy of atrial and ventricular arrhythmias is provided. The advancements presented here highlight how patient-specific computational models of the heart reconstructed from patient data have achieved success in predicting risk of sudden cardiac death and guiding optimal treatments of heart rhythm disorders. Finally, an outlook toward potential future advances, including the combination of mechanistic modeling and machine learning/artificial intelligence, is provided. As the field of cardiology is embarking on a journey toward precision medicine, personalized modeling of the heart is expected to become a key technology to guide pharmaceutical therapy, deployment of devices, and surgical interventions.

Keywords: arrhythmias; atrial fibrillation; cardiac electrophysiology; computational modeling; sudden cardiac death.


Conflict of interest statement

No conflicts of interest, financial or otherwise, are declared by the authors.

Figures

None
Graphical abstract
FIGURE 1.
FIGURE 1.
The growing importance of computational modeling of cardiac electrophysiology. The bar chart shows the number of publications on computational modeling of cardiac electrophysiology since the 1950s indexed in PubMed. Key milestones discussed in the historical overview have been highlighted in boxes. Together, these studies have formed the foundation for recent and ongoing work with real-world implications for mechanistic research, safety pharmacology and personalized therapy. AF, atrial fibrillation; VARP, virtual heart arrhythmia predictor; VT, ventricular tachycardia.
FIGURE 2.
FIGURE 2.
Schematic overview of cardiac cellular electrophysiology in different regions of the heart, including action potentials and underlying ion currents (gray panels), as well as schematic representation of subcellular structures in sinoatrial node cells (top), atrial cardiomyocytes (CMs; middle), and ventricular CMs (bottom). ICa,L, L-type Ca2+ current; ICa,T, T-type Ca2+ current; If, hyperpolarization-activated cyclic nucleotide-gated “funny” current; IK1, basal inward-rectifier K+ current; IK,ACh, acetylcholine-activated inward-rectifier K+ current; IKr, rapid delayed-rectifier K+ current; IKs, slow delayed-rectifier K+ current; IKur, ultra-rapid delayed-rectifier K+ current; INa, Na+ current; Ito, transient outward K+ current; NCX, Na+/Ca2+-exchanger; RyR2, ryanodine receptor channel type 2; SERCA, sarco(endo)plasmic reticulum Ca2+-ATPase; SR, sarcoplasmic reticulum.
FIGURE 3.
FIGURE 3.
Cardiac cellular electrophysiology modeling approaches. A: general equation representing the change in membrane potential (VM) used to simulate the cardiac action potential as the product of the inverse of membrane capacitance (CM) and the sum of all ion currents (IX). The second equation shows the 3 major components determining the magnitude of an ion current IX. B: most commonly used approaches to model the open probability of a cardiac ion channel. Instantaneous models are direct functions of VM, whereas Hodgkin–Huxley and Markov models are controlled by independent or connected ordinary differential equations (ODEs), respectively. 0K1, 0Na and 0X represent the open probability of the inward-rectifier K+ channel, Na+ channel, and a hypothetical ion channel, respectively, and are determined directly by VM, by the product of an activation gate (m) and an inactivation gate (h), or by a set of coupled ODEs connecting closed (CX), open (OX) and blocked (BX) states. C: emerging approaches for modeling channel gating based on protein structures. C was adapted from Refs. and , with permission from Proceedings of the National Academy of Sciences USA and Biophysical Journal, respectively.
FIGURE 4.
FIGURE 4.
Primary human sinoatrial node (SAN) and atrial cardiomyocyte and sinoatrial node models. Simulated action potentials [transmembrane voltage (VM)] and Ca2+ transients ([Ca2+]i), model structure, simulated ion currents and fluxes, and special features are highlighted. Traces were simulated using the human SAN cell models from Fabbri 2017 (120), as well as models from Bai 2018 (121), Grandi 2011 (90), Koivumäki 2011 (121,122) Courtemanche 1998 (45), and Nygren 1998 (44, 118). Models were obtained from https://www.cellml.org/ or implemented based on the model equations. AP, action potential; APD, action potential duration; CYT, cytosol; ICab, background Ca2+ current; ICa,L, L-type Ca2+ current; ICa,T, T-type Ca2+ current; IClb, background Cl current; IClCa, Ca2+-dependent Cl current; If, hyperpolarization-activated cyclic nucleotide-gated “funny” current; IK1, basal inward-rectifier K+ current; IK,ACh, acetylcholine-activated inward-rectifier K+ current; IKp, plateau K+ current; IKr, rapid delayed-rectifier K+ current; IKs, slow delayed-rectifier K+ current; IKur, ultrarapid delayed-rectifier K+ current; INa, Na+ current; INab, background Na+ current; INaK, Na+-K+-ATPase current; INCX, Na+/Ca2+ exchange current; IpCa, plasmalemmal Ca2+-ATPase current; Isus, sustained K+ current; Ito, transient outward K+ current; Jleak, Ca2+ leak from sarcoplasmic reticulum; Jrel, Ca2+-release flux from the sarcoplasmic reticulum; JSR, junctional sarcoplasmic reticulum; Jup, Ca2+ uptake flux into the sarcoplasmic reticulum; NSR, network sarcoplasmic reticulum; SR, sarcoplasmic reticulum; SS, subspace Ca2+ domain.
FIGURE 5.
FIGURE 5.
Primary human Purkinje cell models. Simulated action potentials [transmembrane voltage (VM)] and Ca2+ transients ([Ca2+]i), model structure, simulated ion currents and fluxes, and special features are highlighted. Traces were simulated with human Purkinje cell models from Trovato 2020 (146), Sampson 2010 (145), and Stewart 2009 (143). Models were obtained from https://www.cellml.org/ or implemented based on the model equations. CaMKII, Ca2+/calmodulin-dependent protein kinase II; CSR, corbular sarcoplasmic reticulum; CYT, cytosol; ICab, background Ca2+ current; ICaK, K+ flux through the L-type Ca2+ channel; ICa,L, L-type Ca2+ current; ICa,T, T-type Ca2+ current; If, hyperpolarization-activated cyclic nucleotide-gated “funny” current; IK1, basal inward-rectifier K+ current; IKp, plateau K+ current; IKr, rapid delayed-rectifier K+ current; IKs, slow delayed-rectifier K+ current; INa, Na+ current; INa,late, persistent late Na+ current; INab, background Na+ current; INaK, Na+-K+-ATPase current; INaCa, Na+/Ca2+ exchange current; IpCa, plasmalemmal Ca2+-ATPase current; Isus, sustained K+ current; Ito, transient outward K+ current; JIP3R, inositol trisphosphate receptor Ca2+ flux; Jleak, Ca2+ leak from sarcoplasmic reticulum; Jrel, Ca2+-release flux from the sarcoplasmic reticulum; JSR, junctional sarcoplasmic reticulum; Jup, Ca2+ uptake flux into the sarcoplasmic reticulum; NSR, network sarcoplasmic reticulum; RyR(2/3), ryanodine receptor (type 2/3); SERCA(1/2), sarco(endo)plasmic reticulum Ca2+-ATPase (type 1/2); SL, subsarcolemmal space; SR, sarcoplasmic reticulum; SS, subspace Ca2+ domain.
FIGURE 6.
FIGURE 6.
Primary human ventricular cardiomyocyte models. Simulated action potentials [transmembrane voltage (VM)] and Ca2+ transients ([Ca2+]i), model structure, simulated ion currents and fluxes, and special features are highlighted. Traces were simulated with the human ventricular cardiomyocyte models from O’Hara–Rudy 2011 (67), Grandi 2010 (147), Bueno-Orovio 2008 (77), ten Tusscher 2004 (144), Iyer 2004 (148), and Priebe–Beuckelmann 1998 (77, 149). Models were obtained from https://www.cellml.org/ or implemented based on the model equations. CaMKII, Ca2+/calmodulin-dependent protein kinase-II; CYT, cytosol; ICab, background Ca2+ current; ICaK, K+ flux through the L-type Ca2+ channel; ICa,L, L-type Ca2+ current; ICaNa, Na+ flux through the L-type Ca2+ current; IClb, background Cl current; IClCa, Ca2+-dependent Cl current; IK1, basal inward-rectifier K+ current; IKb, background K+ current; IKr, rapid delayed-rectifier K+ current; IKs, slow delayed-rectifier K+ current; INa, Na+ current; INa,late, persistent late Na+ current; INab, background Na+ current; INaK, Na+-K+-ATPase current; INaCa, Na+/Ca2+ exchange current; IpCa, plasmalemmal Ca2+-ATPase current; Ito, transient outward K+ current; Jleak, Ca2+ leak from sarcoplasmic reticulum; Jrel, Ca2+-release flux from the sarcoplasmic reticulum; JSR, junctional sarcoplasmic reticulum; Jup, Ca2+ uptake flux into the sarcoplasmic reticulum; [K+]o, extracellular potassium concentration; NSR, network sarcoplasmic reticulum; SR, sarcoplasmic reticulum; SS, subspace Ca2+ domain.
FIGURE 7.
FIGURE 7.
Primary human induced pluripotent stem cell-derived cardiomyocyte models. Simulated action potentials [transmembrane voltage (VM)] and Ca2+ transients ([Ca2+]i), model structure, simulated ion currents and fluxes, and special features are highlighted. Traces were simulated with models from Akwaboah 2021 (179), Kernik 2019 (178), Koivumäki 2018 (177), and Paci 2013 (174). Models were obtained from https://www.cellml.org/ or implemented based on the model equations. CYT, cytosol; ICab, background Ca2+ current; ICa,L, L-type Ca2+ current; ICa,T, T-type Ca2+ current; If, hyperpolarization-activated cyclic nucleotide-gated “funny” current; IK1, basal inward-rectifier K+ current; IK,ACh, acetylcholine-activated inward-rectifier K+ current; IKr, rapid delayed-rectifier K+ current; IKs, slow delayed-rectifier K+ current; IKur, ultrarapid delayed-rectifier K+ current; INa, Na+ current; INab, background Na+ current; INaK, Na+-K+-ATPase current; INaCa, Na+/Ca2+ exchange current; IpCa, plasmalemmal Ca2+-ATPase current; Ito, transient outward K+ current; JIP3R, inositol triphosphate receptor Ca2+ flux; Jleak, Ca2+ leak from sarcoplasmic reticulum; Jrel, Ca2+ release flux from the sarcoplasmic reticulum; JSR, junctional sarcoplasmic reticulum; Jup, Ca2+ uptake flux into the sarcoplasmic reticulum; NSR, network sarcoplasmic reticulum; SR, sarcoplasmic reticulum; SS, subspace Ca2+ domain.
FIGURE 8.
FIGURE 8.
Use of cardiac cellular electrophysiology models in cardiac safety pharmacology: the Comprehensive in vitro Proarrhythmia Assay (CiPA) initiative. A: an updated version of the O’Hara et al. (67) model of the human ventricular cardiomyocyte by Dutta et al. (157) (CiPA-ORd) was used to simulate the effects of a compound on individual ion channels (step 1). A torsade des pointes (TdP) risk metric score was calculated, and thresholds for separating low-, medium-, and high-risk drugs were established based on a training set of 12 drugs with known half-maximal inhibitory concentrations (IC50 values) for different ion channels and known clinical TdP risk (step 2). The model performance was validated in an independent set of 16 drugs (step 3). B: the model can be employed to assess the risk of new compounds based on their experimentally characterized effects on different ion channels. APD, action potential duration; IK1, basal inward-rectifier K+ current; IKr, rapid delayed-rectifier K+ current; IKs, slow delayed-rectifier K+ current.
FIGURE 9.
FIGURE 9.
Computational models of the heart. A: imaging modalities used in whole heart modeling. Ex vivo images reproduced from Ref. , with permission from Journal of Cardiovascular Magnetic Resonance (left), and Ref. (center) and Ref. (right), with permission from Circulation: Arrhythmia and Electrophysiology. B: personalized atrial and ventricular models reconstructed from various imaging modalities. Images of ex vivo ventricular and atrial models reproduced from Ref. (top), with permission from Circulation: Arrhythmia and Electrophysiology, and Ref. (bottom), with permission from Journal of American Heart Association. Images of late gadolinium enhancement (LGE)-magnetic resonance imaging (MRI)-based ventricular and atrial models reproduced from Ref. (top) and Ref. (bottom), with permission from Nature Biomedical Engineering. Computed tomography (CT) images reproduced from Ref. (top), with permission from Circulation: Arrhythmia and Electrophysiology, and Ref. (bottom), with permission from Progress in Biophysics and Molecular Biology. Image of T1-MRI-based model reproduced from Ref. , with permission from eLife. Image of MRI-positron emission tomography (PET) model reproduced from Ref. , with permission from Science Advances. C: fiber orientations mapped to personalized heart models. Images reproduced from Ref. (left), with permission from Journal of Cardiovascular Magnetic Resonance, and Ref. (center), with permission from Circulation: Arrhythmia and Electrophysiology. BB, Bachmann’s bundle; CT, crista terminalis; IAS, interatrial septum; IVC, inferior vena cava; LA, left atrium; LAA, left atrial appendage; LIPV, left inferior pulmonary vein; LSPV, left superior pulmonary vein; LV, left ventricle; PLA, posterior left atrium; RA, right atrium; RAA, right atrial appendage; RIPV, right inferior pulmonary vein; RSPV, right superior pulmonary vein; RV, right ventricle; SVC, superior vena cava.
FIGURE 10.
FIGURE 10.
Use of atrial and ventricular organ-level modeling in arrhythmia and electrophysiology applications. A computational model of the ventricles and/or atria integrates multiple clinical and experimental data to provide an individualized virtual representation of the organ. Simulations using virtual hearts are used in arrhythmia and electrophysiology research with the 4 applications covered in this review.
FIGURE 11.
FIGURE 11.
Arrhythmogenic mechanisms in the human ventricles and atria. A: vulnerability for arrhythmias increases with steeper repolarization time gradients and larger early-repolarization regions. Left: arrhythmia inducibility is tested for various locations; the color reflects the size of the temporal vulnerable window (white indicates that no arrhythmia could be induced). Right: this was tested for 9 combinations of small, medium, or large gradients and small, medium, or large early-repolarization time (RT) areas. The computational model demonstrates that the spatial vulnerable region increased with a larger size of the early-RT area. In explanted hearts, there was an increasing number of inducible pacing locations at the early-RT region with steeper repolarization time gradients. *P < 0.05. Modified from Ref. , with permission from Science Translational Medicine. B, top: human torso/biventricular electrophysiology model in acute regional ischemia for ECG and arrhythmia simulations. Bottom: ECG alterations caused by acutely ischemic regions, for left circumflex (LCX; a) vs. left anterior descending (LAD; b) artery occlusion. CV, conduction velocity; QRSDS, QRS downslope. Modified from Ref. , with permission from Scientific Reports. C: arrhythmogenicity of penetrating adipose tissue (inFAT) versus scar, shown with 3 different heart models. Number and distribution of ventricular tachycardias (VTs) across the 3 models are shown. LGE, late gadolinium enhancement. NS, not significant. Reproduced from Ref. , with permission from Nature Cardiovascular Research. D: arrhythmogenesis arising from calcium-driven alternans in a model of human atrial fibrillation. Shown are discordant action potential duration (APD) alternans and filaments during fast pacing. a: APD alternans magnitude in ALTfast (top) and ALTslow (bottom) atrial models during pacing at 270-ms cycle length. The 2 atrial models use 2 different membrane kinetics: ALTfast, with single-cell alternans occurring only at fast pacing rates (cycle length ≤250 ms) and ALTslow, with single-cell alternans occurring at slower pacing rates (≤400 ms). b: nodal surfaces (black) and filaments (color) in ALTslow during 260-ms cycle length pacing. Snapshots show filament locations at different times after a paced beat from sinoatrial node region. Filaments from the first 4 beats are shown in different colors on the same snapshot for comparison. Reproduced from Ref. , with permission from Scientific Reports.
FIGURE 12.
FIGURE 12.
Exploration of arrhythmogenic mechanisms in nonischemic cardiomyopathy. A: flowchart summarizing the study of ventricular arrhythmias in hypertrophic cardiomyopathy (HCM) patients. A combination of late gadolinium enhancement (LGE)-cardiac magnetic resonance (CMR) imaging and postcontrast T1 mapping is used to construct personalized left ventricular (LV) geometrical models with diffuse and dense scar. Incorporating HCM-specific electrophysiological properties (action potential kinetics, conduction velocity) completes the generation of each ventricular model, which is then used to study arrhythmia mechanisms. Modified from Ref. , with permission from eLife. B: flowchart summarizing the workflow of using a genotype patient-specific biventricular model, i.e. “digital twin” (Geno-DT) to understand arrhythmogenesis in arrhythmogenic cardiomyopathy in 2 genotype groups, plakophilin-2 (PKP2) and gene-elusive (GE). Orange blocks refer to clinical data, which include genetic testing results and LGE-CMR images for each patient in the cohort. Patient-specific geometrical heart models were reconstructed from the LGE-CMR (top, purple, left and center images). Genotype-specific cell models (green) developed here were incorporated into each heart model based on the patient’s genetic testing result. The integrated multiscale patient-specific Geno-DT models were used to understand the role of remodeling in arrhythmogenesis and to predict ventricular tachycardia (VT) circuits (bottom, gray). Modified from Ref. , with permission from eLife. ICa,b, background Ca2+ current; ICa,L, L-type Ca2+ current; IK1, basal inward-rectifier K+ current; IKr, rapid delayed-rectifier K+ current; IKs, slow delayed-rectifier K+ current; Ileak, Ca2+ leak from sarcoplasmic reticulum; INa, Na+ current; INa,b, background Na+ current; INa,K, Na+-K+-ATPase current; INa,Ca, Na+/Ca2+ exchange current; Ip,Ca, plasmalemmal Ca2+-ATPase current; Irel, Ca2+ release flux from the sarcoplasmic reticulum; Ito, transient outward K+ current; Iup, Ca2+ uptake flux into the sarcoplasmic reticulum; Ixfer, transfer of Ca2+ from subspace to cytosol.
FIGURE 13.
FIGURE 13.
Predicting sudden cardiac death from ventricular arrhythmias (SCDA) risk in patients with different arrhythmogenic heart diseases. Arrhythmias in the different models are shown on left for each heart condition. White arrows indicate the ventricular tachycardia (VT) reentrant circuit in each model. ACCF/AHA, American College of Cardiology Foundation/American Heart Association; CHAI, Computational Heart and AI risk predictor; CI, confidence interval; ESC, European Society of Cardiology; FDG, fluorodeoxyglucose; GZ, gray zone; LGE, late gadolinium enhancement; LVEF, left ventricular ejection fraction; NPV, negative predictive value; PPV, positive predictive value; VARP, virtual heart arrhythmia predictor. Modified with permission from Ref. , with permission from Nature Communications; Ref. , with permission from eLife; and Ref. , with permission from Scientific Advances.
FIGURE 14.
FIGURE 14.
Computational assistance in assessing reentrant circuits and guiding ventricular ablation. A, top: a flowchart summarizing the protocol (arrowed steps) and the retrospective and prospective studies. Bottom: results from the prospective human study, showing simulation-guided ablation for 2 patients with implantable cardioverter defibrillators (ICDs). Left: reconstructed ventricular models with different remodeled regions. Center: activation maps corresponding to the 2 ventricular tachyarrhythmia (VT) morphologies induced in the 2 patient heart models. White arrowheads depict the direction of propagation of the excitation wave. The color scale indicates activation times, and black indicates tissue regions that did not activate. Right: simulation-predicted ablation targets for the 2 VT morphologies. Coregistration of the simulation-predicted targets (purple) with the CARTO 3 endocardial surface (green). The red dots correspond to locations of the tip of the catheter during ablation. The left ventricular endocardial surface is shown in green, and the total infarct region is shown in gray. Noninjured and scar tissues are shown in red and yellow, respectively. Modified from Ref. , with permission from Nature Biomedical Engineering. B: model-based feature augmentation for ablation target learning from images. Modified from Ref. , with permission from Circulation: Arrhythmia and Electrophysiology. The pipeline shows the clinical data and the data processing, feature extraction, and learning stages. It shows electrogram (EGM) labeling (local abnormal ventricular activities, LAVA) used in the training process. Both simulated and image features are fed into the random forest algorithm for training. Ablation targets are predicted with the confidence in prediction provided. Modified from Ref. , with permission from IEEE Transactions on Biomedical Engineering.
FIGURE 15.
FIGURE 15.
Computational guidance of atrial fibrillation (AF) ablation and assessment of the fibrotic substrate. A: the OPTIMA approach. The individual steps are illustrated with the model of 1 of the participants in the study. Late gadolinium enhancement scans were used to construct the patient’s biatrial geometry and fibrosis distribution digital twin (DT). After a baseline inducibility test, 1 location at the left atrial anterior septal wall was determined to have a high likelihood of sustaining a rotor (bottom left). After virtual ablations targeting the detected location, a repeat inducibility test identified an emergent rotor location at the right atrial posterior region, which was then ablated. The final optimal ablation targets resulted in a complete arrhythmia noninducibility of the substrate. The proposed targets were imported to the CARTO system to guide ablation procedure. B: sites of ablation delivery (with catheter tip locations marked by red dots) in the left atrium, as rendered by the CARTO intracardiac mapping system at the end of the clinical ablation procedure in 3 patients. *Marked RD targets. Modified from Ref. , with permission from Nature Biomedical Engineering. C: bipolar electrogram recordings from a decapolar catheter placed in the coronary sinus of patient 5. In patient 5, ablation of the marked anterior left atrial target (shown in B by an asterisk for patient 5) resulted in a transient change from AF (top set of 5 electrograms) to an organized atrial tachycardia or flutter (bottom set of 5 electrograms). Modified from Ref. , with permission from Nature Biomedical Engineering.

References

    1. Bartos DC, Grandi E, Ripplinger CM. Ion channels in the heart. Compr Physiol 5: 1423–1464, 2015. doi:10.1002/cphy.c140069. - DOI - PMC - PubMed
    1. Varró A, Tomek J, Nagy N, Virág L, Passini E, Rodriguez B, Baczkó I. Cardiac transmembrane ion channels and action potentials: cellular physiology and arrhythmogenic behavior. Physiol Rev 101: 1083–1176, 2021. doi:10.1152/physrev.00024.2019. - DOI - PubMed
    1. Kleber AG, Jin Q. Coupling between cardiac cells—an important determinant of electrical impulse propagation and arrhythmogenesis. Biophys Rev 2: 31301, 2021. doi:10.1063/5.0050192. - DOI - PMC - PubMed
    1. Carmeliet E. Pacemaking in cardiac tissue. From IK2 to a coupled-clock system. Physiol Rep 7: e13862, 2019. doi:10.14814/phy2.13862. - DOI - PMC - PubMed
    1. Ernault AC, Meijborg VM, Coronel R. Modulation of cardiac arrhythmogenesis by epicardial adipose tissue: JACC State-of-the-Art Review. J Am Coll Cardiol 78: 1730–1745, 2021. doi:10.1016/j.jacc.2021.08.037. - DOI - PubMed

MeSH terms

LinkOut - more resources