. 2023 Dec 28;134(5):e169576.
doi: 10.1172/JCI169576.

Single-cell deconvolution reveals high lineage- and location-dependent heterogeneity in mesenchymal multivisceral stage 4 colorectal cancer

Affiliations

Single-cell deconvolution reveals high lineage- and location-dependent heterogeneity in mesenchymal multivisceral stage 4 colorectal cancer

Christopher Berlin et al. J Clin Invest. .

Abstract

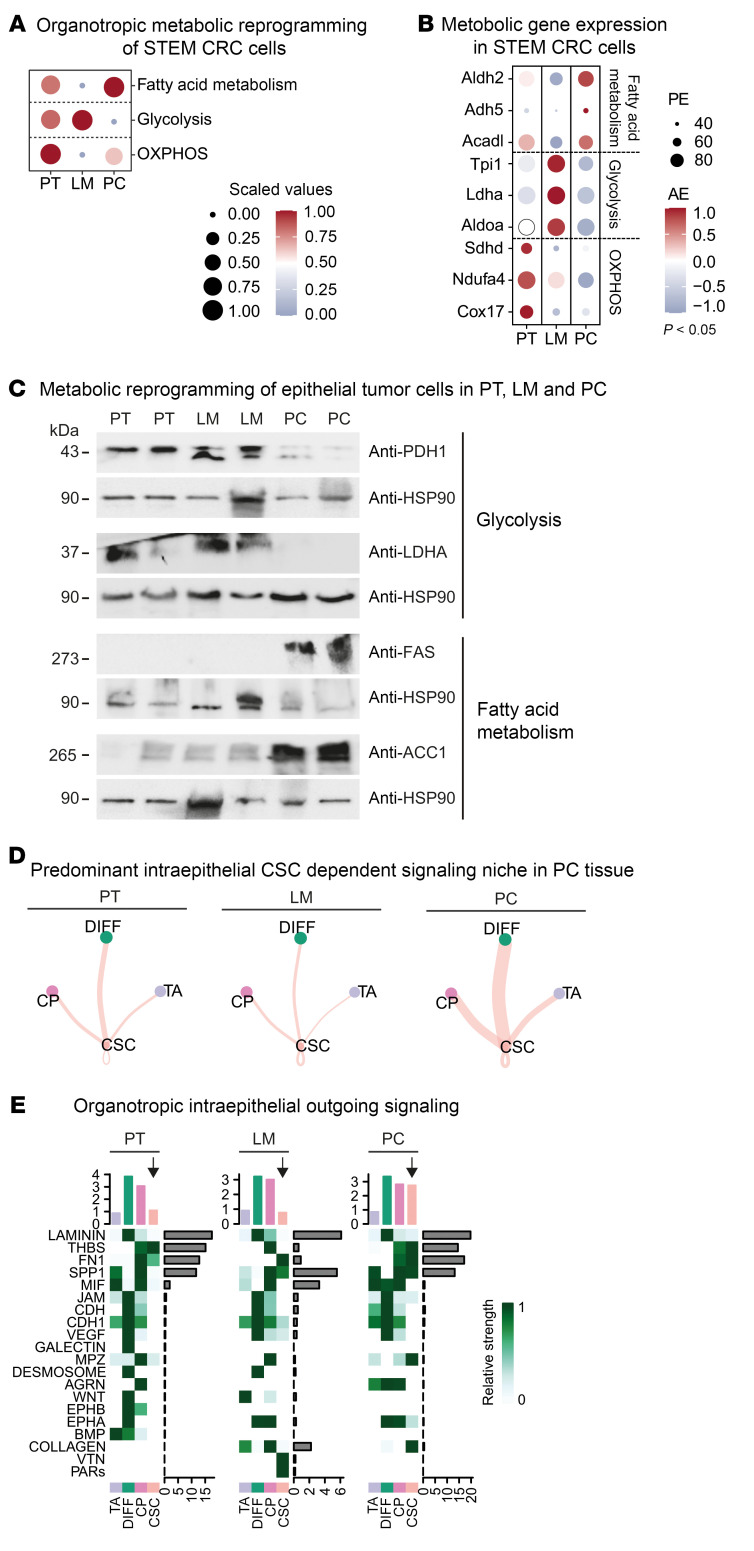
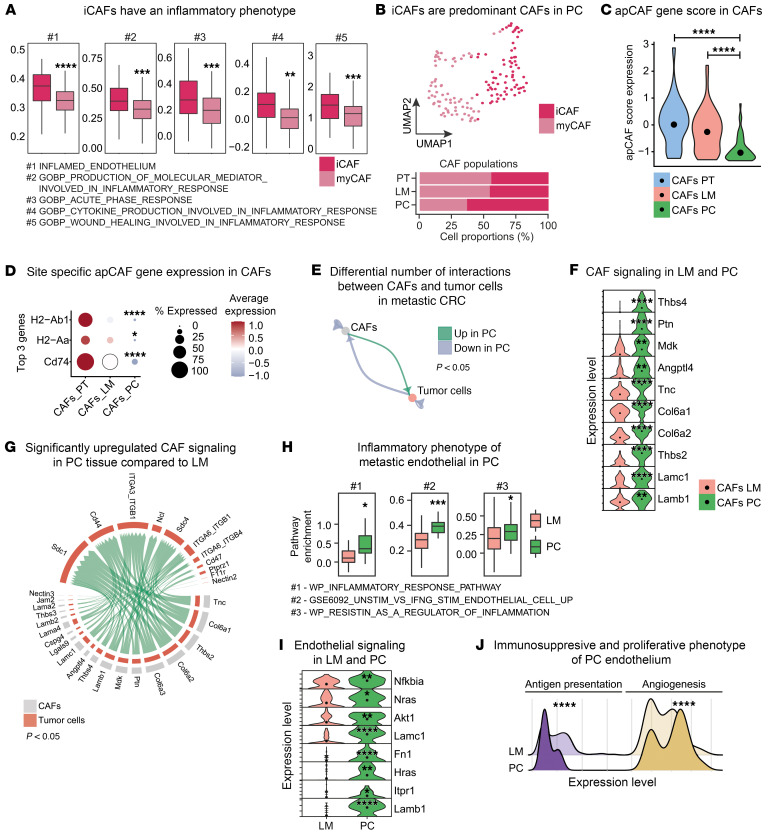
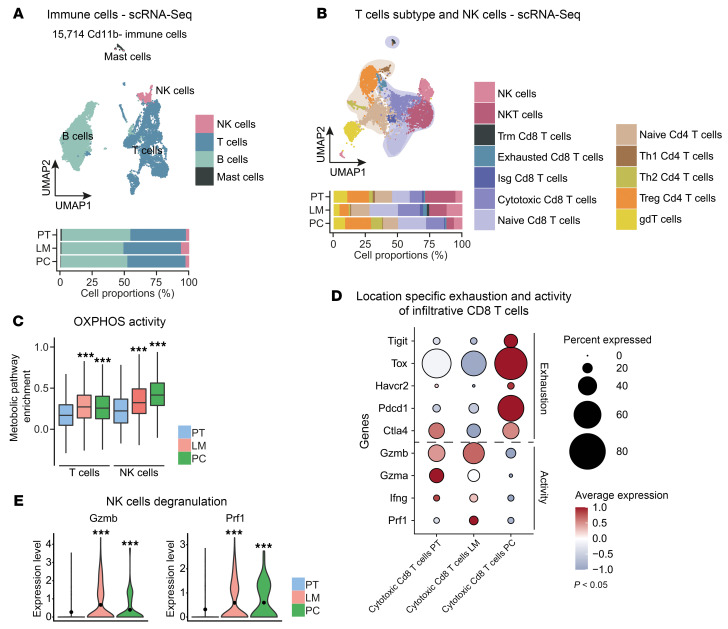
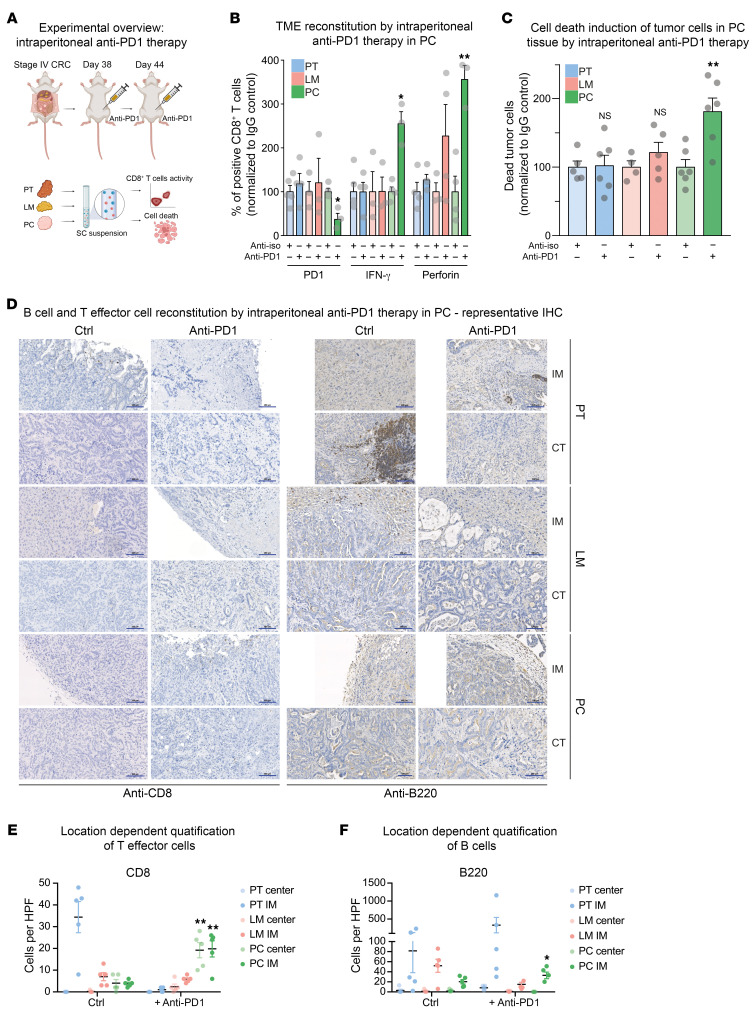
Metastasized colorectal cancer (CRC) is associated with a poor prognosis and rapid disease progression. Besides hepatic metastasis, peritoneal carcinomatosis is the major cause of death in Union for International Cancer Control (UICC) stage IV CRC patients. Insights into differential site-specific reconstitution of tumor cells and the corresponding tumor microenvironment are still missing. Here, we analyzed the transcriptome of single cells derived from murine multivisceral CRC and delineated the intermetastatic cellular heterogeneity regarding tumor epithelium, stroma, and immune cells. Interestingly, we found an intercellular site-specific network of cancer-associated fibroblasts and tumor epithelium during peritoneal metastasis as well as an autologous feed-forward loop in cancer stem cells. We furthermore deciphered a metastatic dysfunctional adaptive immunity by a loss of B cell-dependent antigen presentation and consecutive effector T cell exhaustion. Furthermore, we demonstrated major similarities of this murine metastatic CRC model with human disease and - based on the results of our analysis - provided an auspicious site-specific immunomodulatory treatment approach for stage IV CRC by intraperitoneal checkpoint inhibition.

Keywords: Cancer immunotherapy; Cell biology; Colorectal cancer; Mouse models; Oncology.


Figures

Figure 1
Figure 1. A distinct cellular and functional landscape of murine primary CRC, LM, and PC.
(A) Exemplary screenshot during murine laparoscopy after 8 weeks. White dashed lines mark interenteric and abdominal wall peritoneal tumors as well as LMs. (B) Overview of murine metastasized stage IV CRC upon animal sacrifice (left panel). Quantification of location-dependent macroscopic tumor mass as percentages. Locations: PT, LN, LM, PM, and PC (right panel). (C) UMAP plot of 8,094 cells identified by joint application of RCA and CCA and color coded by cell type (upper panel). Proportions of all cell types in PT, LM, and PC (left lower panel) or of the TME (right lower panel) on average are shown. (D) Canonical marker gene expression for multiple cell types centered to the average expression of each gene across all cells. The dot size represents the proportion of expressing cells in each cluster. PE, percentage expressed; AE, average expression. (E) UMAP plot of 5,533 tumor cells identified by joint application of RCA and CCA and color coded by cell subtype (upper panel). Proportions of all cell types in PT, LM, and PC (lower panel) on average are shown. (F) Canonical marker gene expression for epithelial cell subtypes centered to the average expression of each gene across all cells. Dot size represents the proportion of expressing cells in each cluster.
Figure 2
Figure 2. Location-specific metabolic reprogramming of the STEM in multivisceral CRC.
(A) Metabolic activity analysis in the STEM of PT, LM, and PC. Circle size and color represent scaled metabolic score. (B) Expression of the top 3 differentially expressed metabolic genes in the STEM of PT, LM, and PC centered to the average expression of each gene across all locations. Dot size represents the proportion of expressing cells in each cluster. P < 0.05. (C) Representative Western blot showing expression of depicted proteins in pooled epithelial lysates (n = 5 animals per column) from murine PT, LM, and PC. Separate loading control for each Western blot: HSP90. The experiment was performed twice. (D) Significant L-R pairs between any pair of 2 epithelial cell populations in PT, LM, and PC. Width represents communication probability. (E) Heatmap shows the relative importance in depicted signaling pathways for each cell group based on the computed centrality measures in PT, LM, and PC. Arrows indicate outgoing signaling patterns from CSCs.
Figure 3
Figure 3. Intermetastatic differences in stromal cell dynamics during CRC metastasis.
(A) Pathway enrichment analysis with published inflammatory signatures in myCAFs and iCAFs. (B) UMAP plot of myCAFs and iCAFs identified by joint application of RCA and CCA and color coded by cell subtype (upper panel). Proportions of cell subtypes in PT, LM, and PC tissue (lower panel) on average are shown. (C) Expression level of apCAF gene score (Supplemental Table 4) in CAFs from PT, LM, and PC depicted as violin plot. (D) Expression of the top 3 differentially expressed genes involved in antigen presentation in CAFs of PT, LM, and PC centered to the average expression of each gene across all locations. Dot size represents the proportion of expressing cells in each cluster. (E) Differential numbers of L-R interactions between CAFs and tumor cells in LM compared with PC. Green, upregulation in PC compared with LM; blue, downregulation in PC compared with LM. (F) Expression level of significantly upregulated exemplary L or R genes in PC compared with LM depicted as stacked violin plot. (G) Significantly upregulated L-R pairs between CAFs and tumor cells in PC compared with LM depicted as circle plot. (H) Pathway enrichment analysis in endothelial cells from LM and PC with published gene signatures. (I) Expression levels of significantly upregulated exemplary genes involved in inflammation and proliferation in PC and LM depicted as stacked violin plot. (J) Expression levels of antigen presentation and angiogenesis gene scores (Supplemental Table 4) in endothelial cells from LM and PC depicted as ridge plot. *P < 0.05; **P < 0.01; ***P < 0.001; ****P < 0.0001, Student’s t test.
Figure 4
Figure 4. Location-specific antitumoral immunity during CRC metastasis.
(A) UMAP plot of 15,714 CD45+CD11b immune cells identified by joint application of RCA and CCA and color coded by cell subtype (upper panel). Proportions of all cell types in PT, LM, and PC (lower panel) on average are shown. (B) UMAP plot of T and NK cells identified by joint application of RCA and CCA and color coded by cell type (upper panel). Proportions of all cell types in PT, LM, and PC (lower panel) on average are shown. (C) Metabolic activity analysis in T cells and NK cells of PT, LM, and PC. Metabolic score depicted as box plot. (D) Expression of significantly differentiated genes involved in activity and exhaustion of cytotoxic CD8+ T cells from PT, LM, and PC centered to the average expression of each gene across all locations. Dot size represents the proportion of expressing cells in each cluster. P < 0.05. (E) Expression level of Gzmb and Prf1 in NK cells from PT, LM, and PC depicted as violin plot. ***P < 0.001, Student’s t test.
Figure 5
Figure 5. Impairment of B cell networks in metastasized CRC.
(A) UMAP plot of 3,355 B cells identified by joint application of RCA and CCA and color coded by cell subtype (upper panel). Proportions of all cell subtypes in PT, LM, and PC (lower panel) on average are shown. Dashed lines mark primed and unprimed/immature B cell subtypes. (B) Ingoing and outgoing interaction strength of B cells with joint projection and clustering B cell subtypes onto shared 2D manifold according to their local descent. MET, combined analysis for LM and PC. Circle or square size is proportional to the signaling strength of respective cellular subtype. Different colors represent different B cell subtypes. (C) Unbiased overall information flow of signaling networks by summarizing all the communication probabilities in respective networks. All the significant signaling pathways were ranked based on their differences of overall information flow within the inferred networks between PT and MET. Brown, enriched in PT; purple, enriched in MET. (D) Significant L-R pairs of the MHC-II signaling network between B cell subtypes and Th1 Cd4+ T cells in PT and MET. Edge width represents MHC-II–dependent communication probability.
Figure 6
Figure 6. Intermetastatic alterations of adaptive immune responses to multivisceral CRC.
(A) Significant L-R pairs of the PD-L1 signaling network between Th2 Cd4+ T cells and other T cell subtypes in PT and MET. Edge width represents MHC-II–dependent communication probability. (B) Heatmap depicting the differential number of interactions between B and T cell subtypes in LM and PC. Colors represent relative values. (C) Differential numbers of L-R interactions between Th1 Cd4+ T cells and B cell and T cell subtypes in LM compared with PC. Green, upregulation in PC compared with LM; red, upregulation in LM compared with PC. Numbers indicate differentially regulated L-R pairs. (D) Expression levels of Cd274 in PC compared with LM depicted as violin plot.
Figure 7
Figure 7. Murine multivisceral APTKA CRC mimics human stage IV CRC.
(A) Experimental overview for integrated comparison of human and murine RNA-Seq data from PT and PC. (B) Batch-corrected PCA of 15 patient-matched hPT/hLM samples and 3 mPT/4 mLM samples shows location-dependent clustering of human and murine transcriptomes. (C) Estimated MCP scores reflecting immune cell infiltration in RNA samples from murine and human LM. (D) Batch-corrected PCA of 25 patient-matched hPT/hPC samples and 3 mPT/mPC samples shows location-dependent clustering of human and murine transcriptomes. (E) Estimated MCP scores reflecting immune cell infiltration in RNA samples from murine and human PC. ***P < 0.001, Student’s t test.
Figure 8
Figure 8. PC is associated with a mesenchymal phenotype in human and murine CRC.
(A and B) GSEA (Signal2Noize) with Hallmark EMT gene signature in murine and human PC. NES, normalized expression score. (C) Representative Western blot showing expression of depicted proteins in lysates from murine PT, LM, and PC. Fold change normalized to respective loading control (upper panel, β-actin; lower panel, HSP-90) and PT. The experiment was performed twice. (D) Western blot showing expression of depicted proteins in representative lysates from human PT, LM, and PC. Fold change normalized to respective loading control (upper panel, β-actin; lower panel, HSP-90) and PT. The experiment was performed twice. (E) Representative IHC of murine and human PT, LM, and PC for EPCAM, VIM, and ZEB1. IHC was performed on 10 tissue samples of each location. Scale bars: 100 μm.
Figure 9
Figure 9. Intraperitoneal application of ICB reconstitutes effector T cell function in PC and emphasizes the importance of a site-specific CRC therapy.
(A) Experimental overview of stage IV CRC treatment by intraperitoneal application of anti-PD1 therapy. (B) Quantification of changes in CD8+ T cell regulation upon ICB by FACS. Normalized to IgG control, in percentages. n = 3–5 per group. (C) Quantification of changes in epithelial cell death (EPCAM+Zombie+ cells) upon ICB by FACS. Normalized to IgG control, in percentages. n = 4–6 per group. (D) Representative IHC of murine PT, LM, and PC at the IM and CT for CD8 and b220 with and without anti-PD1 treatment. IHC was performed on 5 tissue samples for each location and antibody. (E) Quantification of CD8+ cells with and without ICB in PT, LM, and PC tissue at both IM and CT (n = 3–5). (F) Quantification of b220+ cells with and without ICB in PT, LM, and PC tissue at both IM and CT (n = 3–5). *P < 0.05; **P < 0.01, Student’s t test. Scale bars: 100 μm.

Comment in

  • The multivisceral landscape of colorectal cancer metastasis: Implications for targeted therapies

References

    1. Torre LA, et al. Global cancer statistics, 2012. CA Cancer J Clin. 2015;65(2):87–108. doi: 10.3322/caac.21262. - DOI - PubMed
    1. Zauber AG, et al. Colonoscopic polypectomy and long-term prevention of colorectal-cancer deaths. N Engl J Med. 2012;366(8):687–696. doi: 10.1056/NEJMoa1100370. - DOI - PMC - PubMed
    1. Lee JW, et al. Hepatocytes direct the formation of a pro-metastatic niche in the liver. Nature. 2019;567(7747):249–252. doi: 10.1038/s41586-019-1004-y. - DOI - PMC - PubMed
    1. Zhang C, et al. Mapping the spreading routes of lymphatic metastases in human colorectal cancer. Nat Commun. 2020;11(1):1993. doi: 10.1038/s41467-020-15886-6. - DOI - PMC - PubMed
    1. Yu J, et al. Liver metastasis restrains immunotherapy efficacy via macrophage-mediated T cell elimination. Nat Med. 2021;27(1):152–164. doi: 10.1038/s41591-020-1131-x. - DOI - PMC - PubMed

Publication types

LinkOut - more resources