Multicenter Study
. 2024 Apr 4;143(14):1391-1398.
doi: 10.1182/blood.2023021752.

Developmental trajectories and cooperating genomic events define molecular subtypes of BCR::ABL1-positive ALL

Affiliations
Multicenter Study

Developmental trajectories and cooperating genomic events define molecular subtypes of BCR::ABL1-positive ALL

Lorenz Bastian et al. Blood. .

Abstract

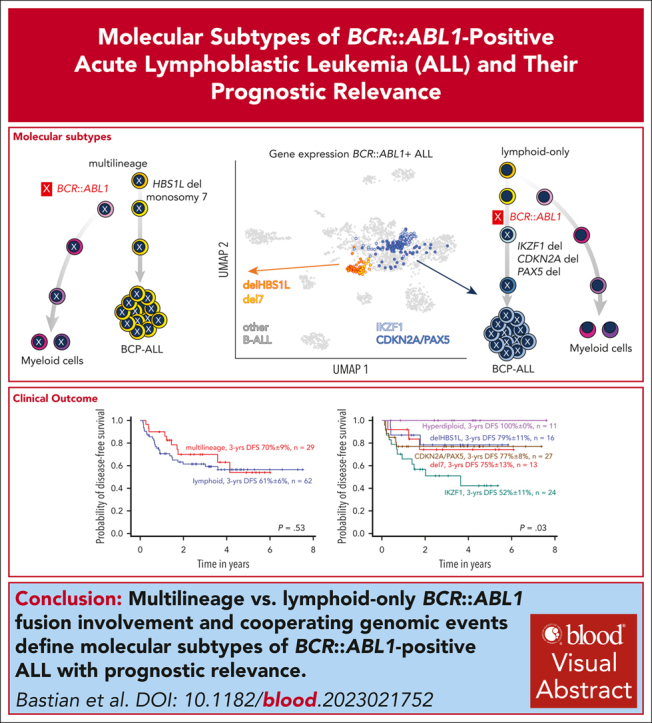
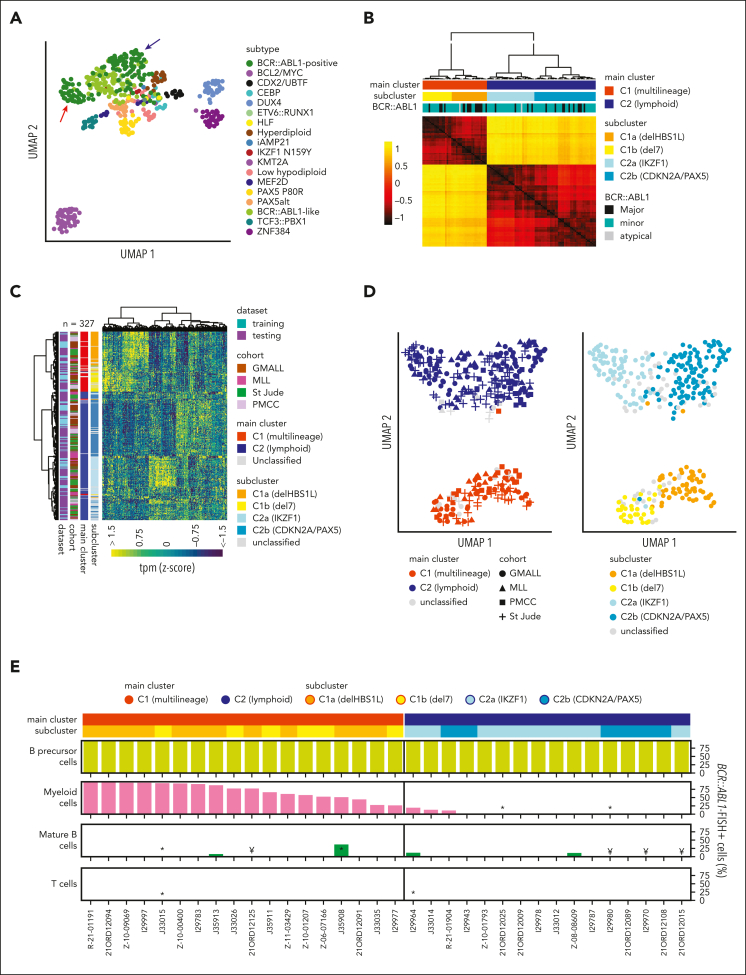
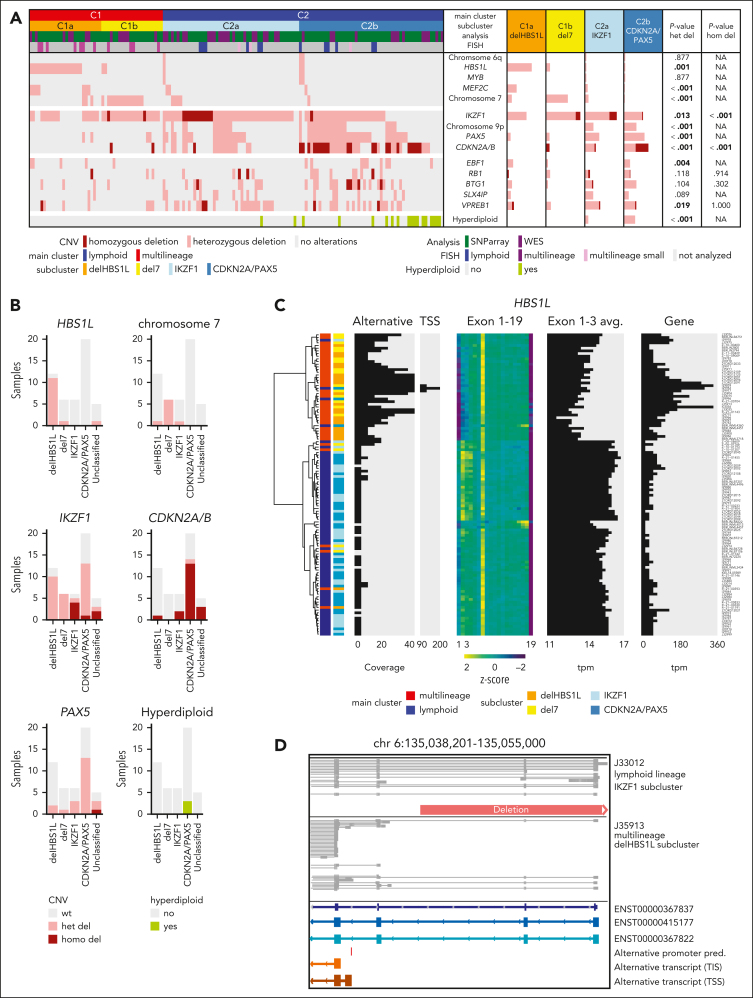
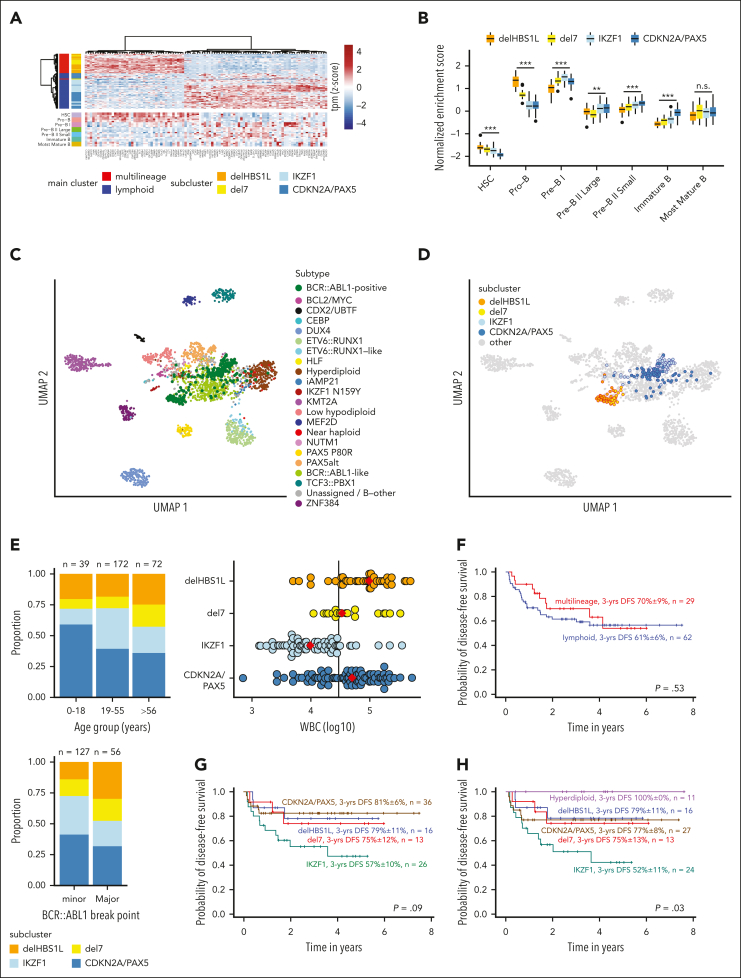
Distinct diagnostic entities within BCR::ABL1-positive acute lymphoblastic leukemia (ALL) are currently defined by the International Consensus Classification of myeloid neoplasms and acute leukemias (ICC): "lymphoid only", with BCR::ABL1 observed exclusively in lymphatic precursors, vs "multilineage", where BCR::ABL1 is also present in other hematopoietic lineages. Here, we analyzed transcriptomes of 327 BCR::ABL1-positive patients with ALL (age, 2-84 years; median, 46 years) and identified 2 main gene expression clusters reproducible across 4 independent patient cohorts. Fluorescence in situ hybridization analysis of fluorescence-activated cell-sorted hematopoietic compartments showed distinct BCR::ABL1 involvement in myeloid cells for these clusters (n = 18/18 vs n = 3/16 patients; P < .001), indicating that a multilineage or lymphoid BCR::ABL1 subtype can be inferred from gene expression. Further subclusters grouped samples according to cooperating genomic events (multilineage: HBS1L deletion or monosomy 7; lymphoid: IKZF1-/- or CDKN2A/PAX5 deletions/hyperdiploidy). A novel HSB1L transcript was highly specific for BCR::ABL1 multilineage cases independent of HBS1L genomic aberrations. Treatment on current German Multicenter Study Group for Adult ALL (GMALL) protocols resulted in comparable disease-free survival (DFS) for multilineage vs lymphoid cluster patients (3-year DFS: 70% vs 61%; P = .530; n = 91). However, the IKZF1-/- enriched lymphoid subcluster was associated with inferior DFS, whereas hyperdiploid cases showed a superior outcome. Thus, gene expression clusters define underlying developmental trajectories and distinct patterns of cooperating events in BCR::ABL1-positive ALL with prognostic relevance.


Conflict of interest statement

Conflict-of-interest disclosure: M.B. is contracted to perform research for Affimed, Amgen, and Regeneron; is a member of the advisory boards of Amgen and Incyte; and is on the speaker bureaus of Amgen, Janssen, Pfizer, and Roche. W.F. recieved personal fees and nonfinancial support from AbbVie; received grants, personal fees, and nonfinancial support from Amgen and Pfizer; received personal fees from Jazz Pharmaceuticals, Celgene, Morphosys, Ariad/Incyte, stem line therapeutics Daiichi Sankyo, Apis, Otsuka, and Servier outside the submitted work; has a patent issued for Amgen; and received support for medical writing from Amgen, Pfizer, and AbbVie. C.H. is part owner of the Munich Leukemia Laboratory. The remaining authors declare no competing financial interests.

Figures

None
Graphical abstract
Figure 1.
Figure 1.
Developmental trajectories of BCR::ABL1-positive ALL can be determined by gene expression. (A) Uniform manifold approximation and projection (UMAP) plot shows unsupervised clustering of 493 BCP-ALL patients (GMALL study group) based on 2802 genes previously established for allocation to 21 molecular disease subtypes. A total of 18 subtypes represented in this adult cohort are shown. Arrows indicate separation of BCR::ABL1-positive patients into 2 distinct clusters. (B) BCR::ABL1-positive samples from this cohort (n = 113) were reanalyzed by UMAP analysis with systematic variation of 30 setting combinations for the parameters “min_dist” and “n_neighbors” (supplemental Figure 1). Sample-to-sample distances for each setting were calculated, z-transformed, and averaged. Hierarchical clustering of the averaged distances is shown. To define the final number of clusters, the dendrogram was progressively split at each junction and the integrity of the resulting clusters was determined using machine learning (SVM linear). When the predictability (Cohen κ) of a cluster decreased below 0.8, no further cluster splitting was performed (for details, see supplemental Figure 2). This resulted in 2 main clusters (C1 and C2) with 4 subclusters (C1a, C1b, C2a, C2b), which could be reliably predicted. (C) To test whether similar clusters were present in other cohorts, 2 machine learning classifiers (1 for the 2 main clusters and 1 for the 4 subclusters) were trained on the basis of 178 and 331 LASSO genes, respectively, derived from the GMALL discovery cohort (supplemental Tables 2-6). Gene expression data from validation cohorts (Munich Leukemia Laboratry (MLL), n = 61; St. Jude Children's Research Hospital, n = 104; and Princess Margaret Cancer Centre (PMCC), n = 49) were used for hierarchical clustering together with the GMALL reference cohort after batch correction. Newly established classifiers were used for sample allocation to the 2 main and 4 subclusters (supplemental Table 1), which are shown in the annotation. (D) UMAP plots obtained from the data in panel C, showing the classifier predictions for the main clusters (left) and subclusters (right). (E) Bone marrow/peripheral blood samples at first diagnosis of ALL were fluorescence-activated cell sorted into hematopoietic compartments on cover slides and used for BCR::ABL1 fluorescence in situ hybridization (FISH) (supplemental Figure 4). Bars depict the frequency of BCR::ABL1-positive cells in the corresponding compartments: myeloid cells (CD45lowCD19CD10-CD34+/−CD13/33+), mature B cells (CD45highCD19+CD10CD20+), T cells (CD45highCD19-CD3+CD16/65), or B lymphoid precursor/ALL cells (CD45lowCD19+CD10+; in 1 case with pro-B immunophenotype, ALL cells were only identified by CD45lowCD19+). FISH signal constellations and distribution in analyzed cells are detailed in the supplemental Table 12. Note: ∗less than 100 cells analyzed, ¥less than 50 cells analyzed.
Figure 2.
Figure 2.
Cooperating genomic events define gene expression subclusters, including alternative HBS1L isoform expression in delHBS1L and del7 as novel candidate. (A) Distribution of recurrent copy number variants (CNVs) in the 4 BCR::ABL1-positive ALL subclusters. CNVs were assessed in samples with subcluster allocation (GMALL: ground truth; MLL: predictions, excluding n = 14 samples that remained "unclassified" by machine learning classifier for the 2- and/or the 4-cluster definition) by whole-genome sequencing (WGS) (n = 47) or single-nucleotide polymorphism (SNP) array (n = 102) and validated by fluorescence in situ hybridization (FISH), polymerase chain reaction (PCR), and/or multiplex ligation-dependent probe amplification (MLPA). The identified recurrent HBS1L deletion harbored the same breakpoints in all samples as identified by WGS (chr6:135,044,863-135,116,862; GRCh38hg38), including the HBS1L promoter and exon 1 to 2. Bars represent the percentage of BCR::ABL1-positive cases with a given alteration within each category. Associations between delHBS1L vs del7 vs IKZF1 vs CDKN2A/PAX5 were assessed by χ2 or Fisher exact test (P values below the significance level of 0.05 are depicted in bold). For detailed statistic please refer to supplemental Figure 5 and supplemental Appendix. (B) Subcluster-specific patterns of genomic aberrations were validated in the PMCC cohort (n = 49) using subcluster allocations obtained from a machine learning classifier trained on the GMALL cohort and the published genomic aberration profile of these samples. (C) Hierarchical clustering was performed using HBS1L alternative transcription start side expression (TSS; chr6: 135,040,344-135,040,447), HBS1L exon use, and HBS1L total gene expression in 113 GMALL samples. In addition, the average expression on HBS1L exons 1 to 3 is shown. (D) Direct long-read RNA-sequencing reads of HBS1L region between exons 1 and 4 are shown for 1 lymphoid and 1 multilineage BCR::ABL1-positive sample. The predicted alternative promoter in the intronic region between exon 3 and 4 is depicted in red. The orange bar shows the identified genomic deletion in HBS1L. A more detailed overview of the alternative HBS1L transcript and confirmation of the alternative TSS by single-cell ATAC-Seq is shown in supplemental Figures 7 and 8.)
Figure 3.
Figure 3.
Proximity to more immature lymphopoiesis stages defines multilineage BCR::ABL1-positive ALL, which has a similar outcome as lymphoid BCR::ABL1-positive ALL. (A) Differential gene expression analysis between multilineage and lymphoid BCR::ABL1-positive ALL was performed using 1-way analysis of variance (supplemental Table 7). The 100 most significantly differentially expressed genes were used for hierarchical clustering of BCR::ABL1-positive samples (upper panel). The expression heat map in the lower panel shows gene expression of the same genes in healthy B-cell progenitors. (B) ALLCatchR single-sample enrichment scores for samples from the 4 subclusters are shown using gene set definitions of normal B lymphopoiesis. (C-D) Uniform manifold approximation and projection (UMAP) plots showing gene expression data of 2567 patients with BCP-ALL, previously aggregated from 3 cohorts and including now the 2 major (C) and 4 subcluster (D) BCR::ABL1 groups. The UMAP plots are based on the 3058 genes defined for BCP-ALL subtypes and BCR::ABL1 clusters. The updated version of ALLCatchR, providing molecular subtype allocation to BCP-ALL subtypes, including the novel BCR::ABL1 clusters, is available online (https://github.com/ThomasBeder/ALLCatchR_bcrabl1). (E) The distribution of age groups (upper left), BCR::ABL1 break points (lower left), and white blood cell counts (WBC, upper right) at initial diagnosis are shown for subclusters of the aggregated data set. The solid line in the dot plot showing WBC distribution represents a WBC of 30 000/μL, and red diamonds are the medians. Corresponding data and statistical analyses are provided in supplemental Tables 1,13, and 14. (F-H) DFS recorded at a median of 3 years for 91 GMALL BCR::ABL1-positive patients treated according to GMALL protocols with dose-reduced chemotherapy induction combined with imatinib, followed by consolidation I with continuous imatinib treatment and indication for allogeneic stem cell transplantation in first complete remission is shown. Kaplan-Meier analysis was used to calculate survival probabilities, and differences were assessed by log-rank test.

Comment in

Similar articles

Cited by

References

    1. Pfeifer H, Wassmann B, Bethge W, et al. Randomized comparison of prophylactic and minimal residual disease-triggered imatinib after allogeneic stem cell transplantation for BCR–ABL1-positive acute lymphoblastic leukemia. Leukemia. 2013;27(6):1254–1262. - PubMed
    1. Ravandi F. How I treat Philadelphia chromosome–positive acute lymphoblastic leukemia. Blood. 2019;133(2):130–136. - PMC - PubMed
    1. Pfeifer H, Lang F, Fiedler W, et al. P355: favorable outcome of Philadelphia-positive acute lymphoblastic leukemia with imatinib, dose-reduced induction followed by allogeneic stem cell transplantation –results from the GMALL trial 08/13. Hemasphere. 2023;7(S3)
    1. Martinelli G, Boissel N, Chevallier P, et al. Complete hematologic and molecular response in adult patients with relapsed/refractory Philadelphia chromosome–positive B-precursor acute lymphoblastic leukemia following treatment with blinatumomab: results from a phase II, single-arm, multicenter study. J Clin Oncol. 2017;35(16):1795–1802. - PubMed
    1. Foà R, Bassan R, Vitale A, et al. Dasatinib-blinatumomab for Ph-positive acute lymphoblastic leukemia in adults. N Engl J Med. 2020;383(17):1613–1623. - PubMed

Publication types

Substances