

SparsePro: An efficient fine-mapping method integrating summary statistics and functional annotations
- PMID: 38153934
- PMCID: PMC10781022
- DOI: 10.1371/journal.pgen.1011104
SparsePro: An efficient fine-mapping method integrating summary statistics and functional annotations
Abstract
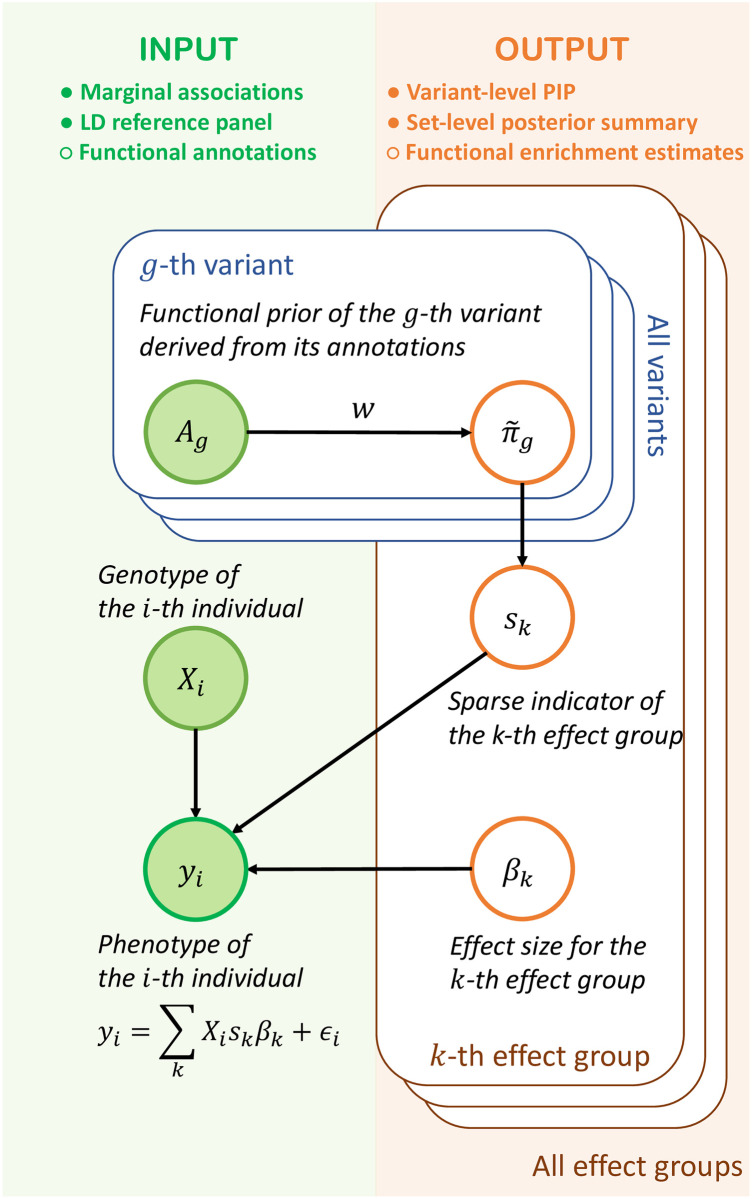
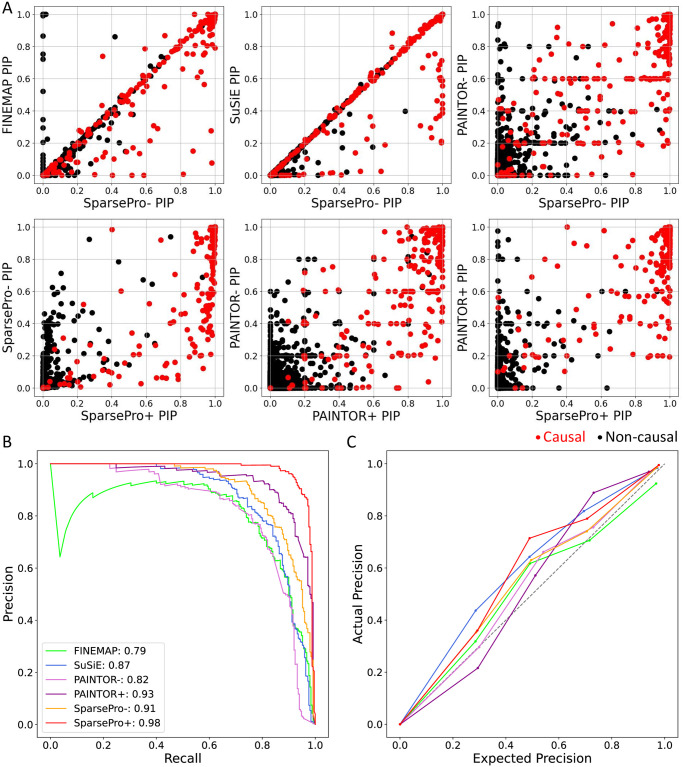
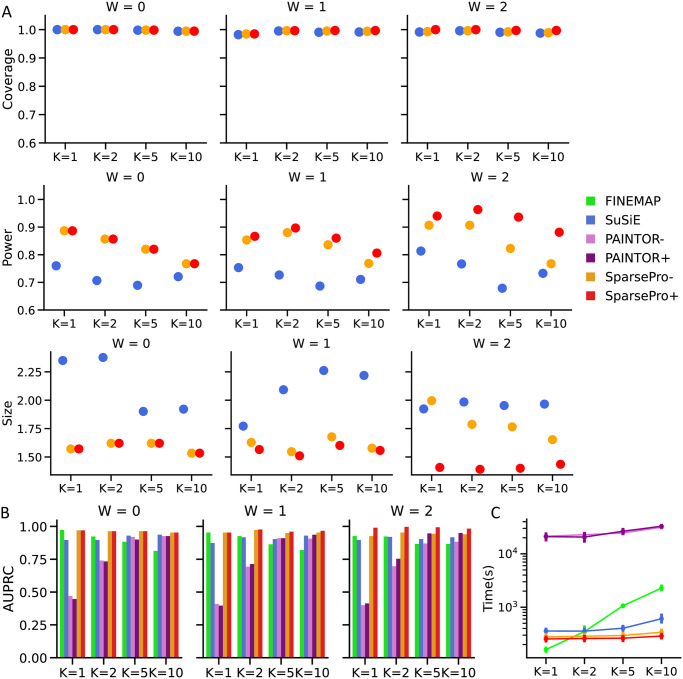
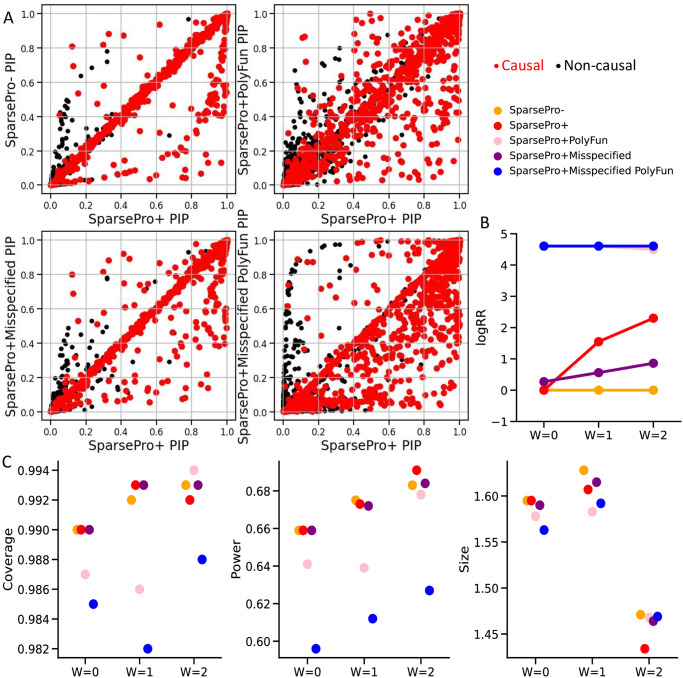
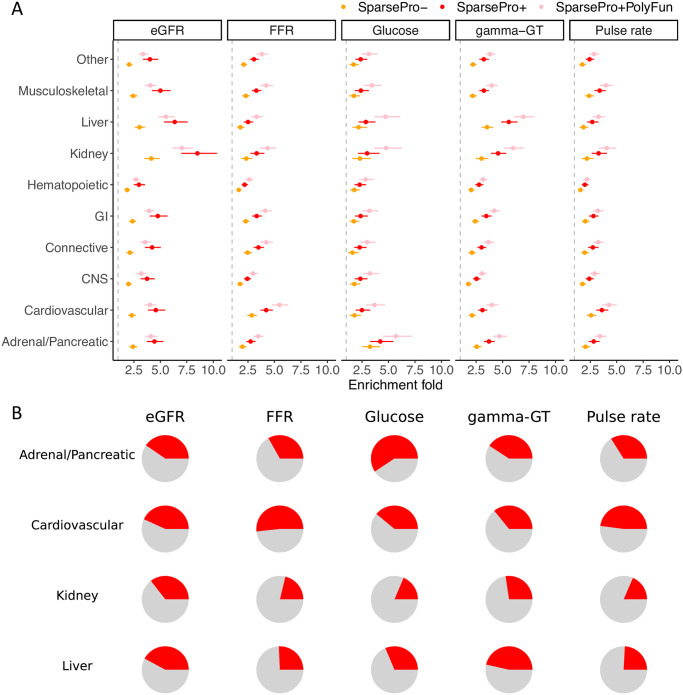
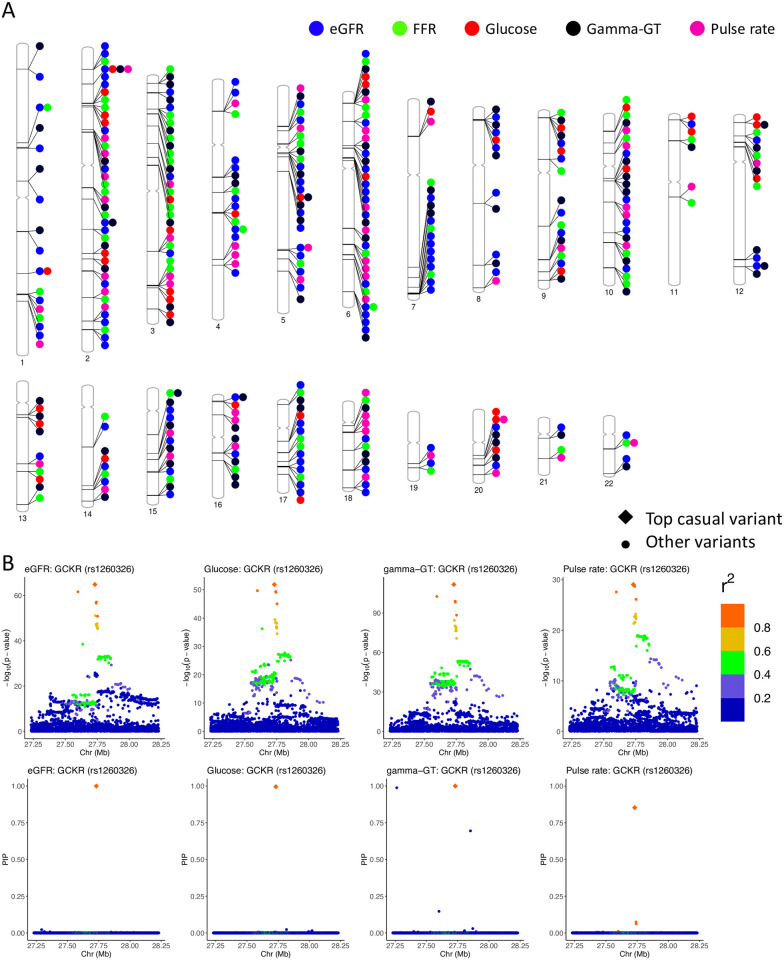
Identifying causal variants from genome-wide association studies (GWAS) is challenging due to widespread linkage disequilibrium (LD) and the possible existence of multiple causal variants in the same genomic locus. Functional annotations of the genome may help to prioritize variants that are biologically relevant and thus improve fine-mapping of GWAS results. Classical fine-mapping methods conducting an exhaustive search of variant-level causal configurations have a high computational cost, especially when the underlying genetic architecture and LD patterns are complex. SuSiE provided an iterative Bayesian stepwise selection algorithm for efficient fine-mapping. In this work, we build connections between SuSiE and a paired mean field variational inference algorithm through the implementation of a sparse projection, and propose effective strategies for estimating hyperparameters and summarizing posterior probabilities. Moreover, we incorporate functional annotations into fine-mapping by jointly estimating enrichment weights to derive functionally-informed priors. We evaluate the performance of SparsePro through extensive simulations using resources from the UK Biobank. Compared to state-of-the-art methods, SparsePro achieved improved power for fine-mapping with reduced computation time. We demonstrate the utility of SparsePro through fine-mapping of five functional biomarkers of clinically relevant phenotypes. In summary, we have developed an efficient fine-mapping method for integrating summary statistics and functional annotations. Our method can have wide utility in understanding the genetics of complex traits and increasing the yield of functional follow-up studies of GWAS. SparsePro software is available on GitHub at https://github.com/zhwm/SparsePro.
Copyright: © 2023 Zhang et al. This is an open access article distributed under the terms of the Creative Commons Attribution License, which permits unrestricted use, distribution, and reproduction in any medium, provided the original author and source are credited.
Conflict of interest statement
The authors have declared that no competing interests exist.
Figures
Similar articles
-
Funmap: integrating high-dimensional functional annotations to improve fine-mapping.Bioinformatics. 2024 Dec 26;41(1):btaf017. doi: 10.1093/bioinformatics/btaf017. Bioinformatics. 2024. PMID: 39799513 Free PMC article.
-
Genetic fine-mapping from summary data using a nonlocal prior improves the detection of multiple causal variants.Bioinformatics. 2023 Jul 1;39(7):btad396. doi: 10.1093/bioinformatics/btad396. Bioinformatics. 2023. PMID: 37348543 Free PMC article.
-
SharePro: an accurate and efficient genetic colocalization method accounting for multiple causal signals.Bioinformatics. 2024 May 2;40(5):btae295. doi: 10.1093/bioinformatics/btae295. Bioinformatics. 2024. PMID: 38688586 Free PMC article.
-
Methods for statistical fine-mapping and their applications to auto-immune diseases.Semin Immunopathol. 2022 Jan;44(1):101-113. doi: 10.1007/s00281-021-00902-8. Epub 2022 Jan 18. Semin Immunopathol. 2022. PMID: 35041074 Free PMC article. Review.
-
From genome-wide associations to candidate causal variants by statistical fine-mapping.Nat Rev Genet. 2018 Aug;19(8):491-504. doi: 10.1038/s41576-018-0016-z. Nat Rev Genet. 2018. PMID: 29844615 Free PMC article. Review.
Cited by
-
Fast and accurate Bayesian polygenic risk modeling with variational inference.Am J Hum Genet. 2023 May 4;110(5):741-761. doi: 10.1016/j.ajhg.2023.03.009. Epub 2023 Apr 7. Am J Hum Genet. 2023. PMID: 37030289 Free PMC article.
-
MESuSiE enables scalable and powerful multi-ancestry fine-mapping of causal variants in genome-wide association studies.Nat Genet. 2024 Jan;56(1):170-179. doi: 10.1038/s41588-023-01604-7. Epub 2024 Jan 2. Nat Genet. 2024. PMID: 38168930 Free PMC article.
-
Accounting for genetic effect heterogeneity in fine-mapping and improving power to detect gene-environment interactions with SharePro.Nat Commun. 2024 Oct 30;15(1):9374. doi: 10.1038/s41467-024-53818-w. Nat Commun. 2024. PMID: 39478020 Free PMC article.
-
Integration of Expression QTLs with fine mapping via SuSiE.medRxiv [Preprint]. 2023 Oct 6:2023.10.03.23294486. doi: 10.1101/2023.10.03.23294486. medRxiv. 2023. Update in: PLoS Genet. 2024 Jan 25;20(1):e1010929. doi: 10.1371/journal.pgen.1010929. PMID: 37873337 Free PMC article. Updated. Preprint.
-
Integration of expression QTLs with fine mapping via SuSiE.PLoS Genet. 2024 Jan 25;20(1):e1010929. doi: 10.1371/journal.pgen.1010929. eCollection 2024 Jan. PLoS Genet. 2024. PMID: 38271473 Free PMC article.
References
MeSH terms
LinkOut - more resources
Full Text Sources
Research Materials
