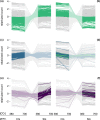
Oligosaccharide production and signaling correlate with delayed flowering in an Arabidopsis genotype grown and selected in high [CO2]
- PMID: 38153952
- PMCID: PMC10754469
- DOI: 10.1371/journal.pone.0287943
Oligosaccharide production and signaling correlate with delayed flowering in an Arabidopsis genotype grown and selected in high [CO2]
Abstract
Since industrialization began, atmospheric CO2 ([CO2]) has increased from 270 to 415 ppm and is projected to reach 800-1000 ppm this century. Some Arabidopsis thaliana (Arabidopsis) genotypes delayed flowering in elevated [CO2] relative to current [CO2], while others showed no change or accelerations. To predict genotype-specific flowering behaviors, we must understand the mechanisms driving flowering response to rising [CO2]. [CO2] changes alter photosynthesis and carbohydrates in plants. Plants sense carbohydrate levels, and exogenous carbohydrate application influences flowering time and flowering transcript levels. We asked how organismal changes in carbohydrates and transcription correlate with changes in flowering time under elevated [CO2]. We used a genotype (SG) of Arabidopsis that was selected for high fitness at elevated [CO2] (700 ppm). SG delays flowering under elevated [CO2] (700 ppm) relative to current [CO2] (400 ppm). We compared SG to a closely related control genotype (CG) that shows no [CO2]-induced flowering change. We compared metabolomic and transcriptomic profiles in these genotypes at current and elevated [CO2] to assess correlations with flowering in these conditions. While both genotypes altered carbohydrates in response to elevated [CO2], SG had higher levels of sucrose than CG and showed a stronger increase in glucose and fructose in elevated [CO2]. Both genotypes demonstrated transcriptional changes, with CG increasing genes related to fructose 1,6-bisphosphate breakdown, amino acid synthesis, and secondary metabolites; and SG decreasing genes related to starch and sugar metabolism, but increasing genes involved in oligosaccharide production and sugar modifications. Genes associated with flowering regulation within the photoperiod, vernalization, and meristem identity pathways were altered in these genotypes. Elevated [CO2] may alter carbohydrates to influence transcription in both genotypes and delayed flowering in SG. Changes in the oligosaccharide pool may contribute to delayed flowering in SG. This work extends the literature exploring genotypic-specific flowering responses to elevated [CO2].
Copyright: This is an open access article, free of all copyright, and may be freely reproduced, distributed, transmitted, modified, built upon, or otherwise used by anyone for any lawful purpose. The work is made available under the Creative Commons CC0 public domain dedication.
Conflict of interest statement
The authors have declared that no competing interests exist.
Figures


Similar articles
-
Elevated CO2 influences the expression of floral-initiation genes in Arabidopsis thaliana.New Phytol. 2008;178(1):63-67. doi: 10.1111/j.1469-8137.2008.02387.x. New Phytol. 2008. PMID: 18315697
-
FLOWERING LOCUS C drives delayed flowering in Arabidopsis grown and selected at elevated CO 2.bioRxiv [Preprint]. 2023 Jun 15:2023.06.15.545149. doi: 10.1101/2023.06.15.545149. bioRxiv. 2023. PMID: 37398485 Free PMC article. Preprint.
-
Identification of a major QTL that alters flowering time at elevated [CO(2)] in Arabidopsis thaliana.PLoS One. 2012;7(11):e49028. doi: 10.1371/journal.pone.0049028. Epub 2012 Nov 21. PLoS One. 2012. PMID: 23185291 Free PMC article.
-
Flowering time and elevated atmospheric CO2.New Phytol. 2007;176(2):243-255. doi: 10.1111/j.1469-8137.2007.02196.x. Epub 2007 Aug 23. New Phytol. 2007. PMID: 17822407 Review.
-
Implications of High Temperature and Elevated CO2 on Flowering Time in Plants.Front Plant Sci. 2016 Jun 27;7:913. doi: 10.3389/fpls.2016.00913. eCollection 2016. Front Plant Sci. 2016. PMID: 27446143 Free PMC article. Review.
References
-
- Masson-Delmotte V, Zhai P, Pirani A, Connors SL, Péan C, Berger S, et al. Climate Change 2021: The Physical Science Basis. Contribution of Working Group I to the Sixth Assessment Report of the Intergovernmental Panel on Climate Change. Cambridge University Press; 2021.
-
- Schmidt NM, Mosbacher JB, Nielsen PS, Rasmussen C, Høye TT, Roslin T. An ecological function in crisis? The temporal overlap between plant flowering and pollinator function shrinks as the Arctic warms. Ecography. 2016;39(12):1250–2.
-
- Forrest JRK. Plant–pollinator interactions and phenological change: what can we learn about climate impacts from experiments and observations? Oikos. 2015;124(1):4–13.
MeSH terms
Substances
Grants and funding
LinkOut - more resources
Full Text Sources

