. 2024 May;166(5):842-858.e5.
doi: 10.1053/j.gastro.2023.12.018. Epub 2023 Dec 27.

Cancer-Associated Fibroblast Induces Acinar-to-Ductal Cell Transdifferentiation and Pancreatic Cancer Initiation Via LAMA5/ITGA4 Axis

Affiliations

Cancer-Associated Fibroblast Induces Acinar-to-Ductal Cell Transdifferentiation and Pancreatic Cancer Initiation Via LAMA5/ITGA4 Axis

Seema Parte et al. Gastroenterology. 2024 May.

Abstract

Background & aims: Pancreatic ductal adenocarcinoma (PDAC) is characterized by desmoplastic stroma surrounding most tumors. Activated stromal fibroblasts, namely cancer-associated fibroblasts (CAFs), play a major role in PDAC progression. We analyzed whether CAFs influence acinar cells and impact PDAC initiation, that is, acinar-to-ductal metaplasia (ADM). ADM connection with PDAC pathophysiology is indicated, but not yet established. We hypothesized that CAF secretome might play a significant role in ADM in PDAC initiation.

Methods: Mouse and human acinar cell organoids, acinar cells cocultured with CAFs and exposed to CAF-conditioned media, acinar cell explants, and CAF cocultures were examined by means of quantitative reverse transcription polymerase chain reaction, RNA sequencing, immunoblotting, and confocal microscopy. Data from liquid chromatography with tandem mass spectrometry analysis of CAF-conditioned medium and RNA sequencing data of acinar cells post-conditioned medium exposure were integrated using bioinformatics tools to identify the molecular mechanism for CAF-induced ADM. Using confocal microscopy, immunoblotting, and quantitative reverse transcription polymerase chain reaction analysis, we validated the depletion of a key signaling axis in the cell line, acinar explant coculture, and mouse cancer-associated fibroblasts (mCAFs).

Results: A close association of acino-ductal markers (Ulex europaeus agglutinin 1, amylase, cytokeratin-19) and mCAFs (α-smooth muscle actin) in LSL-KrasG12D/+; LSL-Trp53R172H/+; Pdx1Cre (KPC) and LSL-KrasG12D/+; Pdx1Cre (KC) autochthonous progression tumor tissue was observed. Caerulein treatment-induced mCAFs increased cytokeratin-19 and decreased amylase in wild-type and KC pancreas. Likewise, acinar-mCAF cocultures revealed the induction of ductal transdifferentiation in cell line, acinar-organoid, and explant coculture formats in WT and KC mice pancreas. Proteomic and transcriptomic data integration revealed a novel laminin α5/integrinα4/stat3 axis responsible for CAF-mediated acinar-to-ductal cell transdifferentiation.

Conclusions: Results collectively suggest the first evidence for CAF-influenced acino-ductal phenotypic switchover, thus highlighting the tumor microenvironment role in pancreatic carcinogenesis inception.

Keywords: Acinar–Ductal Metaplasia; Pre-Neoplastic Pancreatic Lesions; Stroma Secretome.


Conflict of interest statement

COMPETING INTERESTS

SKB is one of the co-founders of Sanguine Diagnostics and Therapeutics, Inc. The other authors declare no competing interests.

Figures

Figure 1:
Figure 1:. KC and KPC tumor tissues reveal temporal association of α-SMA and acino-ductal markers during tumor progression.
IF staining for acinar lectin UEA1, ductal specific CK19/KRT19, and CAF specific α-SMA/ACTA2 on FFPE sections of (A) KC, (B) KPC tumor sections at various stages of disease progression, compared to (C) WT normal pancreatic tissue sections stained similarly, 2.5D IP are indicated and (D, E) H & E-stained micrographs of KC and KPC FFPE sections reveal coherent acino-ductal structures during tumor progression. (F-G) Mean fluorescence intensity (MFI) was plotted. DAPI = nuclear counterstain. Scale bars=20 μm. Data, mean±SD, n=3 replicates. P-values calculated by two-tailed unpaired Student’s t-test, *p<0.01. (H) AMY, CK19, α-SMA IF staining of human TMA across different stages. (I-K) TNMplot database analysis for expression of AMY, CK19 and α-SMA reveal a differential expression pattern in normal versus tumor. Mann–Whitney U test was applied to calculate p value ***p<0.001. wks:weeks; T:tumor; TMA:Tumor microarray; CP: chronic pancreatitis; PanIN: Pancreatic intraepithelial neoplasm, IP: Intensity plot.
Figure 2:
Figure 2:. α-SMA+ CAF induction and differential expression of acino-ductal markers in Caerulein-treated mice tumor model.
(A) IF staining for AMY, CK19, α-SMA on FFPE tumor sections from KC mice treated with caerulein for 2 days and recovery post 7 days compared to WT normal pancreas treated similarly reveal specific expression pattern. 2.5D IP are indicated. (B, C) MFI reveals data, mean ± SD, n=3 replicates. DAPI = nuclear counterstain. p-values were calculated by one-way ANOVA (multiple comparisons), *p<0.05, **p<0.01, ***p<0.001, ****p<0.0001. (D) Representation of caerulein treatment regimen administered to mice (WT and KC) at 75ug/kg/body weight/mice. (E-G) qRT-PCR analysis for acino-ductal markers WT, WT-Cer; WT, KC; KC, KC-Cer tissues. Data, mean ± SD, n= indicated in the figure and analyzed by two-tailed unpaired Student’s t-test, *p<0.01, ****p<0.0001. Scale bars=20 μm. Con: Control; Cer: Caerulein treated mice; D0, D1, D2, D7: Day 0, 1, 2, 7; 2D: 2days, 7D: 7 days; IP: Intensity plot.
Figure 3:
Figure 3:. mCAFs and pancreatic acinar cell cocultures demonstrate acino-ductal transdifferentiation in organoid cultures.
(A) Schematic for developing acinar cell organoids and mCAF cocultures. (B) Mouse pancreatic acinar cell derived organoid model with only acinar cells (control) and with mCAFs as admixture of both cell types (Mix) and mCAFs cocultured at acinar cell periphery + Matrigel [MG] dome (Edge) post five days of culture. Scale bar=100μm. (C) Human fine needle (FNA) aspirate samples in the absence and presence of hCAFs coculture, (D, E) Object count by Incucyte® live cell imaging for acinar organoid cultures in the absence and presence of mCAFs from 9 weeks old WT and KC mice for five days in culture. Data, mean ± SD; n = 3, ***p<0.001 (F) Organoids per field were quantified in control and coculture (hCAF+) groups, with mean ± SD; n=6 replicates, **p<0.01, analyzed by two-tailed unpaired Student’s t-test. AMY, CK19, α-SMA expression and histoarchitecture in the control group and CAF cocultures in WT and KC mouse samples in (G, H) whole mount and (K, L) in mouse and human FFPE sections. (I, J, M) MFI reveals data, mean ± SD, n=3 replicates. DAPI = nuclear counterstain. IF staining for acino-ductal markers in Human FNA cells in control and hCAF+ cocultures was observed in both FFPE and whole mount formats. p-values were calculated by two-tailed unpaired Student’s t-test, *p<0.05, **p<0.01, ****p<0.0001, ***p<0.001. (N) Mice whole mount organoid structures expressing acino-ductal markers (AMY, CK19) in close association with (α-SMA+) mCAFs suggesting possible cell-cell crosstalk. Scale bars=10 μm, 20 μm as indicated. Magnification=40X in B,C, zoomed in C.
Figure 4:
Figure 4:. 266.6 cells and mCAF direct and indirect cocultures reflect ductal cell-specific signatures.
(A) Mouse acinar cell line (266.6) cocultured with mCAFs for 5 days revealed changed morphology (blue circles) (B, C) IF staining for acino-ductal (AMY/CK19/α-SMA) markers was detected in cocultures with mCAFs and imPSCs. (D) qRT-PCR analysis of 266.6 cells exposed to mCAF-CM versus untreated control for ~40 days reveals differential expression of acino-ductal cell-specific mRNA transcripts represented in heatmap. (E) Immunoblot analysis of 266.6 cells treated with mCAF-CM versus untreated control at different time points for 40 days reflects differential protein expression signatures corresponding to qRT-PCR data.
Figure 5:
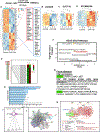
Figure 5:. In silico data integration by connectivity mapping for RNAseq and LC-MS/MS analysis reveals a novel signaling axis.
RNA-seq analysis of 266.6 cells exposed to mCAF-CM revealed differential gene expression of the novel (A) ADM-specific genes, (B) Acinar (Amylase, Rbpjl, Cela1, etc.) and (C) Ductal cell-specific genes (Hnf1a, Onecut1, Hes1, Sox9, etc.) and (D) Stemness related genes (Bmi1, Ctnnb1, Foxp1, GSK3-β, Sox9, Itga4, Stat3 etc). (E) Heatmap of top protein hits detected in mCAF-CM/secretome. (F, G) Genes/proteins list associated with RNA-seq data of 266.6 cells exposed to mCAF-CM and LC-MS/MS data were analyzed by in silico data integration and enrichment of a KEGG 2022 term focal adhesion. (H, I) Panther 2016 and IPA analysis showed elevated INTEGRIN and STAT3 signaling. (J) STRING software analysis showed an interaction between laminin subunit alpha 5 (LAMA5) and Integrin alpha 4 (ITGA4) (red and blue squares, respectively). (K) Schematic representation of putative strategies for mCAF-CM mediated ADM. kd: knockdown.
Figure 6:
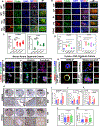
Figure 6:. In vitro and in vivo models reveal co-expression of LAMA5 and ITGA4 and novel biological significance in ADM.
IF staining analysis of LAMA5 and ITGA4 in (A) Caerulein-treated WT and KC pancreatic tissues/tumors. (Epithelial cell staining is visible in inset.) (B) Human tissue microarray. (C, D) MFI reveals data, mean ± SD, n=3, 4 independent sections. DAPI = nuclear counterstain. Co-immunolocalization of LAMA5 and ITGA4 in acinar cell-derived organoids from WT and KC mice pancreas/pancreatic tumors at the end of (E) 24 hours and (F) 5 days in culture in the absence and presence of mCAFs in WT and KC by whole mount IF staining and similar in (G) Human FNA derived acinar organoids in FFPE section and whole mount formats both cultured in absence and presence of hCAFs. (H) Immunohistochemical localization of LAMA5 and ITGA4 in patient TMA sections at different stages, magnification=4x, 20x as indicated, CP: chronic pancreatitis; P1, P2: PanIN1, 2 lesions; PDAC: pancreatic ductal adenocarcinoma. MFI reveals data, mean ± SD, for (I, J) WT, KC and, (K) Human FNA organoid co-cultures. n=3, DAPI = nuclear counterstain. (L, M) Histoscore is represented as histograms n=30 in LAMA5 and n=14,13,7 in ITGA4. (C,D, I-M) p value is significant at *p<0.05, **p<0.01, ***p<0.001, ****p<0.0001 by two-tailed unpaired Student’s t-test. Scale bars=20 μm
Figure 7:
Figure 7:. Itga4 and Lama5 knockdown in acinar cells and mCAFs delineates Laminin alpha 5/Integrin alpha 4/Stat3 signaling axis for mCAF-CM/secretome mediated acino-ductal trans-differentiation.
Knockdown of (A-C) Acinar-specific Itga4 and (D-F) mCAF-specific Lama5 were confirmed by immunoblotting, qRT-PCR and IF staining. Statistical significance was calculated by two-tailed unpaired Student’s t-test, ***p<0.001, ****p<0.0001 (G)IF staining showing differential expression of AMY, CK19, SOX9 and ITGA4 in 266.6 cells treated with mCAF-CM, scr-Lama5 mCAF-CM and siRNA-Lama5 mCAF-CM (H)CK19 immunoblotting for 266.6 cells treated with scr-Lama5 mCAF-CM and siRNA-Lama5 mCAF-CM. Differential expression of (I) AMY, CK19 and (J) LAMA5/ITGA4 in acinar cells (266.6) treated with scr-Lama5 mCAF-CM and siRNA-Lama5 mCAF-CM with simultaneous knockdown of Itga4 analyzed by IF staining. Acinar cell explants from WT and KC pancreas/tumors were cocultured with mCAFs with simultaneous knockdown of Itga4 in 3D collagen culture and assessed by IF for co-expression of (M)AMY/CK19 and (N)LAMA5/ITGA4 with DAPI as nuclear counterstain. Scale bars=20 μm. (K, L, O, P)MFI reveals data, mean ± SD, n=3 replicates. p-values were calculated by one-way ANOVA (multiple comparisons), *p<0.05, **p<0.01, ***p<0.001, ****p<0.0001.

References

    1. Rahib L, Smith BD, Aizenberg R, et al. Projecting cancer incidence and deaths to 2030: the unexpected burden of thyroid, liver, and pancreas cancers in the United States. Cancer Res 2014;74:2913–21. - PubMed
    1. Siegel RL, Miller KD, Wagle NS, et al. Cancer statistics, 2023. CA Cancer J Clin 2023;73:17–48. - PubMed
    1. De La OJ, Emerson LL, Goodman JL, et al. Notch and Kras reprogram pancreatic acinar cells to ductal intraepithelial neoplasia. Proc Natl Acad Sci U S A 2008;105:18907–12. - PMC - PubMed
    1. Habbe N, Shi G, Meguid RA, et al. Spontaneous induction of murine pancreatic intraepithelial neoplasia (mPanIN) by acinar cell targeting of oncogenic Kras in adult mice. Proc Natl Acad Sci U S A 2008;105:18913–8. - PMC - PubMed
    1. Kopp JL, von Figura G, Mayes E, et al. Identification of Sox9-dependent acinar-to-ductal reprogramming as the principal mechanism for initiation of pancreatic ductal adenocarcinoma. Cancer Cell 2012;22:737–50. - PMC - PubMed

Publication types

MeSH terms