. 2023 Dec 28;13(1):23086.
doi: 10.1038/s41598-023-49611-2.

Comparative analysis of methods to reduce activation signature gene expression in PBMCs

Affiliations

Comparative analysis of methods to reduce activation signature gene expression in PBMCs

Lovatiana Andriamboavonjy et al. Sci Rep. .

Abstract

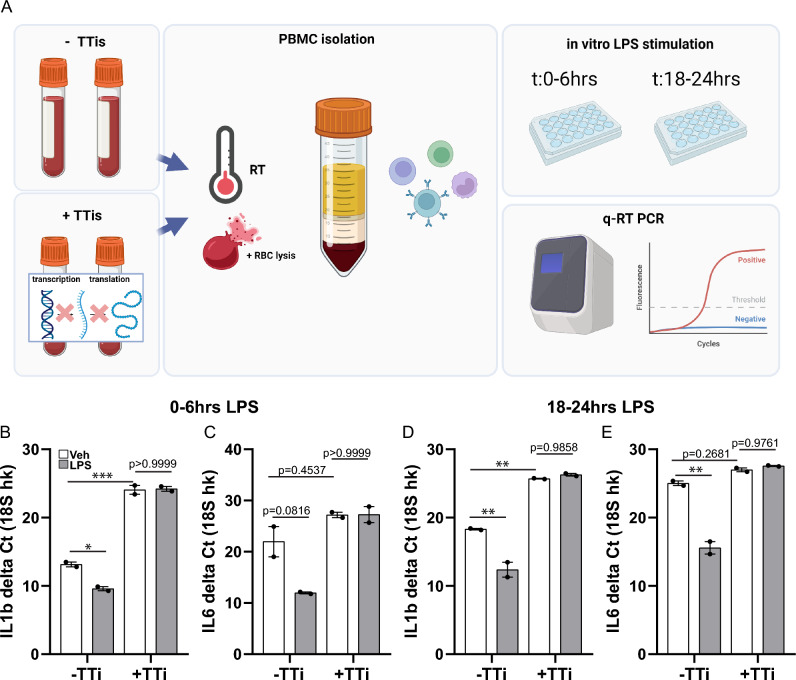
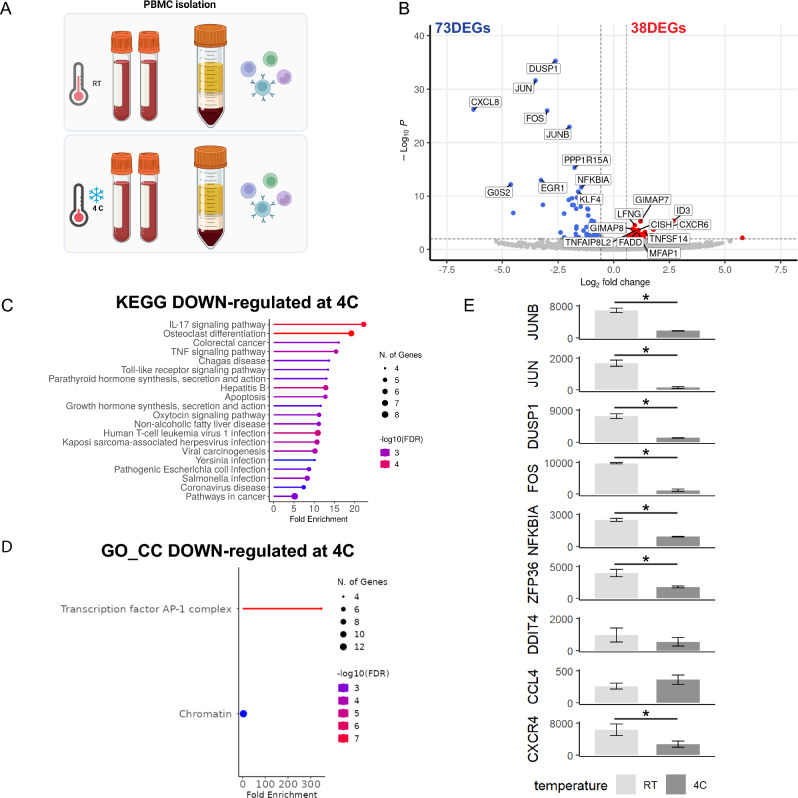
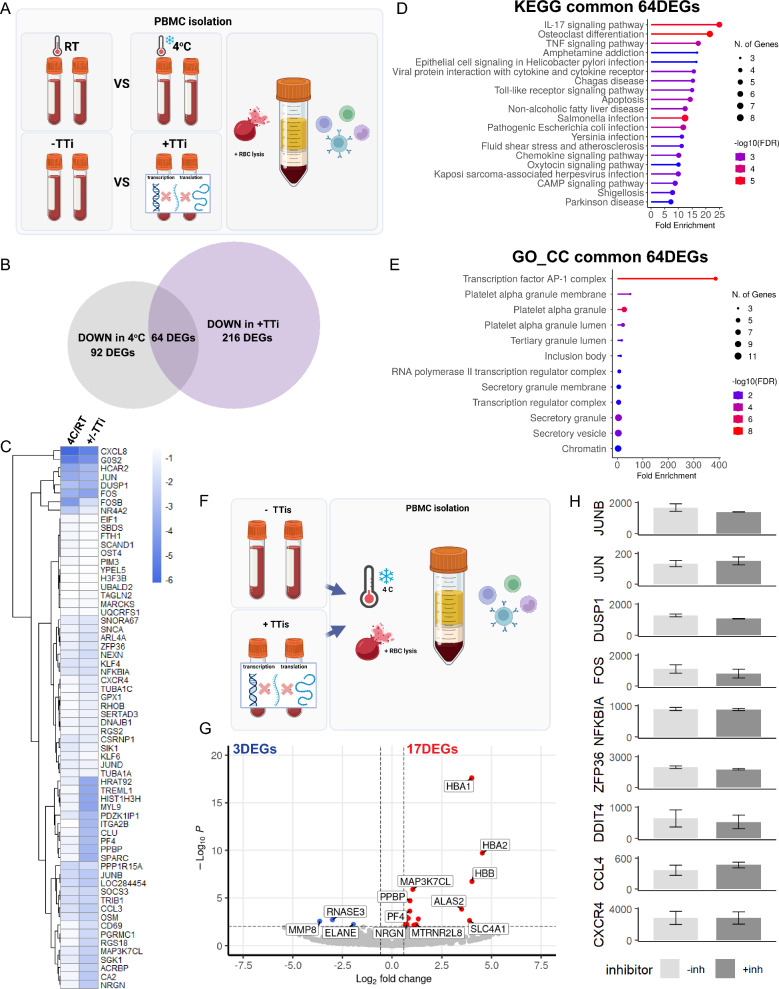
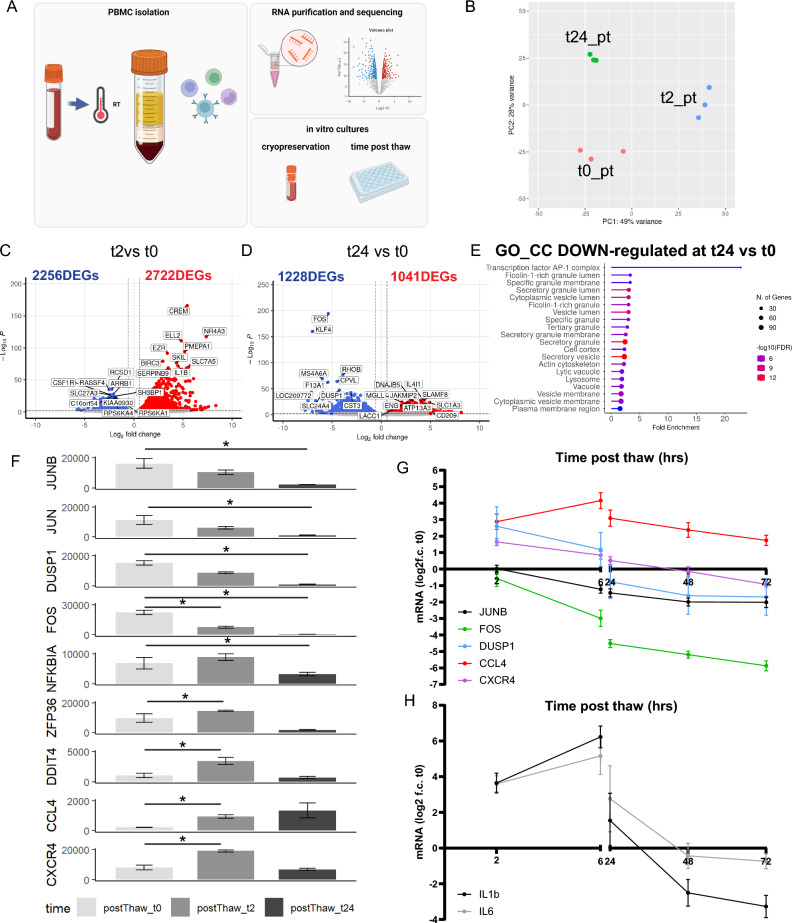
Preserving the in vivo cell transcriptome is essential for accurate profiling, yet factors during cell isolation including time ex vivo and temperature induce artifactual gene expression, particularly in stress-responsive immune cells. In this study, we investigated two methods to mitigate ex vivo activation signature gene (ASG) expression in peripheral blood mononuclear cells (PBMCs): transcription and translation inhibitors (TTis) and cold temperatures during isolation. Comparative analysis of PBMCs isolated with TTis revealed reduced ASG expression. However, TTi treatment impaired responsiveness to LPS stimulation in subsequent in vitro experiments. In contrast, cold isolation methods also prevented ASG expression; up to a point where the addition of TTis during cold isolation offered minimal additional advantage. These findings highlight the importance of considering the advantages and drawbacks of different isolation methods to ensure accurate interpretation of PBMC transcriptomic profiles.


Conflict of interest statement

The authors declare no competing interests.

Figures

Figure 1
Figure 1
Transcription and translation inhibitors reduce activation signature genes. (A) Schematic of the experimental plan comparing the transcriptomic signatures from PBMCs isolated using a traditional protocol and PBMCs treated with and without a TTi cocktail (n = 2/condition). (B) Volcano plot of 293 DEGs identified in the TTi-treated PBMCs compared to the traditional protocol. (C) Enrichment analysis of the 280 down-regulated DEGs revealed enrichment in KEGG pathways related to cell contact, apoptosis, and inflammatory IL-17 signaling. (D) Gene ontology (GO) enrichment analysis for cellular compartment (CC) showed strong clustering of AP-1 complex genes (FOS, JUNB, and JUN) and genes involved in multiple cytoskeleton-related pathways. (E) Bar graphs of the activation signature gene (ASG) set identified by Marsh et al. Error bars represent mean ± SEM. Significance was set at p-value < 0.01 and an absolute log2FoldChange value of 0.58 (1.5-fold). Refer to Table S1 for raw transcriptomic data and Table S2 for complete DEG lists.
Figure 2
Figure 2
PBMCs treated with TTis during the isolation protocol no longer respond to stimuli in vitro. (A) Schematic of the experimental plan where PBMCs isolated with and without TTis were subjected to LPS stimulation for 6 h either immediately after isolation or 18 h post-isolation (n = 2/condition). (B) Gene expression analysis of IL1β in PBMCs showed a significant increase in cells not exposed to TTi when treated with LPS at 0 h post-treatment (p = 0.0256, 2-way ANOVA Sidak's post hoc), while no significant increase was observed in cells treated with TTi (p > 0.9999, 2-way ANOVA Sidak's post hoc). (C) Gene expression analysis of IL6 in PBMCs exhibited a trend towards increased expression in cells not exposed to TTi (p = 0.0816, 2-way ANOVA Sidak's post hoc) when treated with LPS at 0 h post-treatment, whereas no significant increase was observed in cells treated with TTi (p > 0.9999, 2-way ANOVA Sidak's post hoc). (D) Gene expression analysis of IL1b in PBMCs exhibited increased expression in cells not exposed to TTi (p = 0.0043, 2-way ANOVA Sidak's post hoc) when LPS stimulation was performed 18 h after TTi treatment, no significant increase was observed in cells treated with TTi (p = 0.9858, 2-way ANOVA Sidak's post hoc). (E) Gene expression analysis of IL6 in PBMCs exhibited increased expression in cells not exposed to TTi (p = 0.0011, 2-way ANOVA Sidak's post hoc) when LPS stimulation was performed 18 h after TTi treatment, no significant increase was observed in cells treated with TTi (p = 0.9761, 2-way ANOVA Sidak's post hoc). Error bars represent mean ± SEM. Significance was set at p-value < 0.05.
Figure 3
Figure 3
PBMCs processed cold compared to RT show down-regulation of activation signature genes. (A) Schematic of the experimental plan where PBMCs were isolated using a traditional protocol at either cold or room temperature (RT) (n = 2/condition). (B) Volcano plot of RNA sequencing analysis revealing a total of 111 DEGs, with 38 up-regulated DEGs and 73 down-regulated DEGs in PBMCs isolated cold compared to RT. (C) KEGG pathway analysis of the down-regulated DEGs revealed enrichment in immune-related processes. (D) Gene ontology (GO) cellular compartment (CC) analysis demonstrated a significant enrichment of AP-1-stimulated pathway genes, including JUNB, JUN, and FOS (D). (E) Bar graphs of the activation signature gene (ASG) set identified by Marsh et al. Error bars represent mean ± SEM. Significance was set at p-value < 0.01 and an absolute log2FoldChange value of 0.58 (1.5-fold). Refer to Table S1 for raw transcriptomic data and Table S2 for complete DEG lists.
Figure 4
Figure 4
Transcription and translation inhibitors offer little transcriptomic advantage when a cold PBMC isolation protocol is used. (A) Schematic of the experimental steps to compare the degree of transcriptomic similarity between PBMCs isolated cold and those processed with TTi (n = 2/condition). (B) Venn analysis of the differentially expressed genes (DEGs) decreased by cold processing and those decreased by the addition of TTi revealed 64 shared DEGs between both methods. (C) Heatmap of log2FC for shared DEGs decreased by cold processing or the addition of TTis. (D) KEGG pathway analysis of the shared DEGs predominantly identified immune-related pathways. (E) Gene ontology (GO) cellular compartment (CC) analysis revealed significant enrichment for AP-1 complex genes (JUN, JUNB, FOS) and other relevant compartments. (F) Schematic of experiment conducted where TTi inhibitors were added, and cells were kept cold during the isolation protocol. (G) Volcano plot of DEGs when TTis are added to cold cell isolation showing 3 down-regulated and 17 up-regulated. (H) Bar graphs of the activation signature gene (ASG) set identified by Marsh et al. Error bars represent mean ± SEM. Significance was set at p-value < 0.01 and an absolute log2FoldChange value of 0.58 (1.5-fold). Refer to Table S1 for raw transcriptomic data and Table S2 for complete DEG lists.
Figure 5
Figure 5
Cultured PBMCs show increased activation post thaw that dampens with time in vitro. (A) Schematic of the experimental plan for time post thaw analysis of cryopreserved PBMCs. (B) Principal component analysis revealed global transcriptomic differences among the three time points (n = 3/condition). (C) Volcano plots of transcriptomic differences between 0 pt (t0pt) and 2 pt (t2pt) showing 4978 DEGs, with 2256 down-regulated and 2722 up-regulated. (D) Volcano plots of transcriptomic differences identified between t0pt and 24 pt (t24pt), with a total of 2269 DEGs (1228 down-regulated, 1041 up-regulated). (E) Gene ontology (GO) enrichment analysis of the down-regulated DEGs between t24pt and t0pt showed enrichment for AP-1 complex genes (JUN, JUNB, JUND, and FOS), along with vesicular trafficking-related compartments. (F) Bar graphs of the activation signature gene (ASG) set identified by Marsh et al. (G) Plot showing changes over time post thaw in mRNA expression of ASGs (JUNB, FOS, DUSP1, CCL4, and CXCR4) relative to their expression at t0pt (n = 5/condition). (H) Plot showing changes over time post thaw in mRNA expression of immune genes (IL1b and IL6) relative to their expression at t0pt (n = 5/condition). Error bars represent mean ± SEM. Significance was set at p-value < 0.01 and an absolute log2FoldChange value of 0.58 (1.5-fold). Refer to Table S1 for raw transcriptomic data and Table S2 for complete DEG lists.

Similar articles

Cited by

References

    1. Barnes MG, Grom AA, Griffin TA, Colbert RA, Thompson SD. Gene expression profiles from peripheral blood mononuclear cells are sensitive to short processing delays. Biopreserv. Biobank. 2010;8:153–162. doi: 10.1089/bio.2010.0009. - DOI - PMC - PubMed
    1. Massoni-Badosa R, et al. Sampling time-dependent artifacts in single-cell genomics studies. Genome Biol. 2020;21:112. doi: 10.1186/s13059-020-02032-0. - DOI - PMC - PubMed
    1. Adam M, Potter AS, Potter SS. Psychrophilic proteases dramatically reduce single cell RNA-seq artifacts: A molecular atlas of kidney development. Development. 2017 doi: 10.1242/dev.151142. - DOI - PMC - PubMed
    1. Machado L, Relaix F, Mourikis P. Stress relief: Emerging methods to mitigate dissociation-induced artefacts. Trends Cell Biol. 2021;31:888–897. doi: 10.1016/j.tcb.2021.05.004. - DOI - PubMed
    1. Mattei D, et al. Enzymatic dissociation induces transcriptional and proteotype bias in brain cell populations. Int. J. Mol. Sci. 2020;21:7944. doi: 10.3390/ijms21217944. - DOI - PMC - PubMed