. 2024 Mar;38(3):491-501.
doi: 10.1038/s41375-023-02123-4. Epub 2023 Dec 28.

Loss of thymocyte competition underlies the tumor suppressive functions of the E2a transcription factor in T-ALL

Affiliations

Loss of thymocyte competition underlies the tumor suppressive functions of the E2a transcription factor in T-ALL

Geoffrey Parriott et al. Leukemia. 2024 Mar.

Abstract

T lymphocyte acute lymphoblastic leukemia (T-ALL) is frequently associated with increased expression of the E protein transcription factor inhibitors TAL1 and LYL1. In mouse models, ectopic expression of TAL1 or LYL1 in T cell progenitors, or inactivation of E2A, is sufficient to predispose mice to develop T-ALL. How E2A suppresses thymocyte transformation is currently unknown. Here, we show that early deletion of E2a, prior to the DN3 stage, was required for robust leukemogenesis and was associated with alterations in thymus cellularity, T cell differentiation, and gene expression in immature CD4+CD8+ thymocytes. Introduction of wild-type thymocytes into mice with early deletion of E2a prevented leukemogenesis, or delayed disease onset, and impacted the expression of multiple genes associated with transformation and genome instability. Our data indicate that E2A suppresses leukemogenesis by promoting T cell development and enforcing inter-thymocyte competition, a mechanism that is emerging as a safeguard against thymocyte transformation. These studies have implications for understanding how multiple essential regulators of T cell development suppress T-ALL and support the hypothesis that thymocyte competition suppresses leukemogenesis.


Conflict of interest statement

COMPETING INTERESTS

The authors declare no competing financial interests.

Figures

Fig. 1.
Fig. 1.. Early hematopoietic deletion of E2a predisposes mice to T-ALL and alters thymocyte development.
(A) Age at death of VcKO (n=23), LcKO (n=15), and Ctrl (n=13) mice throughout 52 weeks of study. (B) Kaplan-Meier curve of leukemia free survival for VcKO and LcKO mice. (C) Analysis of total number of cells in the thymus of VcKO, LcKO and Ctrl mice at one week, (D) 3–5 weeks, (E) 8 weeks, and (F) 10 weeks of age. Ctrl n = 5, 13, 7, and 3; LcKO n = 13, 4, 4, 10; VcKO n = 9, 6, 5, 10 for (C), (D), (E), and (F). (G) Representative FACS plots showing CD4 and CD8 profiles gated on Lineage thymocytes (Top) or c-Kit (BD Pharmingen, 558163) and CD25 (BD Pharmingen, 553072) on LineageCD4CD8 thymocytes (Bottom). (H) Quantification of frequency and number of DP (Top) or DN3s (Bottom) thymocyte populations. (I) Representative FACS plots (left) and quantification of Ki67 expression (right) in DP thymocytes. Ctrl = 16, LcKO n = 11, VcKO n = 9.
Fig. 2.
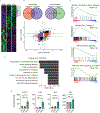
Fig. 2.. HSC-, but not DN3-deletion of E2a alters oncogenic gene expression in DP thymocytes from 4-week-old mice.
(A) Heatmap of genes DEGs in VcKO (n=3) or LcKO (n= 3) DPs compared to Ctrl (n=6) DPs. (B) Venn diagram showing number of DEGs between VcKO vs Ctrl DPs and LcKO vs Ctrl DPs (Top) and graph of LogFC over control for all DEGS in VcKO and LcKO DPs (Bottom). (C) Graph of log(q-value) of relevant KEGG pathways of genes uniquely upregulated in VcKO vs Ctrl DPs. (D) GSEA plots showing pathways enriched in VcKO DPs compared to LcKO DPs. (E) Normalized RNA-sequencing reads showing altered gene expression between VcKO, LcKO and Ctrl DPs.
Fig. 3.
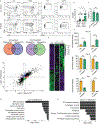
Fig. 3.. VcKO DP thymocytes show increased gene dysregulation in 8-week-old DPs compared to 4-week-old DPs.
(A) Representative FACS plots showing CD4 and CD8 on lineage thymocytes (Left) and CD25 on DP thymocytes (Right) from 4-week (Top) or 8-week (Bottom) VcKO and Ctrl mice. (B) Frequency of CD25+ DPs from VcKO (n = 19 or 6) and Ctrl (n = 18 or 5) mice at the indicated age. Significance determined using Brown-Forscythe and Welch ANOVA. (C) Percent Ki67High DPs in VcKO mice at the indicated age (n = 8 or 4). (D) Venn diagram showing number of DEGs between VcKO DPs vs Ctrl DPs from 4 week or 8-week-old mice (Top) and graph of LogFC over Ctrl for all DEGS in 4 week and 8 week DPs (Bottom). (E) Heatmap of all DEGs in DPs vs Ctrl in 4 week or 8-week-old mice. (F) Normalized RNA-sequencing read counts showing altered gene expression between DPs vs Ctrl at 4 weeks and 8 weeks. Significance determined using EdgeR. (G-H) Graph of log(q-value) of relevant KEGG pathways of genes uniquely (G) upregulated or (H) downregulated in 8 Week VcKO vs Ctrl DPs. n = 3 for Ctrl and VcKO RNA-seq at 8 weeks.
Fig. 4.
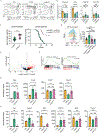
Fig. 4.. Wild-type thymocytes compete with VcKO thymocytes to limit leukemogenesis and alter DP gene expression.
(A) Representative FACS plot showing CD4 and CD8 in the thymus of VcKO, TPT chimeras, and Ctrl mice. (B) Number of the indicated cell type from VcKO (n = 7), TPT chimeras (n = 19), and Ctrl (n = 7) mice. Cyan color indicates the total number of indicated populations. Pink color indicates the relative contribution of CD45.1+ (Host) cells. Statistics are for total cell number. (C) Age at death of (Left) and Kaplan-Meier curve (Right) for VcKO (n = 23) and TPT chimeric mice (n = 16). (D) Representative FACS histograms (Left) and quantification (Right) of Ki67 in Ctrl (n = 15), VcKO (n = 10), TPT Host, or TPT Donor DPs (n = 15). (E) Volcano plot showing significantly DEGs (p<0.05 and LogFC ≥ 0.5) between TPT Host and VcKO DPs. (F) GSEA showing pathways enriched in VcKO or TPT Host DPs. (G) Representative FACS histograms (Left) and quantification (Right) of FLICA staining in Ctrl (n = 7), VcKO (n = 6), TPT Host, or TPT Donor DPs (n = 8). (H) Normalized RNA-sequencing reads showing expression of Myc pathways genes and (I) selected genes of interest in Ctrl, VcKO, and TPT Host DPs. Significance determined using EdgeR.
Fig. 5.
Fig. 5.. Leukemia latency in TPT chimeric mice is associated with WT competitor chimerism.
(A) Violin plot (Left) showing age at death based on chimerism of TPT chimeric mice at 4 weeks post-transplant and (right) their separation into high or low chimerism groups based on peripheral CD4 chimerism. The average frequency of donor cells at 0 weeks (n = 8), 4 weeks (n = 8), 20 weeks (n = 8), or 30 weeks (n = 5) post-transplant is shown for high and low chimerism mice. Blue represents high chimerism and long-lived mice, red represents low chimerism and short-lived mice. (B) Representative FACS plots showing CD4 and CD8 profiles and CD45.1/CD45.2 chimerism of high chimerism mice (Top) and low chimerism mice (Bottom) at 4 weeks (Left, n = 18) and at 22- or 30-weeks post-transplant (endpoint, n = 7) (Right). (C) Frequency of donor thymocytes in high chimerism and low chimerism TPT mice at 4 weeks post-transplant and of long and short lived TPT mice at 20 or 30 weeks (endpoint). (D) Frequency of Donor (CD45.2+) cells in bone marrow LSKs or thymic populations with High chimerism (blue) and Low chimeras (red) mice indicated. n = 10.

Update of

References

    1. Aifantis I, Raetz E, Buonamici S. Molecular pathogenesis of T-cell leukaemia and lymphoma. Nat Rev Immunol. 2008. May;8(5):380–90. - PubMed
    1. Noronha EP, Marques LVC, Andrade FG, Thuler LCS, Terra-Granado E, Pombo-de-Oliveira MS, et al. The Profile of Immunophenotype and Genotype Aberrations in Subsets of Pediatric T-Cell Acute Lymphoblastic Leukemia. Front Oncol. 2019. Apr 30;9:316. - PMC - PubMed
    1. Belver L, Ferrando A. The genetics and mechanisms of T cell acute lymphoblastic leukaemia. Nat Rev Cancer. 2016. Aug;16(8):494–507. - PubMed
    1. Ferrando AA, Look AT. Gene expression profiling in T-cell acute lymphoblastic leukemia. Seminars in Hematology. 2003. Oct;40(4):274–80. - PubMed
    1. Coustan-Smith E, Mullighan CG, Onciu M, Behm FG, Raimondi SC, Pei D, et al. Early T-cell precursor leukaemia: a subtype of very high-risk acute lymphoblastic leukaemia. The Lancet Oncology. 2009. Feb;10(2):147–56. - PMC - PubMed

Publication types

MeSH terms

Substances