. 2024 May;57(5):e13594.
doi: 10.1111/cpr.13594. Epub 2023 Dec 28.

An in vivo drug screen in zebrafish reveals that cyclooxygenase 2-derived prostaglandin D2 promotes spinal cord neurogenesis

Affiliations

An in vivo drug screen in zebrafish reveals that cyclooxygenase 2-derived prostaglandin D2 promotes spinal cord neurogenesis

Laura González-Llera et al. Cell Prolif. 2024 May.

Abstract

The study of neurogenesis is essential to understanding fundamental developmental processes and for the development of cell replacement therapies for central nervous system disorders. Here, we designed an in vivo drug screening protocol in developing zebrafish to find new molecules and signalling pathways regulating neurogenesis in the ventral spinal cord. This unbiased drug screen revealed that 4 cyclooxygenase (COX) inhibitors reduced the generation of serotonergic interneurons in the developing spinal cord. These results fitted very nicely with available single-cell RNAseq data revealing that floor plate cells show differential expression of 1 of the 2 COX2 zebrafish genes (ptgs2a). Indeed, several selective COX2 inhibitors and two different morpholinos against ptgs2a reduced the number of serotonergic neurons in the ventral spinal cord and led to locomotor deficits. Single-cell RNAseq data and different pharmacological manipulations further revealed that COX2-floor plate-derived prostaglandin D2 promotes neurogenesis in the developing spinal cord by promoting mitotic activity in progenitor cells. Rescue experiments using a phosphodiesterase-4 inhibitor suggest that intracellular changes in cAMP levels underlie the effects of COX inhibitors on neurogenesis and locomotion. Our study provides compelling in vivo evidence showing that prostaglandin signalling promotes neurogenesis in the ventral spinal cord.


Conflict of interest statement

The authors declare no conflicts of interest.

Figures

FIGURE 1
FIGURE 1
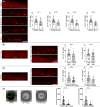
An unbiased drug screen reveals new small molecules and signalling pathways that control neurogenesis in the ventral spinal cord. (A) Treatments with the Shh signalling inhibitor Cyclopamine (6.487 ± 0,224 cells, n = 117; Mann–Whitney test; p‐value <0.0001) or the smoothened receptor antagonist SANT‐2 (7.682 ± 0.402 cells, n = 22; Unpaired t‐test; p‐value = 0.0003) reduced the numbers of serotonergic neurons (red fluorescence) in the ventral spinal cord as compared to DMSO controls (Cyclopamine control: 11.24 ± 0.264 cells, n = 101; SANT‐2 control: 10.23 ± 0.496 cells, n = 22). (B) Treatments with anti‐dopaminergic drugs from the LOPAC library (Perlapine: 7.222 ± 0.375 cells, n = 27; Unpaired t‐test; p‐value <0.0001; molindone hydrochloride: 8.842 ± 0.384 cells, n = 19; Unpaired t‐test; p‐value = 0.0142; L‐741,626: 7.563 ± 0.376 cells, n = 21; Unpaired t‐test; p‐value = 0.0067) reduced the numbers of serotonergic neurons in the ventral spinal cord as compared to DMSO controls (Perlapine control: 10.23 ± 0.496 cells, n = 22; molindone hydrochloride control: 10.91 ± 0.581 cells, n = 32; L‐741,626 control: 9.429 ± 0.486 cells, n = 16). (C) Treatments with COX inhibitors from the LOPAC library (Ketorolac: 8.125 ± 0.340 cells, n = 16; Unpaired t‐test; p‐value = 0.0022; Loxoprofen: 7.615 ± 0.789 cells, n = 13; Unpaired t‐test; p‐value = 0.0058; Meloxicam: 6.813 ± 0.579 cells, n = 16; Mann–Whitney test; p‐value = 0.0005; S(+)‐Ibuprofen: 7.000 ± 0.532 cells, n = 24; Unpaired t‐test; p‐value <0.0001) reduced the numbers of serotonergic neurons in the ventral spinal cord as compared to DMSO controls (Ketorolac control: 10.91 ± 0.581 cells, n = 32; Loxoprofen control: 10.23 ± 0.496 cells, n = 13; Meloxicam control: 9.429 ± 0.486 cells, n = 21; S(+)‐Ibuprofen control: 10.23 ± 0.496 cells, n = 22). (D) A treatment with the COX inhibitor S(+)‐Ibuprofen (8.200 ± 0.582 cells, n = 30; Unpaired t‐test; p‐value <0.0001) reduced the numbers of serotonergic pet1+ neurons in the ventral spinal cord of pet1:gfp fish as compared to DMSO controls (11.84 ± 0.542 cells, n = 19). Note the perfect colocalization of serotonin (red) and gfp (green) immunofluorescence signals in serotonergic cells. Rostral is to the right and dorsal to the top in all photomicrographs. Scale bars: 25 μm.
FIGURE 2
FIGURE 2
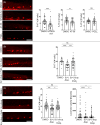
COX2 (ptgs2a) inhibition reduces the numbers of serotonergic neurons (red fluorescence) in the ventral spinal cord and leads to locomotor deficits. (A) Treatments with the selective COX2 inhibitors Etodolac (7.917 ± 0.499 cells, n = 36; Unpaired t‐test; p‐value = 0.0017), Rofecoxib (7.185 ± 0.403 cells, n = 27; Unpaired t‐test; p‐value <0.0001), Nimesulide (6.652 ± 0.46 cells, n = 23; Unpaired t‐test; p‐value <0.0001) and DFU (6.72 ± 0.38 cells, n = 25; Unpaired t‐test; p‐value <0.0001) reduced the numbers of serotonergic neurons in the ventral spinal cord as compared to DMSO controls (10.05 ± 0.424 cells, n = 38). (B) Translation (4.244 ± 0.395 cells, n = 45; Unpaired t‐test; p‐value = 0.0007) and splicing (4.881 ± 0.338 cells, n = 59; Unpaired t‐test; p‐value = 0.0015) morpholinos (MO) against the ptgs2a mRNA reduced the numbers of serotonergic neurons in the ventral spinal cord as compared to zebrafish treated with the control morpholino (6.250 ± 0.411 cells, n = 40). (C) Treatments with the COX inhibitors S(+)‐Ibuprofen (4.512 ± 0.375 cells, n = 43; Unpaired t‐test; p‐value <0.0001) and Nimesulide (4.241 ± 0.519 cells, n = 29; Unpaired t‐test; p‐value = 0.0003) reduced the numbers of serotonergic neurons in the ventral spinal cord as compared to DMSO controls (7.367 ± 0.563 cells, n = 49). (D) Animals treated with S(+)‐Ibuprofen (294.2 ± 69.20 cm, n = 49; Mann–Whitney test; p‐value <0.0001) and Nimesulide (155.5 ± 50.63 cm, n = 42; Mann–Whitney test; p‐value <0.0001) (see C) showed significant locomotor deficits as compared to DMSO controls (1499 ± 163.1 cm, n = 60). Examples of 10‐min swim tracks (with light) are shown to the left. Total locomotor activity, which was recorded for 1 h (6 10‐min periods alternating light and dark conditions), is shown in the graphs. Rostral is to the right and dorsal to the top in all photomicrographs. Scale bars: 25 μm.
FIGURE 3
FIGURE 3
PGDS/PGD2/cAMP signalling promotes the generation of serotonergic neurons (red fluorescence) in the ventral spinal cord. (A) Treatments with the PGDS inhibitors hPGDS‐IN‐1 (4.132 ± 0.366 cells, n = 53; Mann–Whitney test; p‐value <0.0001) and AT‐56 (8.179 ± 0.392 cells, n = 39; Unpaired t‐test; p‐value = 0.0045) reduced the numbers of serotonergic neurons in the ventral spinal cord as compared to DMSO controls (hPGDS‐IN‐1 controls: 6.660 ± 0.359 cells, n = 47; AT‐56 controls: 9.696 ± 0.343 cells, n = 46). A treatment with PGD2 methyl ester (2.5 μM; 11.18 ± 0.546 cells, n = 34; Unpaired t‐test; p‐value = 0.8421) does not significantly change the number of serotonergic neurons in the spinal cord of 4 dpf zebrafish as compared to DMSO controls (11.06 ± 0.282 cells, n = 36). (B) A co‐treatment of S(+)‐Ibuprofen (10 μM) with 2.5 μM PGD2 methyl ester (9.154 ± 0.364 cells, n = 52; Kruskal–Wallis test; p‐value = 0.071) was able to rescue the inhibitory effects of an S(+)‐Ibuprofen treatment (7.333 ± 0.295 cells, n = 42; Kruskal–Wallis test; p‐value <0.0001) on the generation of 5‐HT‐ir spinal cord neurons. Numbers of serotonergic neurons in S(+)‐Ibuprofen and PGD2 methyl ester treated zebrafish were not significantly different as compared to DMSO controls (10.21 ± 0.283 cells, n = 34). C. S(+)‐Ibuprofen and Rolipram treated 4 dpf zebrafish showed numbers of 5‐HT‐ir neurons (10.19 ± 0.361 cells, n = 47; Kruskal–Wallis test; p‐value = 0.9081) similar to DMSO controls (10.88 ± 0.411 cells, n = 50) and that were significantly higher than S(+)‐Ibuprofen treated (8.375 ± 0.489 cells, n = 48; Kruskal–Wallis test; p‐value = 0.0006) zebrafish. 4 dpf zebrafish treated with S(+)‐Ibuprofen and Rolipram (245.3 ± 45.66 cm, n = 89; Kruskal–Wallis test; p‐value = 0.0315) showed increased locomotor activity as compared to S(+)‐Ibuprofen (198.7 ± 56.07 cm, n = 88; Kruskal–Wallis test; p‐value <0.0001) treated zebrafish (Figure 3D). However, locomotor activity in S(+)‐Ibuprofen and Rolipram treated zebrafish was still significantly lower than in DMSO controls (445.2 ± 79.30 cm, n = 85). Rostral is to the right and dorsal to the top in all photomicrographs. Scale bars: 25 μm.
FIGURE 4
FIGURE 4
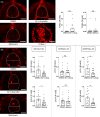
PG signalling promotes mitotic activity in the developing spinal cord of 3 dpf zebrafish. (A) Treatments with the COX inhibitors S(+)‐Ibuprofen (0.046 ± 0.02 cells, n = 17; Mann–Whitney test; p‐value = 0.1227) and Meloxicam (0.012 ± 0.008 cells, n = 16; Mann–Whitney test; p‐value = 0.7341) did not significantly changed the number of TUNEL positive (apoptotic) cells in the spinal cord as compared to DMSO controls (0.006 ± 0.006 cells, n = 17). Note the clear TUNEL positive nuclei in a DNase I positive control spinal cord section. (B) Treatments with the COX inhibitors S(+)‐Ibuprofen (0.345 ± 0.074 cells, n = 21; Unpaired t‐test; p‐value = 0.0107) and Meloxicam (0.367 ± 0.078 cells, n = 19; Unpaired t‐test; p‐value = 0.0199) significantly changed the number of pH 3+ positive (mitotic) cells in the whole spinal cord (SC) as compared to DMSO controls (0.695 ± 0.11 cells, n = 19). Treatments with the COX inhibitors S(+)‐Ibuprofen (0.210 ± 0.041 cells, n = 21; Mann–Whitney test; p‐value = 0.9402) and Meloxicam (0.238 ± 0.053 cells, n = 29; Mann–Whitney test; p‐value = 0.8211) did not significantly changed the number of pH 3+ positive cells in the dorsal spinal cord as compared to DMSO controls (0.263 ± 0.060 cells, n = 19). Treatments with the COX inhibitors S(+)‐Ibuprofen (0.177 ± 0.043 cells, n = 21; Unpaired t‐test; p‐value = 0.0042) and Meloxicam (0.16 ± 0.029 cells, n = 29; Unpaired t‐test; p‐value = 0.0016) significantly changed the number of pH 3+ positive cells in the ventral spinal cord as compared to DMSO controls (0.432 ± 0.074 cells, n = 19). Dorsal is to the top in all photomicrographs of the larval transverse sections. The dashed lines indicate the border of the spinal cord in (A) and (B) and, also the separation between the ventral and dorsal portions of the spinal cord in (B). Scale bars: 20 μm.

Similar articles

References

    1. Sagner A, Briscoe J. Establishing neuronal diversity in the spinal cord: a time and a place. Development. 2019;146(22):dev182154. doi:10.1242/dev.182154 - DOI - PubMed
    1. Martí E, Bumcrot DA, Takada R, McMahon AP. Requirement of 19K form of sonic hedgehog for induction of distinct ventral cell types in CNS explants. Nature. 1995;375(6529):322‐325. doi:10.1038/375322a0 - DOI - PubMed
    1. Roelink H, Porter JA, Chiang C, et al. Floor plate and motor neuron induction by different concentrations of the amino‐terminal cleavage product of sonic hedgehog autoproteolysis. Cell. 1995;81(3):445‐455. doi:10.1016/0092-8674(95)90397-6 - DOI - PubMed
    1. Chen F, Köhler M, Cucun G, et al. sox1a:eGFP transgenic line and single‐cell transcriptomics reveal the origin of zebrafish intraspinal serotonergic neurons. iScience. 2023;26(8):107342. doi:10.1016/j.isci.2023.107342 - DOI - PMC - PubMed
    1. Montgomery JE, Wiggin TD, Rivera‐Perez LM, Lillesaar C, Masino MA. Intraspinal serotonergic neurons consist of two, temporally distinct populations in developing zebrafish. Dev Neurobiol. 2016;76(6):673‐687. doi:10.1002/dneu.22352 - DOI - PMC - PubMed

MeSH terms