. 2024 Mar;11(10):e2303503.
doi: 10.1002/advs.202303503. Epub 2023 Dec 28.

Locus Coeruleus-Dorsolateral Septum Projections Modulate Depression-Like Behaviors via BDNF But Not Norepinephrine

Affiliations

Locus Coeruleus-Dorsolateral Septum Projections Modulate Depression-Like Behaviors via BDNF But Not Norepinephrine

Qian Zhang et al. Adv Sci (Weinh). 2024 Mar.

Abstract

Locus coeruleus (LC) dysfunction is involved in the pathophysiology of depression; however, the neural circuits and specific molecular mechanisms responsible for this dysfunction remain unclear. Here, it is shown that activation of tyrosine hydroxylase (TH) neurons in the LC alleviates depression-like behaviors in susceptible mice. The dorsolateral septum (dLS) is the most physiologically relevant output from the LC under stress. Stimulation of the LCTH -dLSSST innervation with optogenetic and chemogenetic tools bidirectionally can regulate depression-like behaviors in both male and female mice. Mechanistically, it is found that brain-derived neurotrophic factor (BDNF), but not norepinephrine, is required for the circuit to produce antidepressant-like effects. Genetic overexpression of BDNF in the circuit or supplementation with BDNF protein in the dLS is sufficient to produce antidepressant-like effects. Furthermore, viral knockdown of BDNF in this circuit abolishes the antidepressant-like effect of ketamine, but not fluoxetine. Collectively, these findings underscore the notable antidepressant-like role of the LCTH -dLSSST pathway in depression via BDNF-TrkB signaling.

Keywords: BDNF signaling; depression-like behavior; dorsolateral septum; locus coeruleus.


Conflict of interest statement

The authors declare no conflict of interest.

Figures
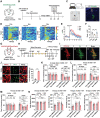
Figure 1
Figure 1
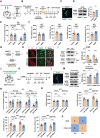
Activation of LCTH neurons plays a vital role in CSDS‐induced depression‐like behaviors. A) Schematic representation of the virus injection. B) Experimental scheme of fiber photometry recordings in control and CSDS‐treated mice. C) Representative image of the LC injection sites. Scale bar = 250 µm. D) Heatmaps of Ca2+ transients evoked by approaching an unfamiliar CD1 mouse in control, susceptible, and resilient mice (control, trial = 24, mice = 5; susceptible, trial = 17, mice = 5; resilient, trial = 25, mice = 5). E) Average plots of Ca2+ responses in the control, susceptible, and resilient mice. F) Statistical analysis of the peak Ca2+ activity at the onset of approaching an unfamiliar CD1 mouse (n = 5). G) Schematic representation of virus injection. H) The experimental scheme. I) Representative images of LC injection sites. Scale bar = 100 µm. J) Representative images showing hM3Dq cells expressing c‐Fos in the saline and CNO groups (left panel). Percentage of hM3Dq‐mCherry cells expressing c‐Fos (n = 4). Scale bar = 50 µm. K–M) Statistical analysis of time spent in the social interaction zone in the SIT after a single dose of CNO or saline K), 5 days of repeated CNO or saline L), and 10 days of repeated CNO or saline treatment in different groups M) (n = 10). Con, control; Sus, susceptible; CNO, clozapine. N) Locomotor activity in the OFT, immobility time in the FST and TST, and sucrose preference in the SPT after 10 days of repeated CNO or saline stimulation in different groups (n = 10). Data represented as mean ± SEM. *p < 0.05, **p < 0.01, ***p < 0.001; n.s., not significant. Unpaired two‐tailed Student's t‐test was used for (J). One‐way ANOVA followed by Tukey's post hoc analysis for (F). Two‐way ANOVA followed by Bonferroni's post hoc analysis for (K–N). The statistical details can be found in Table S1, Supporting Information.
Figure 2
Figure 2
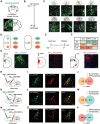
One‐to‐one projection pattern of LCTH neurons to dLS, mPFC, and CeA A) Schematic representation of the viral infection in TH‐Cre mice. Scale bar = 600 µm. B) Schematic representation of the experimental design. C) The main distribution of LCTH neuronal terminals in the brain. Scale bar = 300 µm. D1, dysgranular insular cortex; S1, primary somatosensory cortex; M1, primary motor cortex; M2, secondary motor cortex; Cg1, cingulate cortex, area 1; PrL, prelimbic cortex; IL, infralimbic cortex; LSS, lateral stripe of the striatum; Acbc, accumbens nucleus, core; VDB, nucleus of the vertical limb of the diagonal band; ICjM, islands of Calleja, major island; MS, medial septal nucleus; ICj, islands of Calleja; LV, lateral ventricle; dLS, dorsolateral septum; LSI, lateral septal nucleus, intermediate part; LSV, lateral septal nucleus, intermediate part; BSTLD, bed nucleus of the stria terminalis, lateral division, dorsal part; PS, parastrial nucleus; LPO, lateral preoptic area; HDB, nucleus of the horizontal limb of the diagonal band; MHb, medial habenular nucleus; PV, paraventricular thalamic nucleus; MD, mediodorsal thalamic nucleus; MDL, mediodorsal thalamic nucleus, lateral part; MDC, mediodorsal thalamic nucleus, central part; CM, central medial thalamic nucleus; CeA, central nucleus of the amygdala; BLA, basolateral amygdaloid nucleus, anterior part; ZID, zona incerta, dorsal part; LH, lateral hypothalamic area; fr, fasciculus retroflexus; PV, paraventricular thalamic nucleus; mL, medial lemniscus; IMD, intermediodorsal thalamic nucleus; scp, superior cerebellar peduncle (brachium conjunctivum); ZIV, zona incerta, ventral part; ZID, zona incerta, dorsal part; ns, nigrostriatal bundle; mt, mammillothalamic tract; cp, cerebral peduncle, basal part; PAG, periaqueductal gray; RMC, red nucleus, magnocellular part; DpMe, deep mesencephalic nucleus; VTA, ventral tegmental area; SNC, substantia nigra, compact part; SNR, substantia nigra, reticular part. D) Two possible projection patterns: LCTH neurons independently send axons to A, B, or C (left) and LCTH neurons send axons to A, B, and C (right). E) The experimental scheme. F) Overlap percentages of LCTH neurons projecting to different downstream targets. G) Coronal brain slice includes a schematic (left) and the histology (right) of the AAVretro injection site in the dLS, mPFC, and CeA of TH‐Cre mice. Scale bar = 100 µm. H) Schematic representation of AAVretro‐DIO‐EGFP (green) injection into the dLS, and AAVretro‐DIO‐mCherry (red) injection into the mPFC of TH‐Cre mice. I) Coronal brain slices of LCTH neurons in TH‐Cre mice labeled with AAVretro‐DIO‐EGFP in green (dLS) and AAVretro‐DIO‐mCherry in red (mPFC). Scale bar = 100 µm. J) Venn diagram reflecting the overlap between dLS‐ and mPFC‐projecting LCTH neurons (n = 4). K) Schematic representation of AAVretro‐DIO‐EGFP injection into the dLS and AAVretro‐DIO‐mCherry injection into the CeA of TH‐Cre mice. L) Coronal brain slices of LCTH neurons in TH‐Cre mice labeled with AAVretro‐DIO‐EGFP in green (dLS) and AAVretro‐DIO‐mCherry in red (CeA). Scale bar = 100 µm. M) Venn diagram showing the overlap between dLS‐ and CeA‐projecting LCTH neurons (n = 5). N) Schematic representation of AAVretro‐DIO‐EGFP injection into the mPFC and AAVretro‐DIO‐mCherry injection into the CeA of TH‐Cre mice. O) Coronal brain slices of LCTH neurons from TH‐Cre mice labeled with AAVretro‐DIO‐EGFP in green (mPFC) and AAVretro‐DIO‐mCherry in red (CeA). Scale bar = 100 µm. P) Venn diagram showing the overlap between mPFC‐ and CeA‐projecting LCTH neurons (n = 4 mice). The statistical details can be found in Table S1, Supporting Information.
Figure 3
Figure 3
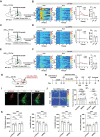
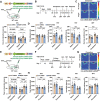
Activating LCTH‐dLS circuit promotes resilience to CSDS‐induced depression‐like behaviors. A) The experimental strategy for recording the activity of the LCTH‐dLS circuit in the SIT using fiber photometry. B) Heatmaps of Ca2+ transients (left), average plots of Ca2+ response (middle), and peak Ca2+ activities (right) evoked by approaching an unfamiliar CD1 mouse in the LCTH‐dLS circuit in control and susceptible mice (Con, trial = 23, mice = 5; susceptible, trial = 20, mice = 5). C) The experimental strategy for recording the activity of the LCTH‐mPFC circuit in the SIT using fiber photometry. D) Heatmaps of Ca2+ transients (left), average plots of Ca2+ response (middle), and peak Ca2+ activities (right) evoked by approaching an unfamiliar CD1 mouse in the LCTH‐mPFC circuit in control and susceptible mice (Con, trial = 22, mice = 5; susceptible, trial = 22, mice = 5). E) The experimental strategy for recording the activity of the LCTH‐CeA circuit in the SIT using fiber photometry. F) Heatmaps of Ca2+ transients (left), average plots of Ca2+ response (middle), and peak Ca2+ activities (right) evoked by approaching an unfamiliar CD1 mouse in the LCTH‐CeA circuit in control and susceptible mice (Con, trial = 22, mice = 5; susceptible, trial = 20, mice = 5). G) Schematic representation of virus injection. H) Experimental scheme. I) Representative images of LC injection sites. Scale bar = 100 µm. J) Representative social interaction tracks and time spent in the interaction zone in the SIT by different groups (n = 8) Sus, susceptible. K) Locomotor activity in the OFT, immobility time in the FST and TST, and sucrose preference in the SPT of susceptible mice expressing the mCherry or hM3Dq virus (n = 8). Data represented as mean ± SEM. *p < 0.05, **p < 0.01, ***p < 0.001; n.s., not significant. Unpaired two‐tailed Student's t‐test was used for (B,D,F). Two‐way ANOVA followed by Bonferroni's post hoc analysis for J, K). The statistical details can be found in Table S1, Supporting Information.
Figure 4
Figure 4
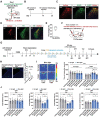
dLSSST neurons but not PV neurons are involved in the antidepressant‐like activity of LCTH‐dLS circuit. A) Schematic representation of the Cre‐dependent retrograde monosynaptic rabies tracing strategy. B) Experimental scheme for retrograde tracing. C) Representative images showing DsRed/EGFP double‐labeled starter cells in the dLS of mice injected with the SST‐Cre virus. Scale bar = 100 µm. D) DsRed signals traced from dLS SST neurons co‐localized with TH immunofluorescence in the LC. Scale bar = 100 µm. E) The percentage of DsRed‐labeled neurons expressing TH in the LC (n = 6). F) Schematic of the injection strategy. AAV‐DIO‐ChR2‐mCherry was injected into the LC, and a viral cocktail (1:1) of AAV‐PV‐Cre or AAV‐SST‐Cre and AAV‐DIO‐hM4Di‐mCherry were injected into the dLS of TH‐Cre mice. G) Timeline of the experiments. H) Representative images showing mCherry cells and Gi cells expressing c‐Fos in dLS SST neurons induced by photostimulation of LCTH‐dLS terminal fibers (left). Percentage of total mCherry cells and Gi cells expressing c‐Fos in the mCherry‐CNO and Gi‐CNO groups (right) (n = 3). I) Representative social interaction tracks of PV‐Gi‐CNO and SST‐Gi‐CNO following 10‐day repeated stimulation with CNO and blue light in susceptible mice (left). Time spent in the interaction zone in the SIT in different groups (right) (n = 7). The group of “No light+ mCherry + CNO” and “Blue light + mCherry + CNO” consisted of a mixture of viruses AAV‐DIO‐mCherry, AAV‐PV‐Cre and AAV‐SST‐Cre, serving as the control. J) Locomotor activity in the OFT, immobility time in the FST and TST, and sucrose preference in the SPT in susceptible mice following the inhibition of SST/PV neurons in the dLS (n = 7). Data represented as mean ± SEM. *p < 0.05, **p < 0.01, ***p < 0.001; n.s., not significant. Unpaired two‐tailed Student's t‐test for (H). Two‐way ANOVA followed by Bonferroni's post hoc analysis for (I,J). The statistical details can be found in Table S1, Supporting Information.
Figure 5
Figure 5
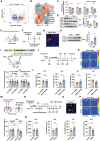
LCTH‐dLS circuit modulation of depression‐like behavior is BDNF signaling dependent. A) Volcano plot showing differentially regulated genes in LC of control and susceptible mice (n = 3). B) Heatmap of genes related to psychiatric disorders as determined by RNA sequencing of control and susceptible mice (n = 3). C) Quantitative real‐time PCR (qRT‐PCR) verification of specific target genes (B) (n = 3). D) Western blot analysis of BDNF expression in the LC and dLS (n = 3). E) Schematic representation of injection strategy. AAV‐DIO‐ChR2‐mCherry was injected into the LC of TH‐Cre mice, and optical fibers were implanted above the dLS. F) Timeline of the experiments. G) Representative image of dLS injection sites. Scale bar = 200 µm. H) Western blot analysis of BDNF expression in the dLS of Control and ChR2 mice (n = 3). I) Schematic representation of virus injection. J) Experimental scheme. K) Representative social interaction tracks (left). Time in the interaction zone in the SIT between Con‐shRNA and BDNF‐shRNA mice before and after 3 days of SSDS (right) (n = 10). L) Locomotor activity and depression‐like behaviors in con‐shRNA and BDNF‐shRNA mice (n = 10). M) Schematic of injection strategy. AAV‐DIO‐hM3Dq‐mCherry was injected into the LC and the CNO was injected 30 min prior to the administration of K252a in the dLS. N) Timeline of experiments O) Infusion sites were verified using 150 nL CTB‐488 in dLS. Scale bar = 200 µm. P) Representative social interaction tracks of mice infused with vehicle or K252a, and the time spent in the interaction zone in the SIT in different groups in TH‐Cre mice (n = 10). Q) Locomotor activity and depression‐like behaviors in susceptible TH‐Cre mice infused with vehicle or K252a (n = 10). Data represented as mean ± SEM. *p < 0.05, **p < 0.01, ***p < 0.001; n.s., not significant. Unpaired two‐tailed Student's t‐tests for (H), (L), and (Q). One‐way ANOVA followed by Tukey's post hoc analysis for (C,D). Two‐way ANOVA followed by Bonferroni's post hoc analysis for (K) and (P). The statistical details can be found in Table S1, Supporting Information.
Figure 6
Figure 6
Supplementation of BDNF in the LCTH‐dLS circuit produces significant antidepressant‐like effects. A) Schematic representation of the viral infection in BDNFflox/+ mice. B) Timeline of experiments C) Representative images of AAV‐TH‐Cre‐EGFP expression in the LC of BDNFflox/+ mice. Scale bars = 100 µm. D) Western blot analysis of the BDNF protein in the dLS of BDNFflox/+ mice treated with Saline or BDNF (n = 3). E) The time spent in the interaction zone in the SIT in different groups (n = 11) F) Locomotor activity and depression‐like behaviors in BDNFflox/+ mice after 3 days of SSDS infusion with saline or BDNF (n = 11). G) Generation of BDNF‐cKO mice. H) Double‐immunofluorescence staining for BDNF (green) and TH (red) in BDNF‐cKO and control mice. Scale bar = 50 µm. I) Western blot analysis of the BDNF protein in the LC and dLS of BDNF‐cKO and control mice (n = 4). J) Schematic of injection strategy. AAV‐Ef1a‐DIO‐EGFP‐BDNF‐3FLAG was bilaterally injected into the LC of BDNF‐cKO and TH‐Cre mice. K) Timeline of the experiments. L) Representative images of AAV‐Ef1a‐DIO‐EGFP‐BDNF‐3FLAG expression in LC. Scale bars = 100 µm. M) Western blot analysis of the BDNF protein in the LC of TH‐Cre mice and BDNF‐cKO mice treated with the virus of AAV‐Con and AAV‐BDNF (n = 3). N) The time spent in the interaction zone in the SIT in different groups (n = 11). O) Locomotor activity and depression‐like behaviors in BDNF‐cKO and TH‐Cre mice expressing either AAV‐Con or AAV‐BDNF in the LC (n = 11). P) The 2 × 2 contingency table shows the correlation between BDNF‐cKO and social avoidance. Numbers in the box indicate the number of animals. Data represented as mean ± SEM. *p < 0.05, **p < 0.01, ***p < 0.001; n.s., not significant. Unpaired two‐tailed Student's t‐tests for (D) and (F). Data were analyzed by one‐way ANOVA followed by Fisher's exact test for panels (P). One‐way ANOVA followed by Tukey's post hoc analysis for (I) and (M). Two‐way ANOVA followed by Bonferroni's post hoc analysis for (E) and (N,O). The statistical details can be found in Table S1, Supporting Information.
Figure 7
Figure 7
BDNF was necessary for the LCTH‐dLS circuit to sustain the antidepressant‐like effects of S‐ketamine but not fluoxetine. A) Schematic representation of the Cre‐dependent AAV expressing BDNF‐shRNA‐EGFP in the LCTH‐dLS circuit. B) Timeline of experiments. C) Representative social interaction tracks of BDNF‐shRNA and Con‐shRNA mice and the time spent in the interaction zone in the SIT in different groups (n = 9). D) Locomotor activity and depression‐like behaviors in BDNF‐shRNA and control‐shRNA mice injected with saline or S‐ketamine (n = 9). E) Schematic representation of virus injection. F) Timeline of the experiments. G) Representative social interaction tracks of BDNF‐shRNA and Con‐shRNA mice and the time spent in the interaction zone in the SIT in different groups (n = 8). H) Locomotor activity and depression‐like behaviors in BDNF‐shRNA and Con‐shRNA mice injected with saline or fluoxetine (n = 8). Data represented as mean ± SEM. *p < 0.05, **p < 0.01, ***p < 0.001; n.s., not significant. Two‐way ANOVA followed by Bonferroni's post hoc analysis for (C,D) and (G,H). The statistical details can be found in Table S1, Supporting Information.

Similar articles

Cited by

References

    1. Marwaha S., Palmer E., Suppes T., Cons E., Young A., Upthegrove R., Lancet 2023, 401, 141. - PubMed
    1. Parekh P., Johnson S., Liston C., Annu. Rev. Neurosci. 2022, 45, 581. - PMC - PubMed
    1. Liu S., Abdellaoui A., Verweij K., van Wingen G., Adv. Sci. (Weinh) 2023, 10, 2205486. - PMC - PubMed
    1. Sun Y., Chen X., Ou Z., Wang Y., Chen W., Zhao T., Liu C., Chen Y., Adv. Sci. (Weinh) 2022, 9, 2103065. - PMC - PubMed
    1. Yang C., Ren Q., Qu Y., Zhang J., Ma M., Dong C., Hashimoto K., Biol Psychiatry 2018, 83, 18. - PubMed

Publication types

Substances

LinkOut - more resources