

A visually guided swim assay for mouse models of human retinal disease recapitulates the multi-luminance mobility test in humans
- PMID: 38155679
- PMCID: PMC10752274
- DOI: 10.4103/sjopt.sjopt_155_23
A visually guided swim assay for mouse models of human retinal disease recapitulates the multi-luminance mobility test in humans
Abstract
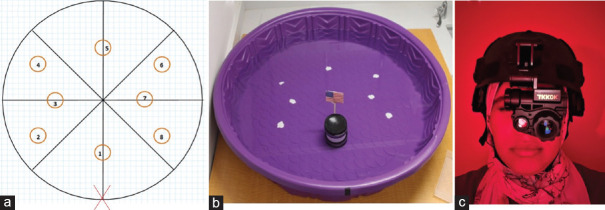
Purpose: The purpose of this study was to develop a visually guided swim assay (VGSA) for measuring vision in mouse retinal disease models comparable to the multi-luminance mobility test (MLMT) utilized in human clinical trials.
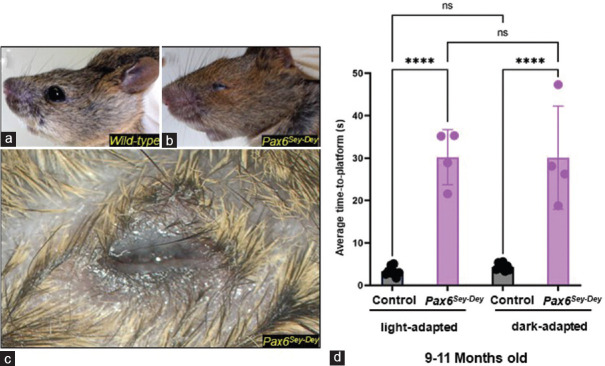
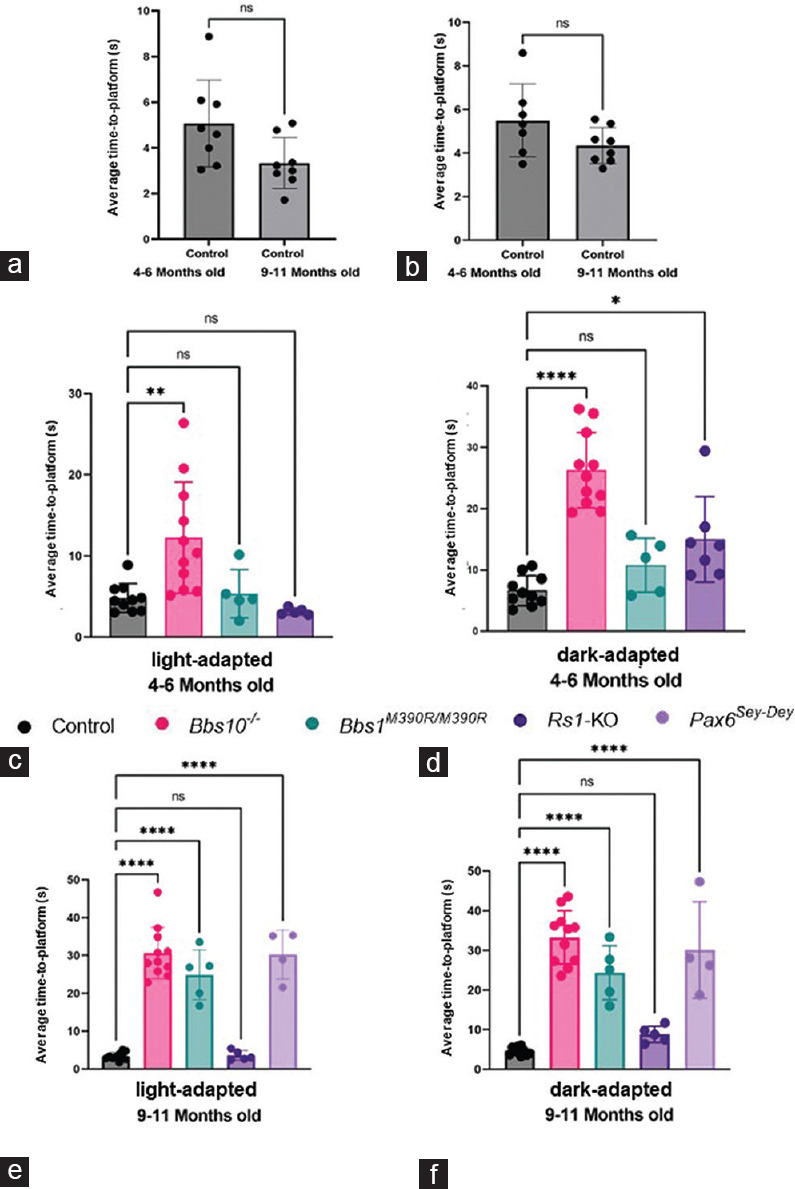
Methods: Three mouse retinal disease models were studied: Bardet-Biedl syndrome type 1 (Bbs1M390R/M390R), n = 5; Bardet-Biedl syndrome type 10 (Bbs10-/-), n = 11; and X linked retinoschisis (retinoschisin knockout; Rs1-KO), n = 5. Controls were normally-sighted mice, n = 10. Eyeless Pax6Sey-Dey mice, n = 4, were used to determine the performance of animals without vision in VGSA.
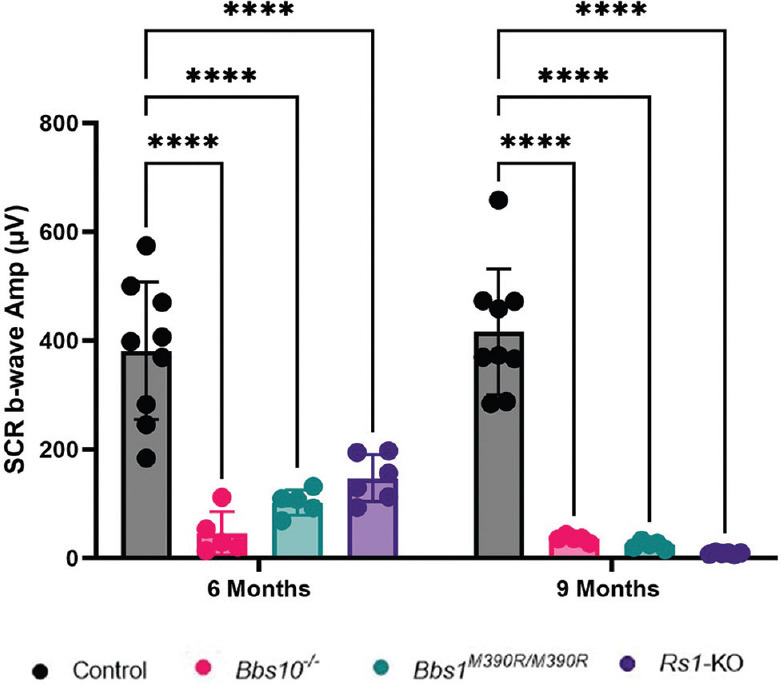
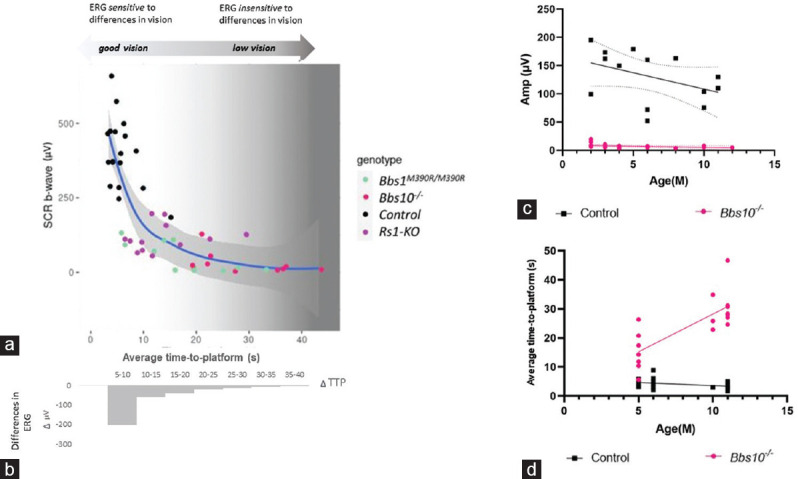
Results: Eyeless Pax6Sey-Dey mice had a VGSA time-to-platform (TTP) 7X longer than normally-sighted controls (P < 0.0001). Controls demonstrated no difference in their TTP in both lighting conditions; the same was true for Pax6Sey-Dey. At 4-6 M, Rs1-KO and Bbs10-/- had longer TTP in the dark than controls (P = 0.0156 and P = 1.23 × 10⁻⁸, respectively). At 9-11 M, both BBS models had longer TTP than controls in light and dark with times similar to Pax6Sey-Dey (P < 0.0001), demonstrating progressive vision loss in BBS models, but not in controls nor in Rs1-KO. At 1 M, Bbs10-/- ERG light-adapted (cone) amplitudes were nonrecordable, resulting in a floor effect. VGSA did not reach a floor until 9-11 M. ERG combined rod/cone b-wave amplitudes were nonrecordable in all three mutant groups at 9-11 M, but VGSA still showed differences in visual function. ERG values correlate non-linearly with VGSA, and VGSA measured the continual decline of vision.
Conclusion: ERG is no longer a useful endpoint once the nonrecordable level is reached. VGSA differentiates between different levels of vision, different ages, and different disease models even after ERG is nonrecordable, similar to the MLMT in humans.
Keywords: Dark-adapted; electroretinogram; functional vision; light-adapted; retinal degeneration; visually guided swim assay.
Copyright: © 2023 Saudi Journal of Ophthalmology.
Conflict of interest statement
There are no conflicts of interest.
Figures
Similar articles
-
An osmolarity dependent mechanism partially ameliorates retinal cysts and rescues cone function in a mouse model of X-linked retinoschisis.Front Med (Lausanne). 2024 Oct 15;11:1302119. doi: 10.3389/fmed.2024.1302119. eCollection 2024. Front Med (Lausanne). 2024. PMID: 39473494 Free PMC article.
-
The dose-response relationship of subretinal gene therapy with rAAV2tYF-CB-hRS1 in a mouse model of X-linked retinoschisis.Front Med (Lausanne). 2024 Feb 13;11:1304819. doi: 10.3389/fmed.2024.1304819. eCollection 2024. Front Med (Lausanne). 2024. PMID: 38414621 Free PMC article.
-
Progressive retinal degeneration of rods and cones in a Bardet-Biedl syndrome type 10 mouse model.Dis Model Mech. 2022 Sep 1;15(9):dmm049473. doi: 10.1242/dmm.049473. Epub 2022 Sep 20. Dis Model Mech. 2022. PMID: 36125046 Free PMC article.
-
Of men and mice: Human X-linked retinoschisis and fidelity in mouse modeling.Prog Retin Eye Res. 2022 Mar;87:100999. doi: 10.1016/j.preteyeres.2021.100999. Epub 2021 Aug 11. Prog Retin Eye Res. 2022. PMID: 34390869 Review.
-
Human retinal dark adaptation tracked in vivo with the electroretinogram: insights into processes underlying recovery of cone- and rod-mediated vision.J Physiol. 2022 Nov;600(21):4603-4621. doi: 10.1113/JP283105. Epub 2022 Jun 7. J Physiol. 2022. PMID: 35612091 Free PMC article. Review.
Cited by
-
An osmolarity dependent mechanism partially ameliorates retinal cysts and rescues cone function in a mouse model of X-linked retinoschisis.Front Med (Lausanne). 2024 Oct 15;11:1302119. doi: 10.3389/fmed.2024.1302119. eCollection 2024. Front Med (Lausanne). 2024. PMID: 39473494 Free PMC article.
-
The dose-response relationship of subretinal gene therapy with rAAV2tYF-CB-hRS1 in a mouse model of X-linked retinoschisis.Front Med (Lausanne). 2024 Feb 13;11:1304819. doi: 10.3389/fmed.2024.1304819. eCollection 2024. Front Med (Lausanne). 2024. PMID: 38414621 Free PMC article.
References
-
- Duncan JL, LaVail MM, Yasumura D, Matthes MT, Yang H, Trautmann N, et al. An RCS-like retinal dystrophy phenotype in mer knockout mice. Invest Ophthalmol Vis Sci. 2003;44:826–38. - PubMed
Grants and funding
LinkOut - more resources
Full Text Sources
Molecular Biology Databases
Research Materials