. 2024 Jan 9;96(1):364-372.
doi: 10.1021/acs.analchem.3c04394. Epub 2023 Dec 29.

Data-Driven Approach to Modeling Microfabricated Chemical Sensor Manufacturing

Affiliations

Data-Driven Approach to Modeling Microfabricated Chemical Sensor Manufacturing

Bradley S Chew et al. Anal Chem. .

Abstract

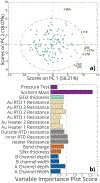
We have developed a statistical model-based approach to the quality analysis (QA) and quality control (QC) of a gas micro pre-concentrator chip (μPC) performance when manufactured at scale for chemical and biochemical analysis of volatile organic compounds (VOCs). To test the proposed model, a medium-sized university-led production batch of 30 wafers of chips were subjected to rigorous chemical performance testing. We quantitatively report the outcomes of each manufacturing process step leading to the final functional chemical sensor chip. We implemented a principal component analysis (PCA) model to score individual chip chemical performance, and we observed that the first two principal components represent 74.28% of chemical testing variance with 111 of 118 viable chips falling into the 95% confidence interval. Chemical performance scores and chip manufacturing data were analyzed using a multivariate regression model to determine the most influential manufacturing parameters and steps. In our analysis, we find the amount of sorbent mass present in the chip (variable importance score = 2.6) and heater and the RTD resistance values (variable importance score = 1.1) to be the manufacturing parameters with the greatest impact on chemical performance. Other non-obvious latent manufacturing parameters also had quantified influence. Statistical distributions for each manufacturing step will allow future large-scale production runs to be statistically sampled during production to perform QA/QC in a real-time environment. We report this study as the first data-driven, model-based production of a microfabricated chemical sensor.


Figures

Figure 1.
Figure 1.
A micro preconcentrator displayed in three formats. (a) A 3D rendering of the design with exploded top and bottom halves typically bonded together, (b) a realized fabricated device used in this study, (c) SEM of a micro preconcentrator cross section cut with a dicing saw down the line of the channel. Displayed are: (1) Electrical contact pads used to interface the device with driving electronics, (2) metal traces for the heater and RTD features, (3) metal pad and QR code used for identification and scanning chip history, (4) etched sorbent cavity, (5) etched micro channels, (6) through glass vias used to introduce and desorb chemical samples to the chip.
Figure 2.
Figure 2.
μPC chip fabrication process. (1) Laser initiation of a Borofloat33 substrate followed by; (2) selective wet etching in HF; (3) an intermediate SiNx layer is deposited with PECVD to assist with glass-glass anodic bonding; (4) complimentary wafers are glass-glass bonded to form the cavity and channels; (5,6) a layer of Chromium-Tungsten-Chromium is deposited and etched to form the heater and RTD traces; (7) gold is electron-beam evaporated onto the contact pads; (8,9) SiO2 passivation layer is deposited with PECVD and etched back to protect the heater and RTD traces.
Figure 3.
Figure 3.
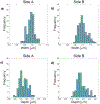
Distributions from etching process (n = 118) for channel dimensions of (a) side A width; (b) side B width; (c) side A depth; (d) side B depth.
Figure 4.
Figure 4.
Distribution from bonding parameters (n = 27) for (a) SiNx layer thickness; (b) Anodic bond max charge.
Figure 5.
Figure 5.
Distributions of heater manufacturing parameters after Cr-W-Cr metal deposition, etching processes and SiO2 passivation for (a) Top RTD (n = 118); (b) Bottom RTD (n = 118); (c) Heater (n = 118); and (d) Electrical Contact from post gold deposition on pads (n = 708); (e) Distribution of SiO2 passivation layer thickness deposited (n = 27).
Figure 6.
Figure 6.
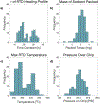
Distribution of thermal desorption parameters during GC-FID chemical testing (n = 118) for (a) τ of RTD heating profile; (b) Mass of sorbent; (c) Maximum RTD temperature; (d) Pressure over chip.
Figure 7:
Figure 7:
Gas chromatography flame ionization chromatogram (GC-FID) from a preconcentrated VOC gas mixture. The bottom shows an example chromatogram from preconcentrator serial number 03C with individual compound peaks identified. The top box and whisker plot each chemical compound’s mean centered signal distributions from all chips (n = 118) normalized to the standard deviation of the measurement variation study.
Figure 8:
Figure 8:
Comparison of the mean centered GC-FID peak area box and whisker plots from the main (n=118) study to the measurement variation study (n=35 pairs) for each chemical compound.
Figure 9:
Figure 9:
Results from principal component analysis and partial least squared regression modeling; a) PC1 and PC2 scores for all chemically tested μPC chips. Blue dots represent μPC chips that fell within the 95% confidence interval — red dashed line — while orange markers represent potential outlier chips, labeled with the chip serial number. b) Variable importance scores obtained by PLS regression. Variables with a score greater than one indicate manufacturing parameters predictive of device performance. Higher scores have stronger correlations.

References

    1. Mandoj F; Nardis S; Di Natale C; Paolesse R, Porphyrinoid Thin Films for Chemical Sensing. In Encyclopedia of Interfacial Chemistry, Wandelt K, Ed. Elsevier: Oxford, 2018; pp 422–443.
    1. Kaniewska M; Trojanowicz M, Chapter 8 - Chiral Sensors Based on Molecularly Imprinted Polymers. In Molecularly Imprinted Sensors, Li S; Ge Y; Piletsky SA; Lunec J, Eds. Elsevier: Amsterdam, 2012; pp 175–194.
    1. Pan TM; Mondal S, 13.07 - Structural Properties and Sensing Characteristics of Sensing Materials. In Comprehensive Materials Processing, Hashmi S; Batalha GF; Van Tyne CJ; Yilbas B, Eds. Elsevier: Oxford, 2014; pp 179–203.
    1. Rudnitskaya A., Sensors | Biomimetic Sensor Arrays. In Encyclopedia of Analytical Science (Third Edition), Worsfold P; Poole C; Townshend A; Miró M, Eds. Academic Press: Oxford, 2019; pp 154–160.
    1. Güntner AT; Abegg S; Königstein K; Gerber PA; Schmidt-Trucksäss A; Pratsinis SE, Breath Sensors for Health Monitoring. ACS Sens. 2019, 4 (2), 268–280. - PubMed