. 2024 Jan 10;16(1):44-53.
doi: 10.1021/acsami.3c12035. Epub 2023 Dec 29.

Quantitative Detection of Biological Nanovesicles in Drops of Saliva Using Microcantilevers

Affiliations

Quantitative Detection of Biological Nanovesicles in Drops of Saliva Using Microcantilevers

Clodomiro Cafolla et al. ACS Appl Mater Interfaces. .

Abstract

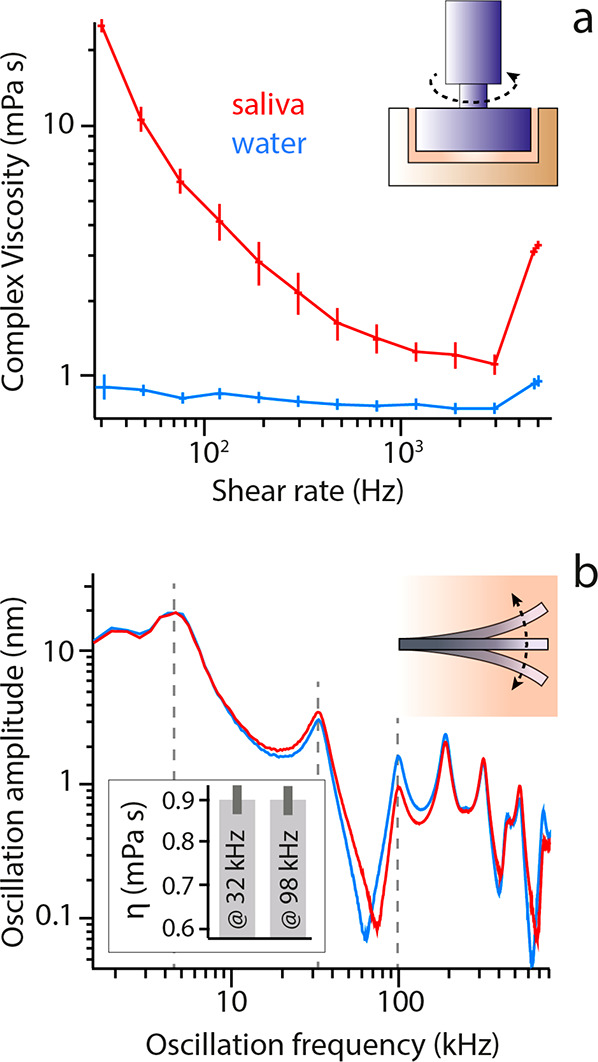
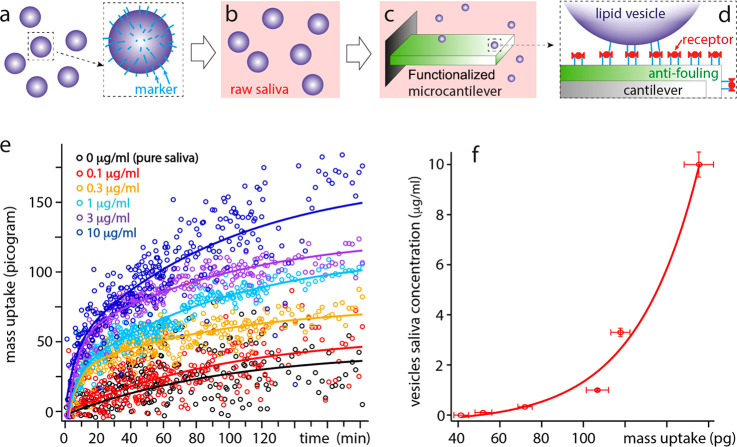
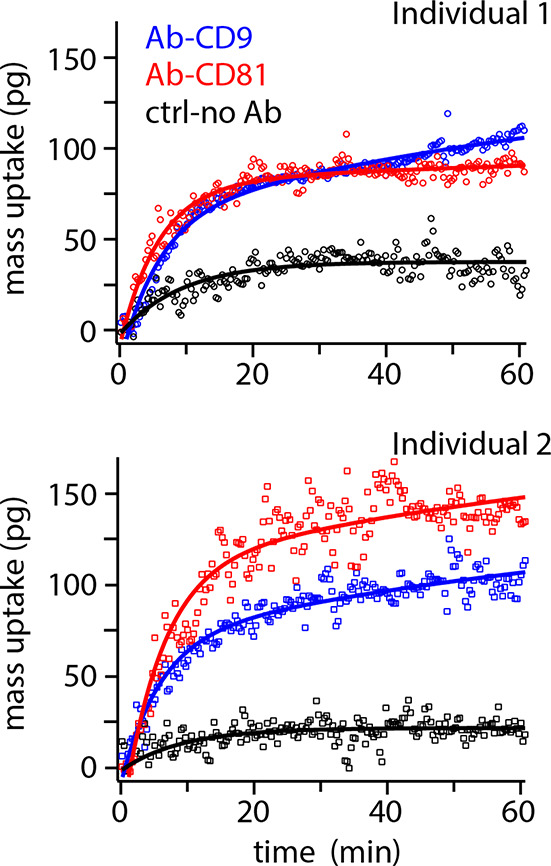
Extracellular nanovesicles (EVs) are lipid-based vesicles secreted by cells and are present in all bodily fluids. They play a central role in communication between distant cells and have been proposed as potential indicators for the early detection of a wide range of diseases, including different types of cancer. However, reliable quantification of a specific subpopulation of EVs remains challenging. The process is typically lengthy and costly and requires purification of relatively large quantities of biopsy samples. Here, we show that microcantilevers operated with sufficiently small vibration amplitudes can successfully quantify a specific subpopulation of EVs directly from a drop (0.1 mL) of unprocessed saliva in less than 20 min. Being a complex fluid, saliva is highly non-Newtonian, normally precluding mechanical sensing. With a combination of standard rheology and microrheology, we demonstrate that the non-Newtonian properties are scale-dependent, enabling microcantilever measurements with a sensitivity identical to that in pure water when operating at the nanoscale. We also address the problem of unwanted sensor biofouling by using a zwitterionic coating, allowing efficient quantification of EVs at concentrations down to 0.1 μg/mL, based on immunorecognition of the EVs' surface proteins. We benchmark the technique on model EVs and illustrate its potential by quantifying populations of natural EVs commonly present in human saliva. The method effectively bypasses the difficulty of targeted detection in non-Newtonian fluids and could be used for various applications, from the detection of EVs and viruses in bodily fluids to the detection of molecular clusters or nanoparticles in other complex fluids.

Keywords: biofouling; cancer; detection; extracellular nanovesicles; microcantilever; microrheology; non-Newtoninan fluid; saliva.


Conflict of interest statement

The authors declare no competing financial interest.

Figures

Figure 1
Figure 1
Probing saliva’s viscosity at different length scales. (a) Macroscopic standard shear rheological measurements highlight the non-Newtonian behavior of raw saliva (red) in comparison with pure water (blue). (b) The nanoscale viscoelastic behavior of raw saliva is also probed using a vibrating microcantilever operated with an AFM. The viscosity of the liquid surrounding the cantilever can be quantified from the frequency shift of the vibration resonances, with the method applied here to comparatively probe the viscosity of water and of raw saliva. No shift is observed between water and saliva (dashed lines), and the derived viscosities for saliva are identical to water within error (inset in b) (see Experimental Section and Figure S1 for more details). The microcantilever measurements were performed using a commercial microcantilever (Olympus, OMCL-RC800 PSA) at 25.0 ± 0.1 °C, with the probe fully immersed in liquid.
Figure 2
Figure 2
Passive microrheology of raw saliva with silica tracers. A cartoon representation of the system (ac) illustrates the fact that smaller tracers (a) can diffuse more easily through the mesh formed by saliva compared to larger tracers (b). However, this assumes a limited interaction of the tracer particles with the mesh. Otherwise, interactions with the mesh reduce mobility (c) and affect smaller particles relatively more due to their larger surface to volume ratio. (d) Example of a measurements with a 73 ± 6 nm tracer (without coating) showing the MSD <r2> as a function of time t on a log–log plot. In pure water, <r2> ∝ t indicating normal Brownian diffusion. In saliva, <r2> ∝ tα with α < 1, the so-called anomalous diffusion exponent indicating subdiffusion. (e) The evolution of α at different time scales highlighting differences for water (α ≈ 1, blue curve) and saliva (α < 1) with and without a zwitterionic antifouling coating on the tracer (red and black curves, respectively). Over a short observational time scale (<10 μs), the tracers are able to freely diffuse unhindered. Over longer time scales or for larger tracers, the impact of interactions with saliva components tends to hamper the diffusion. Measurements >0.5 ms are less reliable, being close to the tracking limit of the equipment. Here, this is visible in α becoming lower for coated than uncoated tracers, despite a significantly larger MSD. (f) Time evolution of α for tracers of different sizes. Comparison of α vs tracer size at selected times (10 μs, 25 μs, 50 μs, 0.1 ms, 0.25 ms, and 0.5 ms, vertical dashed lines) suggests consistent unhindered diffusion for tracers <25 nm (inset). All the particles’ diameters are measured by DLS using the same setup as for the microrheology (see Figure S3 and Table S1 within section 3 of the Supporting Information).
Figure 3
Figure 3
Characterization and testing of the proposed approach for targeted detection of specific EV subpopulations directly in raw saliva. The testing is carried out with model EVs composed of DPPC with 0.5% biotinylated lipids acting as surface markers (a) and dissolved into saliva (5% of the total volume from a phosphate buffer saline solution (b)). The cantilever is coated with a DPPC bilayer containing 0.5% biotinylated headgroups (c), preventing biofouling while ensuring specific binding of the model EVs after further streptavidin functionalization (d). From the changes in the cantilever’s vibration amplitude, phase, and frequency, the total mass of the target EVs binding to the cantilever can be precisely quantified despite the saliva background (e). Experimental data are fitted globally with a double exponential function, imposing the same two time scales (τ1 and τ2) for all the experiments. The most important differences occur within the first 5–10 min (τ1 = 346 ± 56 s), with only the slower evolution (τ2 = 5781 ± 778 s) present at 0.1 μg/mL and in pure saliva. (f) The maximum mass uptake (added mass at time = ∞) derived from the fitting also exhibits a double exponential increase against the EV concentration in saliva. All of the measurements are conducted at 25.0 ± 0.1 °C. The error in concentration (f) is assumed to be 10%, likely an overestimate.
Figure 4
Figure 4
Detection of two natural EV subpopulations expressing CD9 and CD81 antigens on their surface, measured in saliva. The experiments are performed on a drop of unprocessed saliva samples from two healthy individuals. The cantilevers are functionalized as described in Figure 3 but with antibodies (Ab) to the targeted tetraspanin (see Experimental Section). The control probes (black) are coated only with the antifouling DPPC bilayer. As for model EVs, the mass uptake is rapid over the first 5–10 min and can be suitably analyzed imposing the same time scales as in Figure 3. The control is analyzed with a single exponential yielding in both cases a characteristic time scale of ∼550 s (see Supporting Information sections 6 for details). Experiments with anti-CD9 and anti-CD81 Abs were repeated twice for each sample with the average shown in the figure.

Similar articles

References

    1. Jameson J. L; Fauci A.; Kasper D. L.; Hauser S. L.; Longo D. L.; Loscalzo J.. Harrison’s Principles of Internal Medicine, 20th ed; McGraw Hill, 2018.
    1. Nass R. D.; Sassen R.; Elger C. E.; Surges R. The Role of Postictal Laboratory Blood Analyses in the Diagnosis and Prognosis of Seizures. Seizure 2017, 47, 51–65. 10.1016/j.seizure.2017.02.013. - DOI - PubMed
    1. Yamamoto C.; Nagashima S.; Isomura M.; Ko K.; Chuon C.; Akita T.; Katayama K.; Woodring J.; Hossain M. S.; Takahashi K.; Tanaka J. Evaluation of the Efficiency of Dried Blood Spot-Based Measurement of Hepatitis B and Hepatitis C Virus Seromarkers. Sci. Rep. 2020, 10 (1), 3857.10.1038/s41598-020-60703-1. - DOI - PMC - PubMed
    1. Li S.; Noor Z. S.; Zeng W.; Stackpole M. L.; Ni X.; Zhou Y.; Yuan Z.; Wong W. H.; Agopian V. G.; Dubinett S. M.; Alber F.; Li W.; Garon E. B.; Zhou J. X. Sensitive Detection of Tumor Mutations from Blood and Its Application to Immunotherapy Prognosis. Nat. Commun. 2021, 12 (1), 4172.10.1038/s41467-021-24457-2. - DOI - PMC - PubMed
    1. Akbar N.; Azzimato V.; Choudhury R. P.; Aouadi M. Extracellular Vesicles in Metabolic Disease. Diabetologia 2019, 62 (12), 2179–2187. 10.1007/s00125-019-05014-5. - DOI - PMC - PubMed