. 2024 Jan 9;19(1):112-125.
doi: 10.1016/j.stemcr.2023.11.011. Epub 2023 Dec 28.

C/EBPβ-induced lymphoid-to-myeloid transdifferentiation emulates granulocyte-monocyte progenitor biology

Affiliations

C/EBPβ-induced lymphoid-to-myeloid transdifferentiation emulates granulocyte-monocyte progenitor biology

Linh Thuy Nguyen et al. Stem Cell Reports. .

Abstract

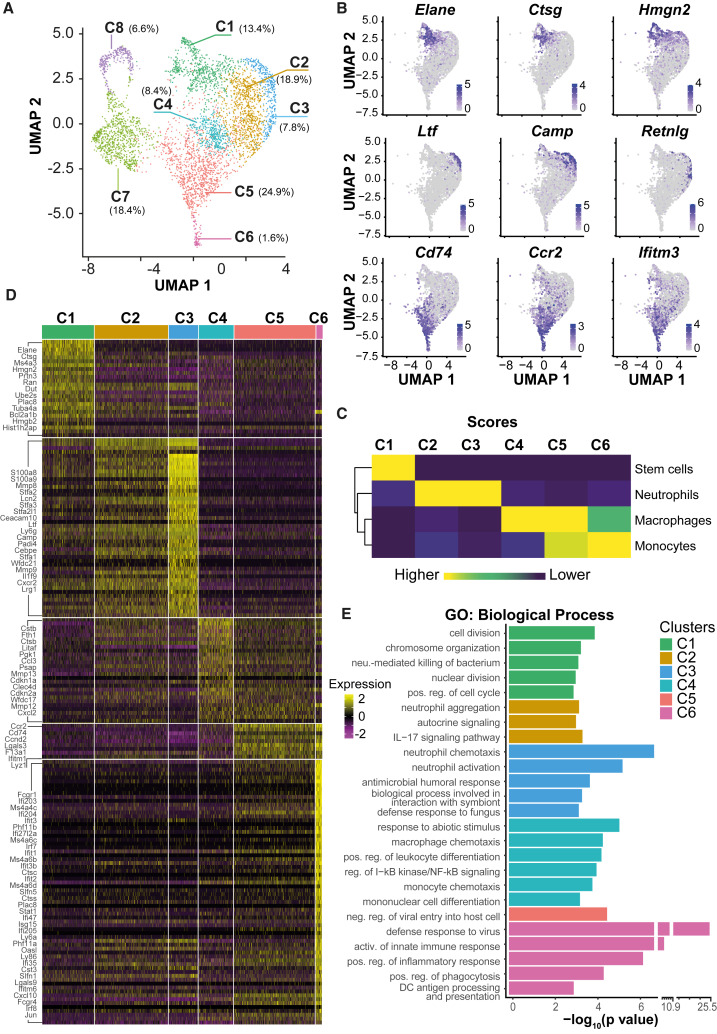
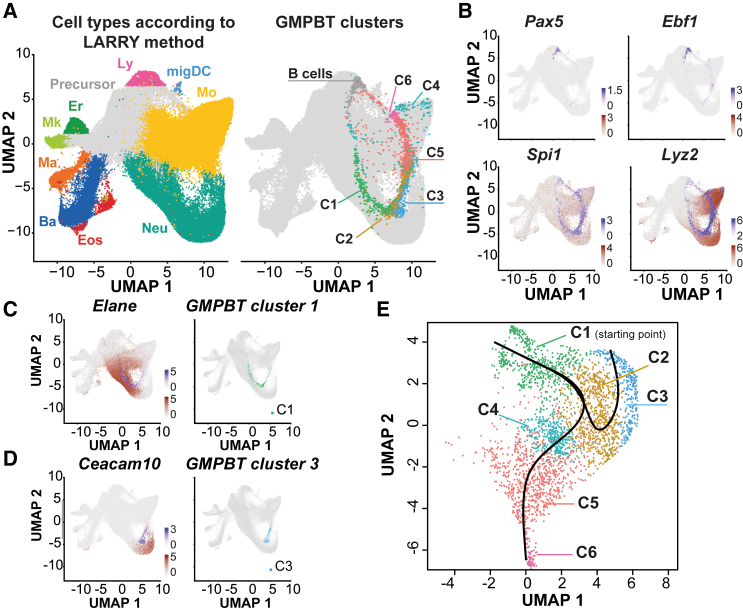
CCAAT/enhancer-binding protein beta (C/EBPβ) induces primary v-Abl immortalized mouse B cells to transdifferentiate (BT, B cell transdifferentiation) into granulocyte-macrophage progenitor-like cells (GMPBTs). GMPBTs maintain cytokine-independent self-renewal, lineage choice, and multilineage differentiation. Single-cell transcriptomics demonstrated that GMPBTs comprise a continuum of myelomonopoietic differentiation states that seamlessly fit into state-to-fate maps of normal granulocyte-macrophage progenitors (GMPs). Inactivating v-Abl kinase revealed the dependence on activated CSF2-JAK2-STAT5 signaling. Deleting IRF8 diminished monopoiesis and enhanced granulopoiesis while removing C/EBPβ-abrogated self-renewal and granulopoiesis but permitted macrophage differentiation. The GMPBT culture system is easily scalable to explore the basics of GMP biology and lineage commitment and largely reduces ethically and legislatively debatable, labor-intensive, and costly animal experiments.

Keywords: 3R principles; C/EBP; GMP; cell fate; granulocyte-macrophage progenitor; hematopoiesis; leukemia; myelopoiesis; transdifferentiation.


Conflict of interest statement

Declaration of interests The authors declare no competing interests.

Figures

None
Graphical abstract
Figure 1
Figure 1
Granulocyte and macrophage lineage capacity of GMPBTs (A) WT B cells were retrovirally transduced with Cebpb-LAP. 6 days post infection (p.i.), cells were subjected to scRNA-seq. Dimension reduction (uniform manifold approximation and projection, UMAP) and clustering of 3,297 cells identified 8 clusters. Percentages of cells in clusters are indicated. (B) Feature plots of myeloid gene expression. Neu-specific genes are expressed in 3 different clusters (cluster 1: Elane, Ctsg, and Hmgn2; clusters 2 and 3: Ltf, Camp, and Retnlg). Monocyte/macrophage-specific genes are expressed in clusters 4, 5, and 6 (Cd74, Ccr2, and Ifitm3). (C) Cell type annotation of clusters 1–6 using the SingleR and ImmGen databases as reference. The annotation with the highest score is shown for each cluster. (D) Heatmap of differentially expressed marker genes (rows) of myeloid clusters 1–6 (columns). Genes with corrected p < 0.05 and |FC| (fold change) > 2 are shown in the heatmap; representative genes are listed on the left. A table of all genes contained in the heatmap is provided in Table S1. (E) Gene ontology (GO) enrichment for marker genes (|FC| > 1.5, adjusted p < 0.05) of myeloid clusters 1–6 using gProfiler. GO terms of “biological processes” are shown; redundant terms were excluded. For a complete list of GO terms enriched in each cluster, see Table S2. Color code as indicated in (A) and (D).
Figure 2
Figure 2
The GMPBT transcriptome reflects the fate-transitioning landscape of GMP differentiation (A) Integration of GMPBT scRNA profiling data with lineage-traced mouse bone marrow cell data according to Weinreb et al. (2020). scRNA-seq data from LARRY-traced mouse bone marrow were used as a reference; the GMPBT data were projected as a query. Cell types identified in the reference are indicated by color (left). The UMAP of integrated data is shown on the right, with reference data shown in gray and GMPBT clusters overlayed. Color of GMPBT clusters as in Figure 1A. (B) Expression of Pax5 and Ebf1, marking B cell clusters (top), and expression of Spi1 and Lyz2, marking myeloid clusters (bottom). The expression of these genes in the reference dataset and in the GMPBTs is presented in brown and purple, respectively. (C and D) Expression of Elane and Ceacam10 in the reference dataset (brown) and GMPBTs (purple) is shown as merged plots on the left. Shown on the right are GMPBT cluster 1 and cluster 3. (E) Trajectory analysis of the myeloid clusters 1–6 using Slingshot. Based on the expression of proliferation genes, cluster 1 (C1) was designated as the starting point. Two differentiation trajectories are shown.
Figure 3
Figure 3
Function of IRF8 and C/EBPβ-LAP on GMPBT subpopulations (A) TF analysis using LISA on differentially expressed genes between two groups: Neu C1, C2, and C3 and monocyte/macrophage C4, C5, and C6 (adjusted p < 0.05, |FC| > 1.2). (B) Comparison of transdifferentiated Irf8fl/fl and Irf8 KO B cells. Irf8 KO clones (n = 4) and isogenic Irf8fl/fl control clones (n = 3) were examined after retroviral expression of Cebpb-LAP. Cells were subjected to flow cytometry analysis using antibodies directed to CD11b, Ly6G, and CD115. Flow cytometry parameters were gated as in Figure S1A. The graph shows percentages of the 3 GMPBT subpopulations: GMP-like cells (Ly6GCD115, double negative [DN], black bars, left y axis), granulocytes/Neus (Ly6G+, orange bars, right y axis), and monocytes/macrophages (CD115+, blue bars, right y axis). Data are mean ± SD from independent experiments, unpaired t tests, ∗∗p < 0.01, p < 0.05; insignificance is not indicated. (C) De-stabilization of LAP-FKBP12F36V by dTAG increased CD115+ cells and abrogated DN cells in GMPBT cultures. Shown are the kinetics and distribution of the CD115+ population (red line) and the CD115/Ly6G population (DN, red dashed line) of GMPBTs upon targeted proteolysis of LAP-FKBP12F36V by dTAG-13. Note that CD115+ monocytes increase from approximately 15% to 95%, while DN cells disappear during dTAG treatment. No effects on the CD115+ population are seen by treatment with FK506 or AP1867. Flow cytometry analysis was performed at 4 time points as indicated (n = 2, duplicates are shown, gating as shown in Figure S1A). (D) Stabilization of LAP-FKBP12F36V by AP1867 or FK506 leads to an increase in Ly6G+ cells in GMPBT cultures (from approximately 3% to 9%–13%), while dTAG abrogated Ly6G+ cells. Flow cytometry analysis was performed at 4 time points as indicated (n = 2, duplicates are shown, gating as shown in Figure S1A). The experiments shown in (C) and (D) were done in parallel, starting with the same GMPBT cultures. Drug treatments are shown on the right. No treatment, gray triangles; AP1867 treatment, green squares; FK506 treatment, blue dots; dTAG treatment, red dots.
Figure 4
Figure 4
Cytokine signaling and v-Abl dependency of GMPBTs (A) Cell viability/proliferation as determined by WST-1 colorimetric assay of GMPBTs treated with various concentrations of the v-Abl kinase inhibitor imatinib (n = 3, sigmoidal curve fit, four-parameter logistic, R2 = 0.97). Viability of cells was determined 48 h post treatment. (B) Survival of GMPBTs treated with imatinib and supplemented with cytokines as indicated. Cells were seeded at 1 × 105 cells (indicated by a gray line), and viable cells were counted after 48 h (toluidine blue exclusion, n = 4, data are shown as mean of independent cell counts from microscopic inspection). Control groups without cytokine supplementation are highlighted on a magenta background on the right. (C) Titration of CSF1 (M-CSF, red), CSF2 (GM-CSF, green), and CSF3 (G-CSF, brown) in the presence of imatinib (0.6 μM). Cell proliferation and viability were measured after 48 h as determined by WST-1 colorimetric assay (n = 3, sigmoidal curve fit, four-parameter logistic, R2 = 0.93). p values of data interpolation: CSF1, p = 0.056; CSF2, p = 0.0001; CSF3, p = 0.022. (D) Morphology of GMPBTs with or without imatinib and cytokine treatment, as indicated on the left. Phase-contrast (cell culture samples) and May-Grünwald-Giemsa staining (cytospins) on day 3 post treatment. Arrows indicate cells with macrophage morphology (enlarged and extended cell body and vacuoles), and asterisks indicate cells with Neu morphology (ring-shaped or lobular nuclei, azurophilic cytoplasmic granules). Controls are shown in the bottom row, including GMPBTs treated with imatinib (apoptotic cells, left), stained cytospins of GMP cells isolated from WT mouse bone marrow (LincKit+Sca-1Fcgr3+Ly-6C, center), and GMP cells treated with CSF2 for 2 days in culture (right). Scale bar, 50 μm. (E) Ruxolitinib sensitivity of GMPBTs. GMPBTs were treated with ruxolitinib (an inhibitor of Jak2) in the presence or absence of imatinib (an inhibitor of v-Abl). Ruxolitinib sensitivity emerged only in the presence of imatinib and CSF2 (CSF2, 10 ng/mL; imatinib, 0.6 μM, black line) but not in the absence of imatinib (green line), indicating that Jak2 and v-Abl are functionally redundant in GMPBTs. Viability of cells was determined 48 h post treatment using a WST-1 colorimetric cell viability assay (n = 4, sigmoidal curve fit, four-parameter logistic, R2 = 0.96). (F) Viability of imatinib treated GMPBTs supplemented with various retrovirally delivered conditional STAT5 TF constructs. Conditional 4-hydroxytamoxifen (4-OHT)-dependent activation of WT STAT5, a constitutively active STAT5 mutant (cS5), an inactive STAT5 mutant (D749), or vector as a negative control is shown at the top of each bar graph. CSF2-imatinib-treated GMPBTs served as a positive control. Viability of cells was determined 48 h post treatment using a WST-1 colorimetric cell viability assay. Dashed lines indicate viability of cells prior to treatment. Data are mean ± SD from four independent experiments; one-way ANOVA with Turkey’s multiple comparisons tests, ∗∗∗∗p < 0.0001; ns, not significant. (G) Schematic representation of the CSF2-JAK2-STAT5 signaling. CRM, cis-regulatory module.

Similar articles

Cited by

References

    1. Arendt D., Musser J.M., Baker C.V.H., Bergman A., Cepko C., Erwin D.H., Pavlicev M., Schlosser G., Widder S., Laubichler M.D., Wagner G.P. The origin and evolution of cell types. Nat. Rev. Genet. 2016;17:744–757. - PubMed
    1. Becher B., Tugues S., Greter M. GM-CSF: From Growth Factor to Central Mediator of Tissue Inflammation. Immunity. 2016;45:963–973. - PubMed
    1. Bornstein C., Winter D., Barnett-Itzhaki Z., David E., Kadri S., Garber M., Amit I. A negative feedback loop of transcription factors specifies alternative dendritic cell chromatin States. Mol. Cell. 2014;56:749–762. - PMC - PubMed
    1. Bussmann L.H., Schubert A., Vu Manh T.P., De Andres L., Desbordes S.C., Parra M., Zimmermann T., Rapino F., Rodriguez-Ubreva J., Ballestar E., Graf T. A robust and highly efficient immune cell reprogramming system. Cell Stem Cell. 2009;5:554–566. - PubMed
    1. Carlesso N., Frank D.A., Griffin J.D. Tyrosyl phosphorylation and DNA binding activity of signal transducers and activators of transcription (STAT) proteins in hematopoietic cell lines transformed by Bcr/Abl. J. Exp. Med. 1996;183:811–820. - PMC - PubMed