. 2024 Jan 9;57(1):124-140.e7.
doi: 10.1016/j.immuni.2023.11.018. Epub 2023 Dec 28.

Circulating NK cells establish tissue residency upon acute infection of skin and mediate accelerated effector responses to secondary infection

Affiliations

Circulating NK cells establish tissue residency upon acute infection of skin and mediate accelerated effector responses to secondary infection

Tommaso Torcellan et al. Immunity. .

Abstract

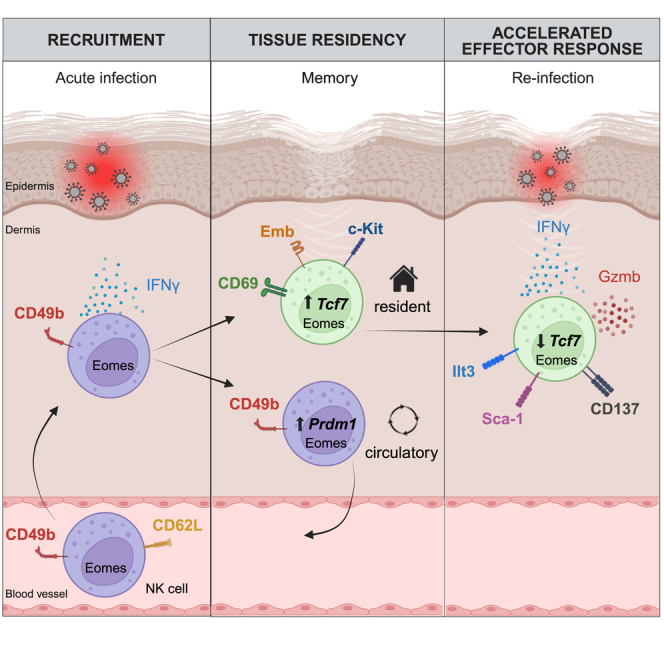
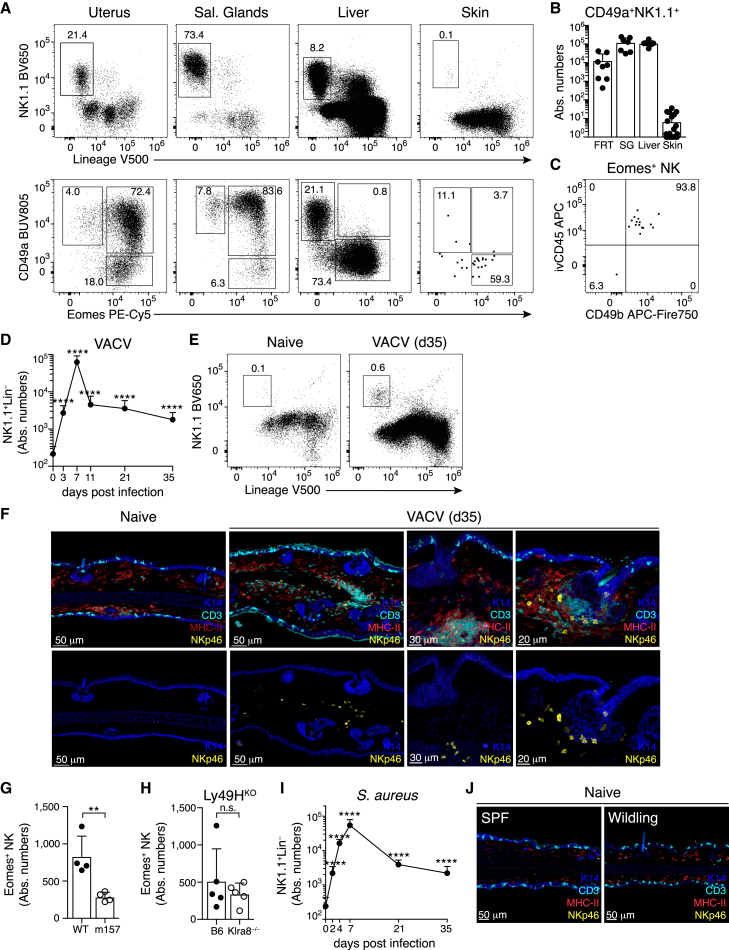
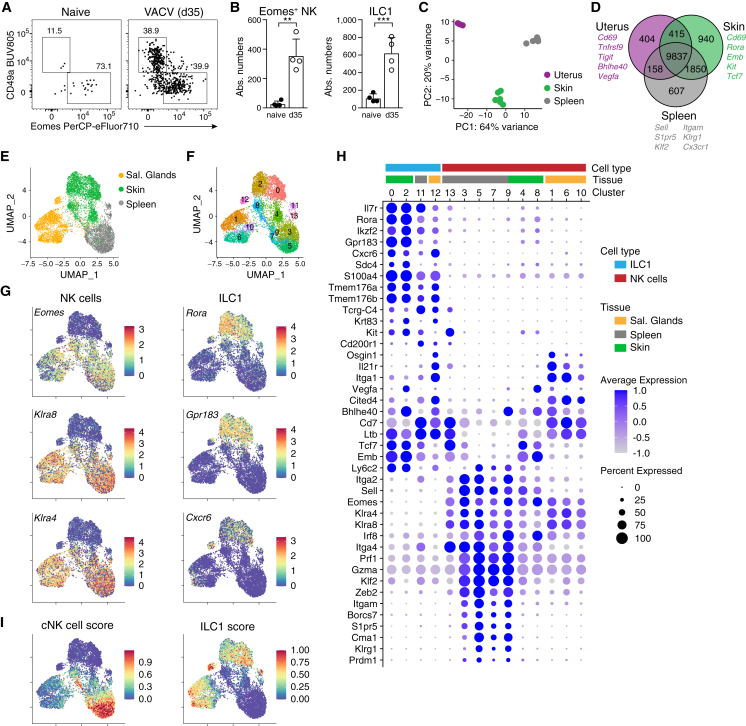
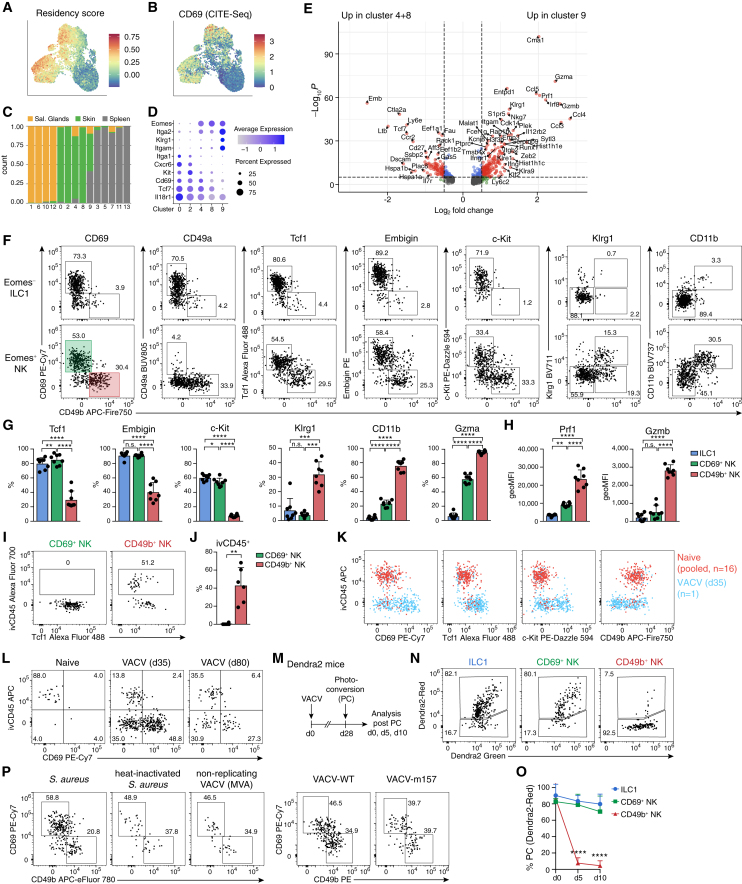
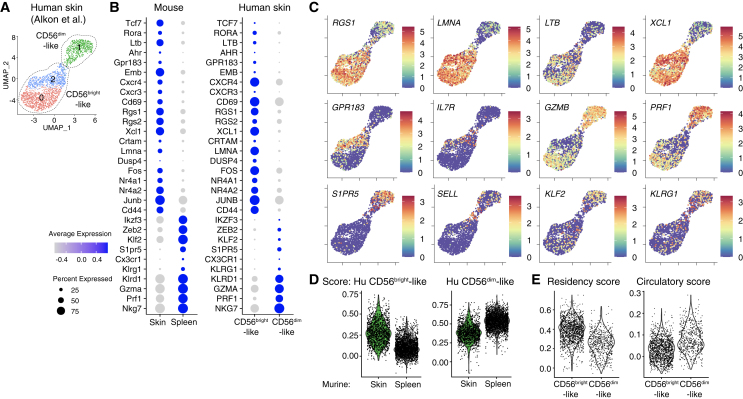
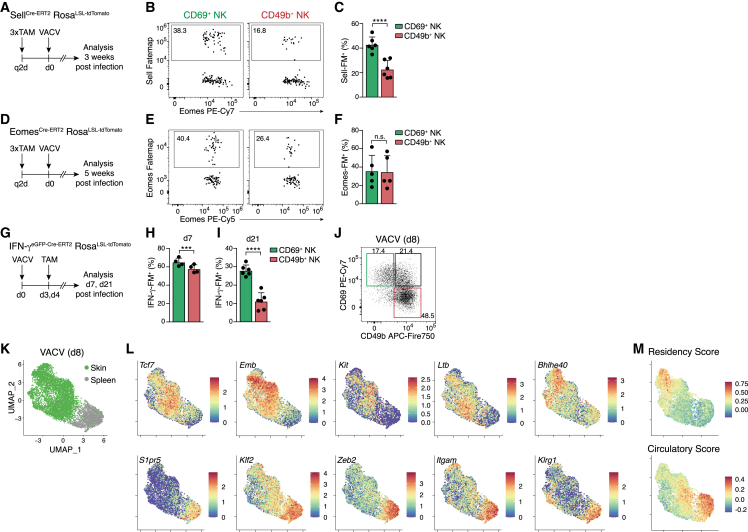
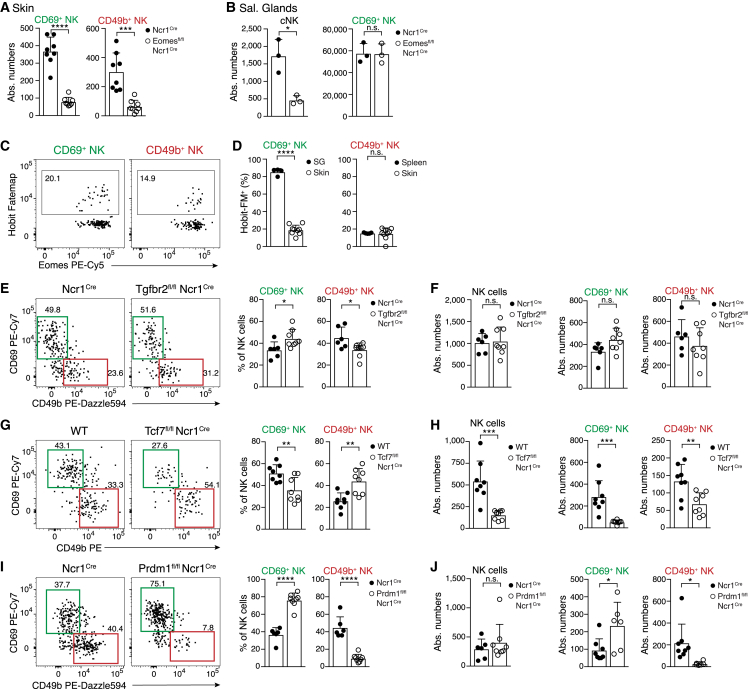
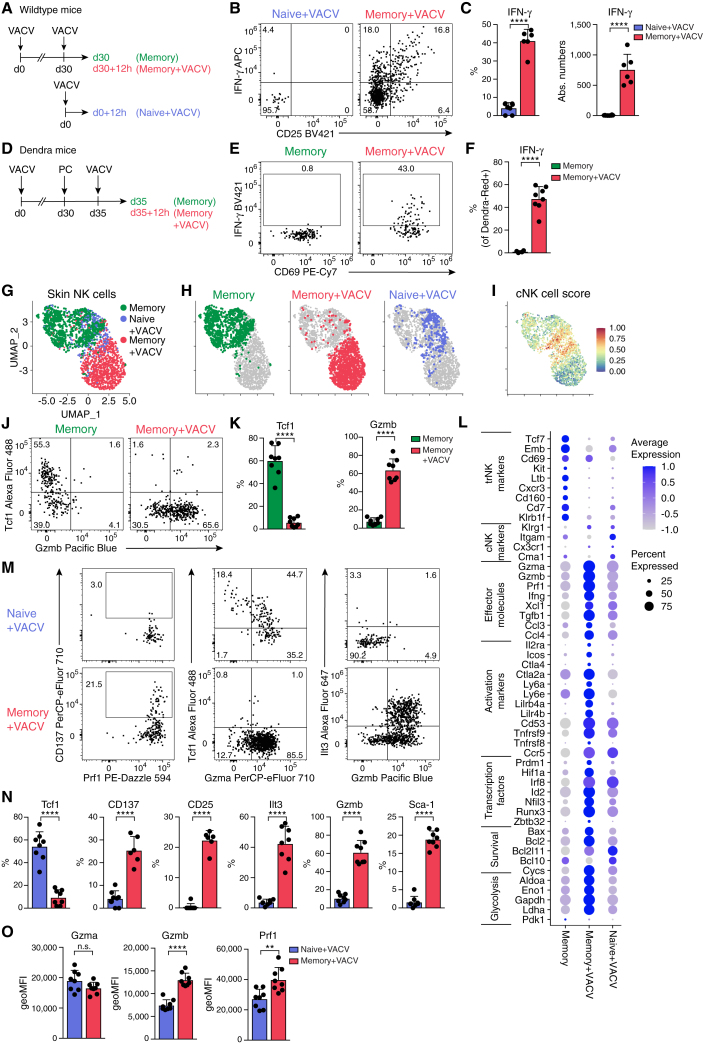
Natural killer (NK) cells are present in the circulation and can also be found residing in tissues, and these populations exhibit distinct developmental requirements and are thought to differ in terms of ontogeny. Here, we investigate whether circulating conventional NK (cNK) cells can develop into long-lived tissue-resident NK (trNK) cells following acute infections. We found that viral and bacterial infections of the skin triggered the recruitment of cNK cells and their differentiation into Tcf1hiCD69hi trNK cells that share transcriptional similarity with CD56brightTCF1hi NK cells in human tissues. Skin trNK cells arose from interferon (IFN)-γ-producing effector cells and required restricted expression of the transcriptional regulator Blimp1 to optimize Tcf1-dependent trNK cell formation. Upon secondary infection, trNK cells rapidly gained effector function and mediated an accelerated NK cell response. Thus, cNK cells redistribute and permanently position at sites of previous infection via a mechanism promoting tissue residency that is distinct from Hobit-dependent developmental paths of NK cells and ILC1 seeding tissues during ontogeny.

Keywords: Staphylococcus aureus; infection; innate immune memory; innate lymphoid cells; natural killer cells; tissue immunity; tissue-resident lymphocytes; trained immunity; vaccination; vaccinia virus.


Conflict of interest statement

Declaration of interests The authors declare no competing interests.

Figures

None
Graphical abstract
Figure 1
Figure 1
Group 1 ILCs are rare in the skin of naive mice and expand after local infection (A) Representative FACS plots showing CD45+ live (top) and LinNK1.1+ gated cells (bottom) in the indicated organs. (B) Absolute numbers of CD49a+NK1.1+ NK cells. (C) Representative FACS plot showing Eomes+ NK cells in naive ear skin after intravascular labeling with anti-CD45 (ivCD45). (D, E, and I) Numbers (D and I) and representative gating (E) of LinNK1.1+ cells in ear skin of mice infected with vaccinia virus expressing m157 (VACV) or S. aureus at the indicated times post infection. (F and J) Confocal immunofluorescence images of skin cryosections from naive or VACV-infected mice housed in SPF (F) or wildling conditions (J). Scale bars represent 20 μm, 30 μm, or 50 μm, as indicated. (G and H) Numbers of Eomes+ NK cells in the skin of individual ears on day 30 pi of B6 mice with WT or m157-expressing vaccinia virus (G) or of B6 versus Ly49H-deficient (Klra8−/−) mice with VACV (H). Data in (B), (D), and (I) were pooled from n = 6–8 mice (B), n = 7–23 ears (D), or n = 4–17 ears (I) per organ or time point. Data in (A), (C), (E)–(H), and (J) are representative of three independent experiments with n = 3–5 mice (A) or n = 3–6 ears (C, E–H, and J) per group. Error bars indicate mean + SD. p values were calculated by unpaired Student’s t test. ∗∗p < 0.01 and ∗∗∗∗p < 0.0001. n.s., not significant. See also Figure S1.
Figure 2
Figure 2
Infection induces NK cells with a program of tissue-resident cells (A and B) Representative FACS plots (A) and numbers of LinNK1.1+ pregated CD49aEomes+ NK cells and CD49a+Eomes ILC1s (B) in naive versus VACV-infected ears on day 35 pi. (C and D) mRNA-sequencing analysis of LinNK1.1+Cxcr6 NK cells sorted from naive (uterus) or VACV-infected mice on day 35 pi (spleen and skin). (C) Euclidean distance of samples visualized by principal-component analysis. (D) Venn diagram showing numbers and examples of shared and differentially expressed genes. (E–I) scRNA-seq analysis of LinNK1.1+ cells sorted on day 25 post VACV infection from indicated organs, pooled from n = 5–10 individual mice each. UMAP visualization of tissue of origin (E), identified clusters (F), selected marker genes delineating NK cells and ILC1s (G), and scores based on the top 100 DEGs between NK cells and ILC1s (I). (H) Bubble plot representation of Z score of selected marker gene expression. Data are representative of three (A and B) or two (E–I) independent experiments with n = 4–18 ears per group. Error bars indicate mean + SD. p values were calculated by unpaired Student’s t test. ∗∗p < 0.01 and ∗∗∗p < 0.001. See also Figure S2.
Figure 3
Figure 3
Identification of Tcf1hiCD69hi skin-resident NK cells (A–E) scRNA-seq analysis of LinNK1.1+ cells on day 25 post VACV infection as in Figure 2. (A and B) UMAP of a score based on genes associated to tissue-resident memory T cells (A) and of CD69 protein expression by CITE-seq (B). (C) Bar graph showing tissue contribution to each cluster in Figure 2F. (D) Bubble plot representation of Z score of selected marker genes in selected NK cell clusters. (E) Volcano plot showing DEGs between indicated clusters (cellular transcriptomes of skin origin only). (F–H) Representative FACS plots of Eomes ILC1s and Eomes+ NK cells (F), frequency (G), and geometric mean of fluorescence intensity (geoMFI) (H) of indicated protein expression within indicated cell subsets 4 weeks post infection with VACV. (I and J) Representative FACS plots (I) and frequency (J) of intravascular (i.v. anti-CD45-labeled) NK cell subsets. (K and L) Comparative marker expression and i.v. anti-CD45 label of ear skin NK cells from 16 pooled naive (red, 260 cells) or 1 representative VACV-WT infected (blue, 345 cells) ear skins on day 35 pi (K) and from naive or VACV-WT infected skin on day 35 and day 80 pi (L). (M–O) Photoactivation of VACV-infected skin on day 28 pi of Dendra2 mice. Experimental design (M), representative FACS analysis (N), and frequency (O) of Dendra2Red+ label-retaining photoconverted cells within indicated subsets of cells analyzed 30 min (day 0), and 5 and 10 days post photoactivation. (P) Representative FACS plots of skin NK cell subsets at memory time points post infection with S. aureus, heat-inactivated S. aureus, VACV-WT, or non-replicating VACV (MVA). Data are representative of two (A–E and P) or three (F–N and O) independent experiments with n = 6 (J) or n = 8 (F–H) ears per group. FACS plots in (I) and (N) are pooled from n = 3 (I) or n = 5 (N) ears. Data in (O) are pooled from n = 2 (day 0) or n = 8 (days 5 and 10) skins from 2 independent experiments. Error bars indicate mean + SD. p values were calculated by paired one-way ANOVA (G and O) or paired Student’s t test (J). p < 0.05, ∗∗p < 0.01 and ∗∗∗∗p < 0.0001; n.s., not significant. See also Figure S3.
Figure 4
Figure 4
Tcf1hiCD69hi NK cells share similarities with NK cells present in human skin Analysis of single-cell gene expression of NK cells in human skin (data generated by Alkon et al.32). (A) UMAP showing re-clustering of NK cell clusters 0 and 3 from Figure S4A. (B) Bubble plot representation of Z score of selected marker genes in murine (skin and spleen on day 25 pi, left) and human skin NK cells (CD56bright- and CD56dim-like subsets, right). (C) UMAP representation of selected marker gene expression of human skin NK cells. (D and E) Visualization of scores of gene expression in murine NK cells (D) and in human skin NK cell subsets (E). Scores were calculated based on genes significantly upregulated in indicated human skin NK cells, and then used to analyze murine NK cells (D) or based on genes associated to tissue-resident memory of T cells, as in Figure 3A, and then used to analyze human skin NK cells (E). See also Figure S4.
Figure 5
Figure 5
CD62L+ Eomes+ IFN-γ-producing effector cells give rise to Tcf1hi tissue-resident memory NK cells (A, D, and G) Experimental design. (B, C, E, F, and H–J) Representative FACS plots and bar graphs show fate-map (FM) labeling of indicated NK cell subsets in the skin of Sell-FM (B and C), Eomes-FM (E and F), IFN-γ-FM (H and I), or WT mice (J) at the indicated time points post infection. (K–M) scRNA-seq analysis of spleen and skin NK cells sorted on day 8 post VACV infection, pooled from n = 5 individual mice. UMAP visualization of cell origin (K), expression of selected genes (L), and scores calculated as in Figure 4E (M). Data in (B), (C), (F), and (H)–(J) are representative of three (B, C, F, I, and J) or two (H) independent experiments with n = 4 (H), n = 5 (F), or n = (B, C, and I) skins per group. Data in (E) were pooled from n = 5 skins and are representative of two independent experiments. Error bars indicate mean + SD. p values were calculated by paired Student’s t test. ∗∗∗p < 0.001 and ∗∗∗∗p < 0.0001; n.s., not significant. See also Figure S5.
Figure 6
Figure 6
Differential transcription factor requirements of skin-resident and circulating NK cells (A and B) Numbers of indicated NK cell subsets in skin on day 30 post VACV infection (A) or in SGs of naive Eomesfl/fl Ncr1cre or control mice (B). (C and D) Representative FACS plots (C) and frequency (D) of fate-map (FM) labeling of indicated NK cell subsets in Hobit-FM mice on day 30 post VACV infection. (E–J) Representative FACS plots (E, G, and I) and frequency and absolute numbers (F, H, and J) of indicated NK cell subsets in the skin of Tgfbr2fl/fl Ncr1cre (E and F), Tcf7fl/fl Ncr1cre (G and H), and Prdm1fl/fl Ncr1cre (I and J) and indicated control mice. Mice were analyzed at >3 weeks pi, and data are representative of three independent experiments with n = 6–8 (A, D, and E–J) skins, n = 3 (B), or n = 4 (C) mice per group. Error bars indicate mean + SD. p values were calculated by unpaired Student’s t test. p < 0.05, ∗∗p < 0.01, ∗∗∗p < 0.001, and ∗∗∗∗p < 0.0001; n.s., not significant. See also Figure S6.
Figure 7
Figure 7
Accelerated effector response of skin-resident NK cells during secondary infection (A–C and G–N) (A) Experimental design for (B), (C), and (G)–(N). Representative FACS plots (B and J) and frequency and absolute numbers of skin NK cells expressing indicated proteins (C and K). (D–F) Photoactivation of VACV-WT-infected skin in Dendra2 mice. Experimental design (D), representative FACS plots (E), and frequency of IFN-γ-producing Dendra2Red+ label-retaining skin NK cells (F). (G–I and L) scRNA-seq analysis of sorted skin NK cells, experimental setup as in (A). (G–I) UMAP visualization of analyzed conditions and cNK cell score calculated as in Figure 2I. (L) Bubble plot representation of Z score of selected marker gene expression. (M–O) Representative FACS plots (M), frequency (N), and geometric mean of fluorescence intensity (geoMFI) (O) of skin NK cells expressing indicated proteins. Data are representative of three (B, C, J, K, M, and N) or two (E and F) independent experiments with n = 6–8 ears per group. Error bars indicate mean + SD. p values were calculated by unpaired Student’s t test. ∗∗p < 0.01 and ∗∗∗∗p < 0.0001; n.s., not significant. See also Figure S7.

Comment in

References

    1. Mujal A.M., Delconte R.B., Sun J.C. Natural killer cells: from innate to adaptive features. Annu. Rev. Immunol. 2021;39:417–447. - PubMed
    1. Zimmer C.L., Cornillet M., Solà-Riera C., Cheung K.W., Ivarsson M.A., Lim M.Q., Marquardt N., Leo Y.S., Lye D.C., Klingström J., et al. NK cells are activated and primed for skin-homing during acute dengue virus infection in humans. Nat. Commun. 2019;10:3897. - PMC - PubMed
    1. Cortez V.S., Cervantes-Barragan L., Robinette M.L., Bando J.K., Wang Y., Geiger T.L., Gilfillan S., Fuchs A., Vivier E., Sun J.C., et al. Transforming growth factor-β signaling guides the differentiation of innate lymphoid cells in salivary glands. Immunity. 2016;44:1127–1139. - PMC - PubMed
    1. Nixon B.G., Chou C., Krishna C., Dadi S., Michel A.O., Cornish A.E., Kansler E.R., Do M.H., Wang X., Capistrano K.J., et al. Cytotoxic granzyme C-expressing ILC1s contribute to antitumor immunity and neonatal autoimmunity. Sci. Immunol. 2022;7:eabi8642. - PMC - PubMed
    1. Dogra P., Rancan C., Ma W., Toth M., Senda T., Carpenter D.J., Kubota M., Matsumoto R., Thapa P., Szabo P.A., et al. Tissue determinants of human NK cell development, function, and residence. Cell. 2020;180:749–763.e13. - PMC - PubMed

Publication types