. 2023 Dec 29;7(3):e202302524.
doi: 10.26508/lsa.202302524. Print 2024 Mar.

Sterile protection against P. vivax malaria by repeated blood stage infection in the Aotus monkey model

Affiliations

Sterile protection against P. vivax malaria by repeated blood stage infection in the Aotus monkey model

Nicanor Obaldía 3rd et al. Life Sci Alliance. .

Abstract

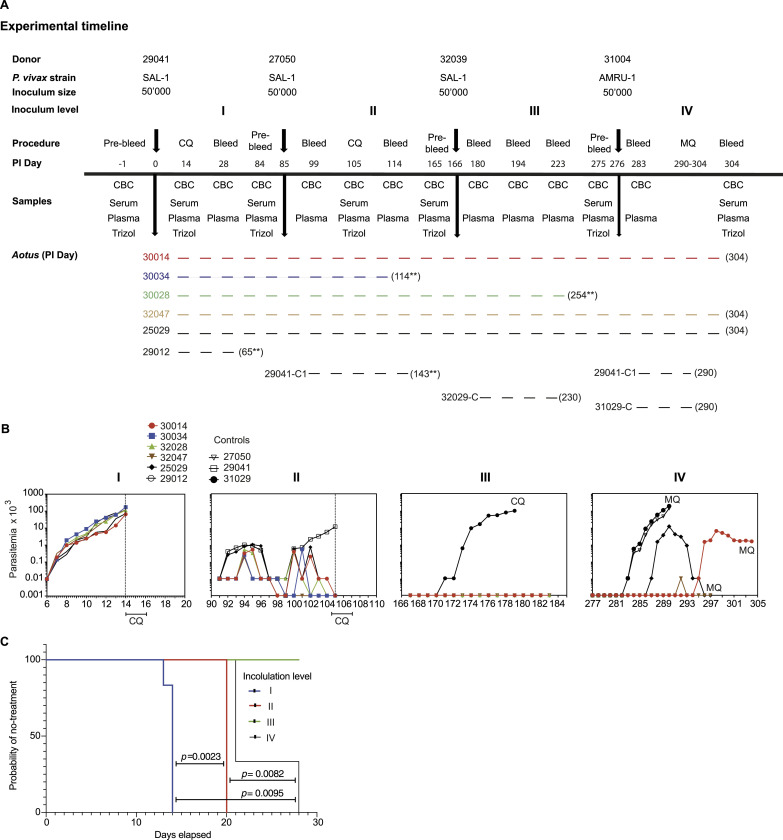
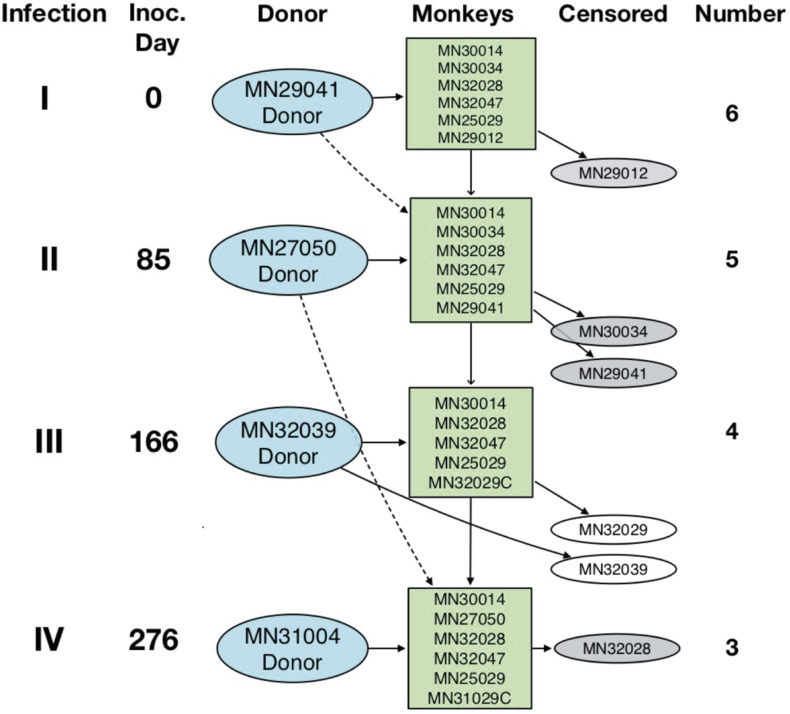
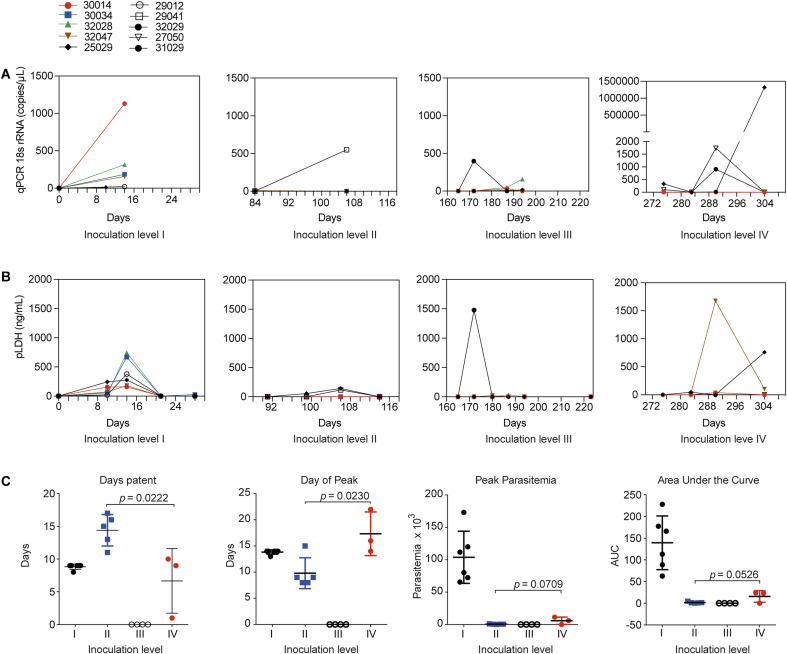
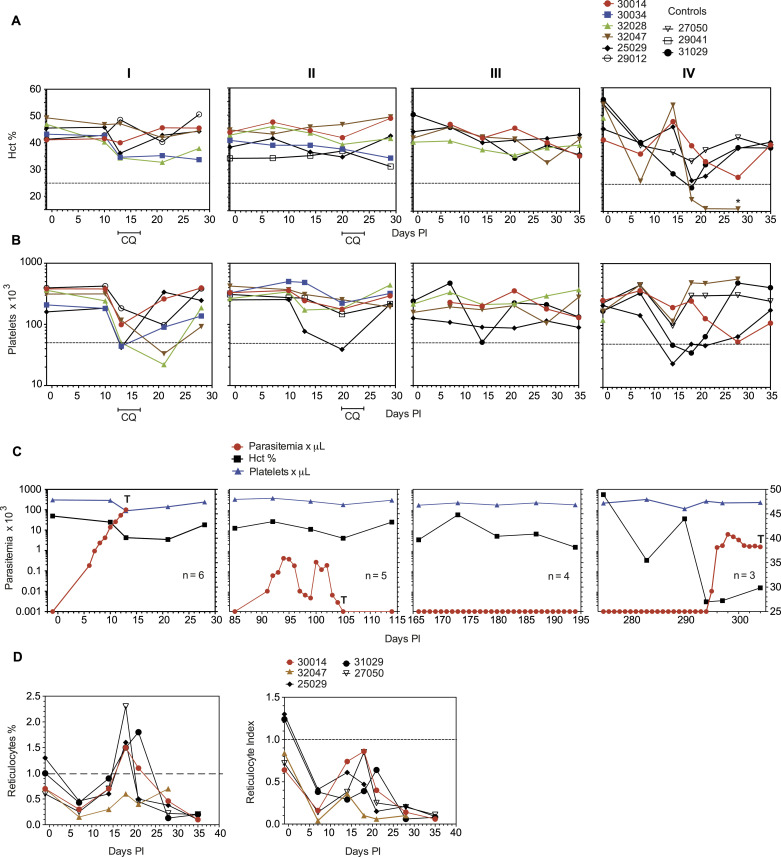
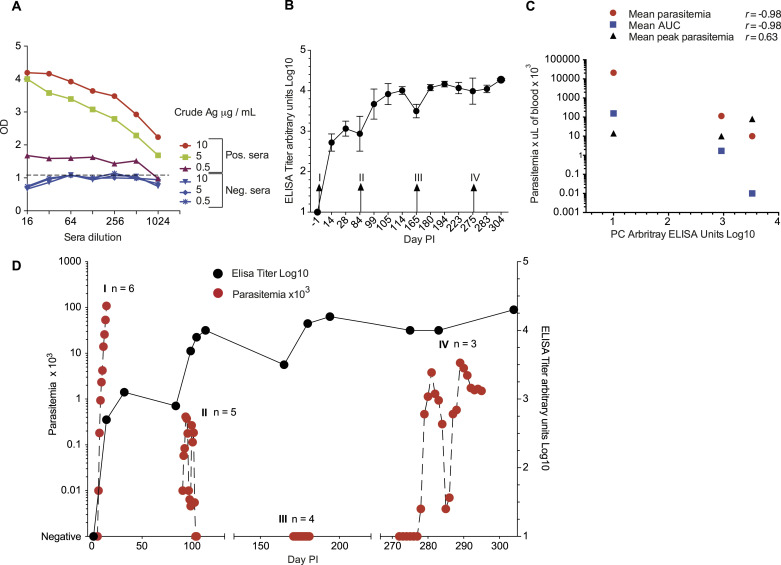
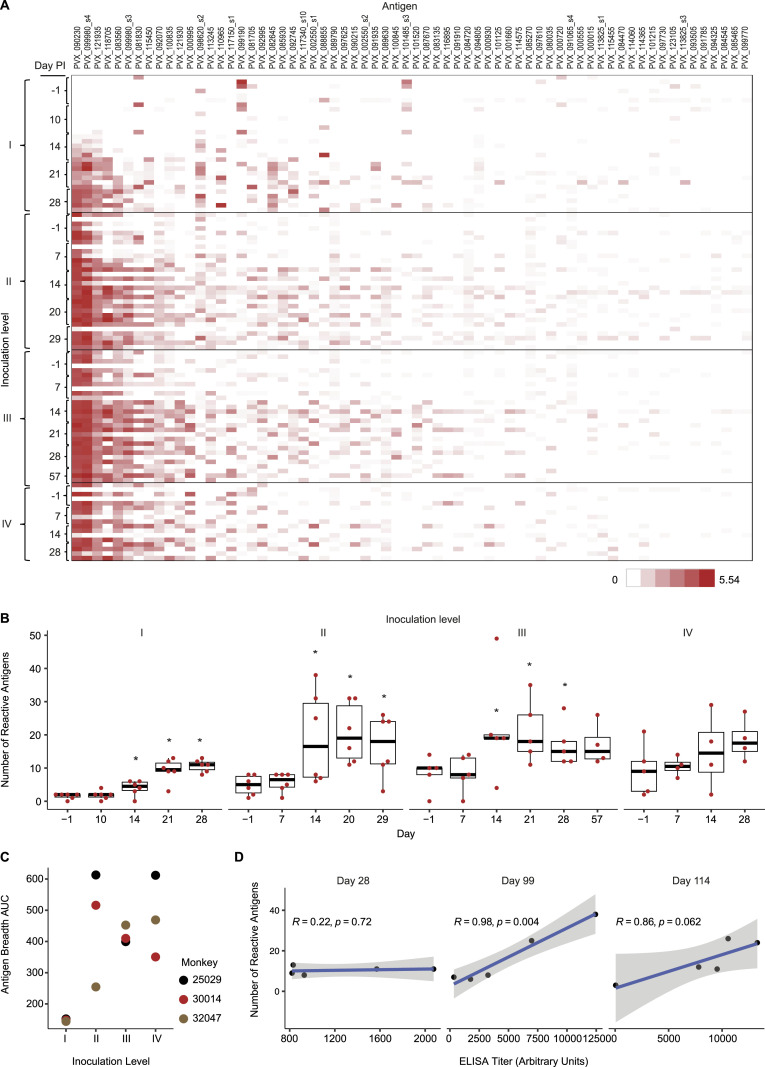
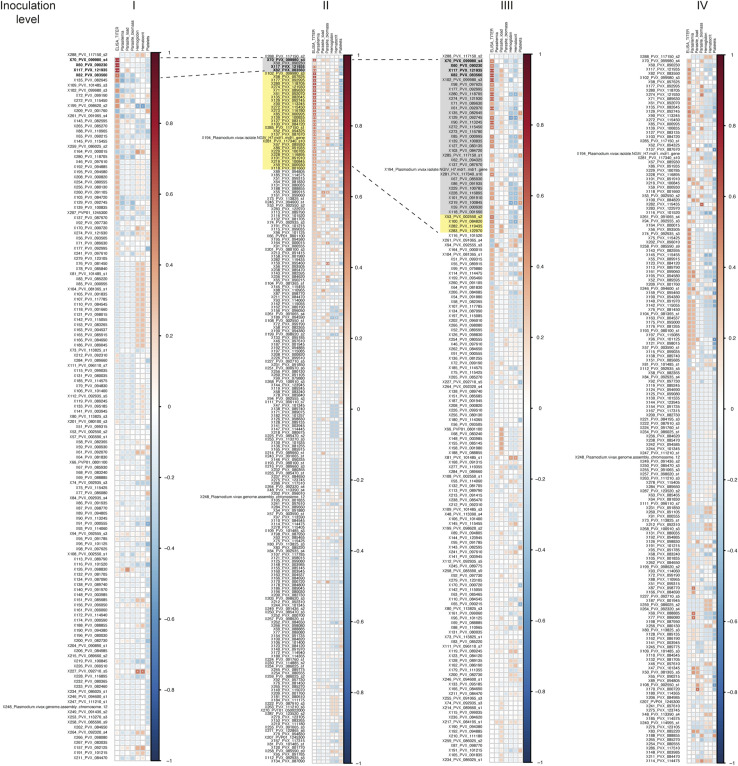
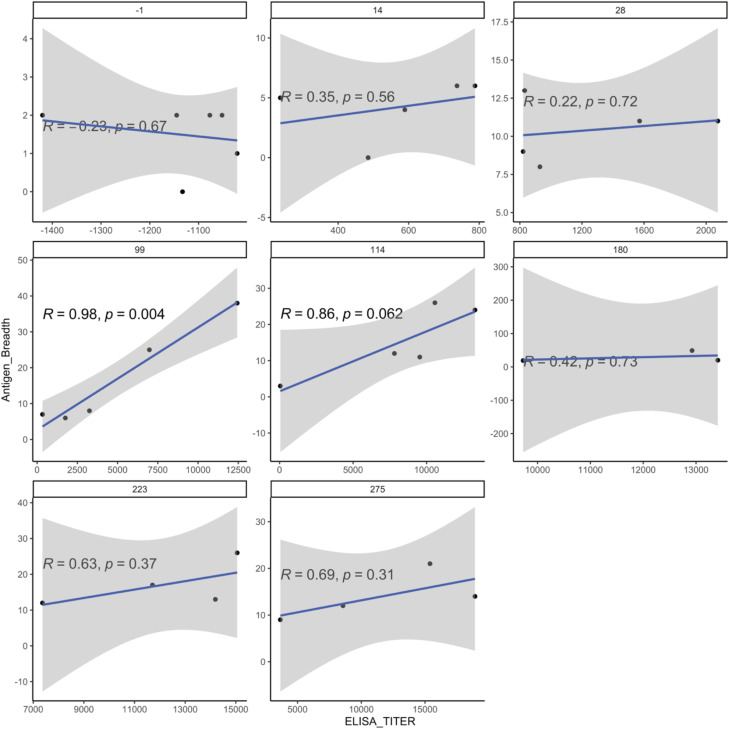
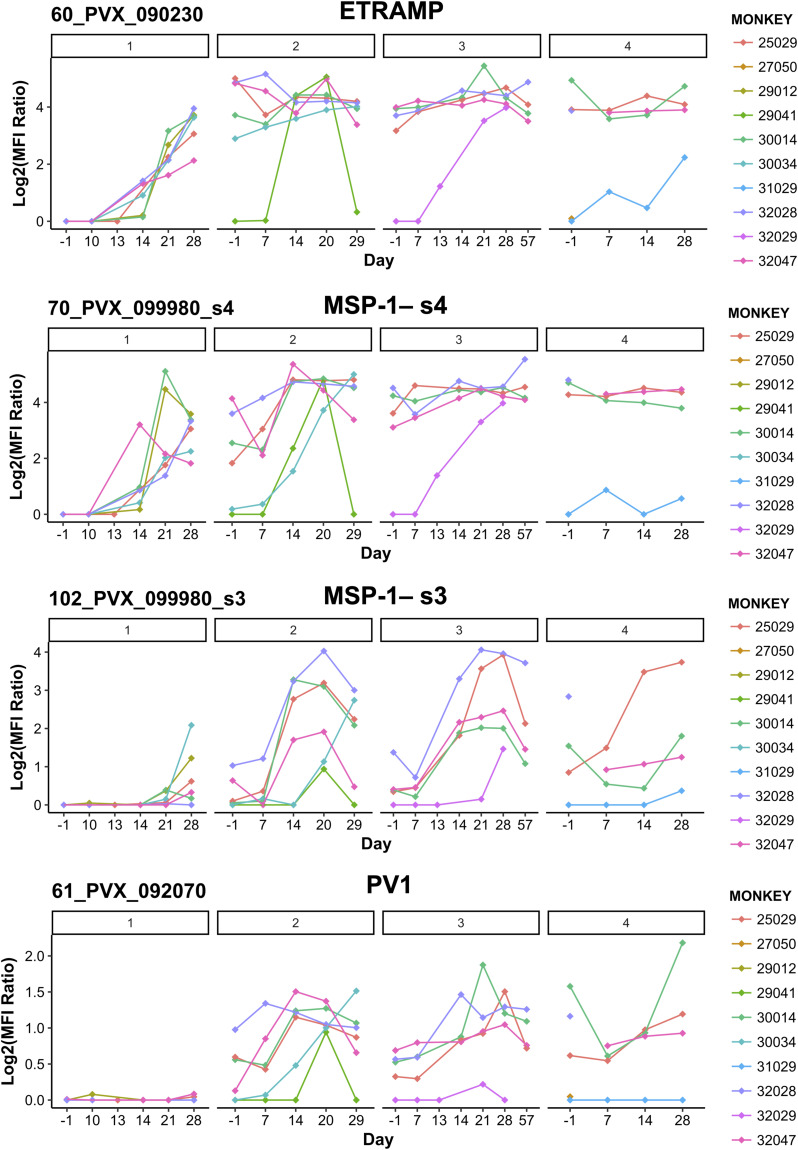
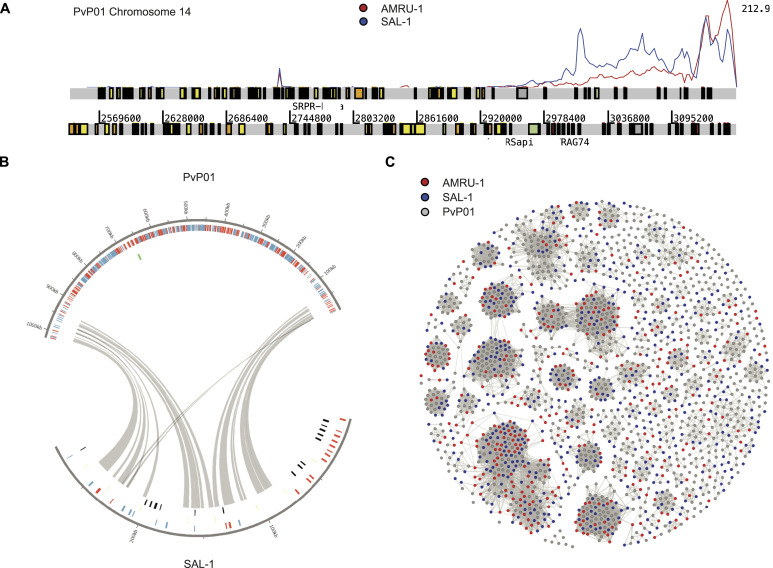
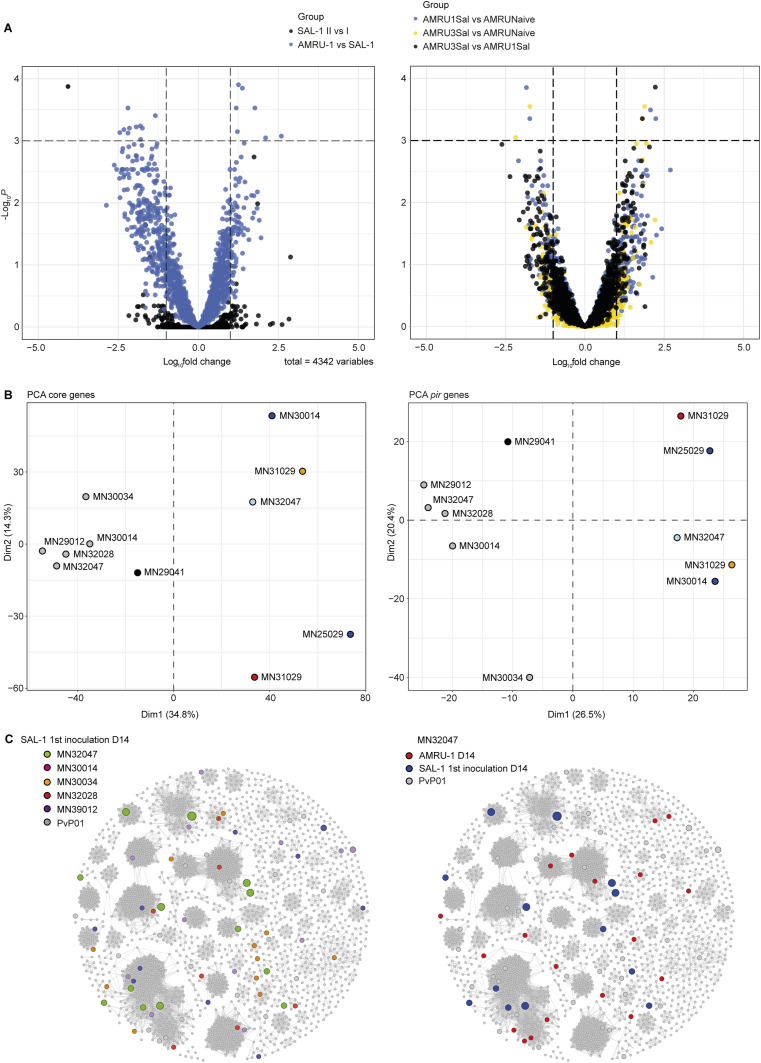
The malaria parasite Plasmodium vivax remains a major global public health challenge, and no vaccine is approved for use in humans. Here, we assessed whether P. vivax strain-transcendent immunity can be achieved by repeated infection in Aotus monkeys. Sterile immunity was achieved after two homologous infections, whereas subsequent heterologous challenge provided only partial protection. IgG levels based on P. vivax lysate ELISA and protein microarray increased with repeated infections and correlated with the level of homologous protection. Parasite transcriptional profiles provided no evidence of major antigenic switching upon homologous or heterologous challenge. However, we observed significant sequence diversity and transcriptional differences in the P. vivax core gene repertoire between the two strains used in the study, suggesting that partial protection upon heterologous challenge is due to molecular differences between strains rather than immune evasion by antigenic switching. Our study demonstrates that sterile immunity against P. vivax can be achieved by repeated homologous blood stage infection in Aotus monkeys, thus providing a benchmark to test the efficacy of candidate blood stage P. vivax malaria vaccines.


Conflict of interest statement

The authors declare that they have no conflict of interest.

Figures

Figure 1.
Figure 1.. Experimental timeline, parasite dynamics, and survival analysis.
(A) Experimental timeline of infection and challenge. *: died of malaria-unrelated causes. **: anemia and renal failure. (B) Peripheral parasitemia across the experiment. Panels I–III show individual parasitemia of Aotus monkeys repeatedly infected with P. vivax SAL-1 (inoculations I–III). Panel IV shows Aotus challenged with P. vivax AMRU-1 (inoculation IV). Inoculated control animals were treated at peak parasitemia. (C) Probability of no treatment of Aotus repeatedly infected with the homologous P. vivax SAL-1 and heterologous P. vivax AMRU-1 strains at each inoculation level. P-values for survival curve comparison were obtained using the log-rank (Mantel–Cox) test. Survival curves for homologous infection 1 are shown in blue; homologous infection 2 in red; homologous infection 3 in green; and P. vivax AMRU-1 heterologous infection 4 in black. Complete blood count: red blood cell count. CQ, chloroquine, at 15 mg/kg oral for 3 d. MQ, mefloquine, at 25 mg/kg oral once. C, malaria naïve control. C1, control, once inoculated with P. vivax. PI, post-inoculation.
Figure S1.
Figure S1.. Experimental scheme.
Diagram depicting repeated infection of Aotus monkeys with the homologous P. vivax SAL-1 and challenge with the heterologous AMRU-1 strain. Inoculation level, inoculation day, donor monkey, monkey number, and number of animals remaining from the original group of six inoculated are shown.
Figure S2.
Figure S2.. Parasite load and biomass across animals.
(A) Parasite load. Panels I–III show parasite load (qRT-PCR 18S rRNA in copies x μl) across inoculation levels I–III in individual monkeys infected with P. vivax SAL-1. Panel IV shows inoculation level IV, that is, individual monkeys infected with P. vivax AMRU-1. (B) Parasite biomass. Panels I–III show parasite biomass (pLDH ng/ml) across inoculation levels I–III in individual monkeys infected with P. vivax SAL-1. Panel IV shows inoculation level IV, that is, individual monkeys infected with P. vivax AMRU-1. Plasmodium LDH levels in ng/ml were calculated based on standard curves using Plasmodium falciparum schizont extracts. (C) Parasitemia parameters across inoculation levels I–IV (mean ± SD). Left: days patent. Mid-left: day of peak. Mid-right: peak parasitemia. Right: area under the curve. P-value, unpaired t test with equal SD.
Figure 2.
Figure 2.. Hematological and parasite parameters.
Panels (A, B, C) show hematocrit levels (Hct%) (A), platelet counts (B), and combined data from (A, B) and mean parasitemia (C) across inoculation levels I–IV. Panel (D) shows the percentage of reticulocytes and the Reticulocyte Production Index at infection level IV. RPI = Reticulocyte Absolute Count/Reticulocyte Maturation Correction. (C) Reticulocyte Absolute Count = Hct%/45 x reticulocyte %. T = CQ: chloroquine, at 15 mg/kg oral for 3 d; and MQ at 25 mg/kg once for rescue treatment of P. vivax AMRU-1 infections in panel (C).
Figure 3.
Figure 3.. ELISA titers of Aotus repeatedly infected with P. vivax blood stages.
(A) Crude antigen checkerboard titration. P. vivax SAL-1 antigen was prepared from Aotus-infected red blood cells purified by Percoll cushion (47%) centrifugation and adsorbed to the plate wells diluted in PBS, pH 7.4, at a concentration of 5 μg/ml. Secondary antibodies (peroxidase-conjugated goat anti-monkey, Rhesus macaque) were diluted 1:2,000 in PBS, pH 7.4, and optical density (OD) was read using a 492-nm filter. (B) Mean ELISA* titers of Aotus immunized by repeated infection with the homologous SAL-1 and challenged with the heterologous AMRU-1 strains of P. vivax. I–IV indicate inoculation levels, each with an inoculum of 50 × 103 infected red blood cells. Levels I-III indicate infection with homologous SAL-1. Level IV indicates infection with heterologous AMRU-1. (C) Pearson’s correlation analysis of mean ELISA titers at inoculation levels I (n = 6), II (n = 5), and III (n = 4) showed a high negative correlation versus mean parasitemia (r = − 0.98), the mean area under the curve (r = −0.98), and a moderate positive correlation versus mean peak parasitemia (r = 0.63). (D) Combined plot of mean parasitemia and ELISA titers with Aotus repeatedly infected with the homologous SAL-1 (infection I–III) and challenged with the heterologous AMRU-1 (infection IV).
Figure 4.
Figure 4.. Protein microarray.
(A) Shown are antibody responses (log2 [antigen reactivity/no DNA control reactivity]) to 66 of 244 P. vivax IVTT antigens with reactivity above 0 in 10% of all samples and across monkeys. Thus, zero represents equal or lower reactivity than the mean of the no DNA control spots. Antigens are ordered from the highest to the lowest overall mean. Samples are ordered top to bottom by inoculation level, day, and then monkey. (B) Antigen breadth (number of P. vivax-reactive antigens) by post-infection day at each inoculation level (I–IV). Antigens were considered reactive if the reactivity was higher than the mean + 3 SD of the no DNA control spots for that sample. * indicates a significantly higher antigen breadth at that day than at baseline (day -1) within each inoculation (P < 0.05, Wilcoxon’s matched-pairs test, one-sided). (C) Area under the curve of the antigen breadth at each inoculation level for the three monkeys that completed the experiment. (D) Pearson’s correlation of ELISA titer at each day post-infection versus antigen breadth. P-values shown are from t tests with the null hypothesis that the correlation coefficient equals 0.
Figure S3.
Figure S3.. Association of individual antibody responses with ELISA and other parameters.
Matrix plot of Spearman’s rank correlations between the protein array hits and IgG titers (determined by ELISA), parasitemia, parasite load (determined by qPCR), parasite biomass (represented by pLDH levels), and hematological parameters at each inoculation level. Asterisks represent the level of significance (*P < 0.05, **P < 0.01, and ***P < 0.001).
Figure S4.
Figure S4.. Protein microarray and ELISA titer.
Pearson’s correlation of ELISA titer at each day post-infection versus antigen breadth. P-values shown are from t tests with the null hypothesis that the correlation coefficient equals 0.
Figure S5.
Figure S5.. Top protein microarray responses.
Reactivity of Aotus sera repeatedly infected with P. vivax blood stages against selected immunogenic targets. PVX_090230 = early transcribed membrane protein; PVX_099980_s3 and PVX_099980_s4 = MSP1; and PVX_092070 = PV1. All data are normalized as log2 (antigen reactivity/no DNA control reactivity). Notably, the dynamic of antibody acquisition varies across individual antigens and monkeys.
Figure 5.
Figure 5.. Selective whole-genome amplification (sWGA) and PacBio sequencing of Plasmodium vivax SAL-1 and AMRU-1.
(A) Artemis screenshot. Shown is one arm of P. vivax PvP01 chromosome 14, with PacBio reads mapped (SAL-1 in blue and AMRU-1 in red). Most of the coverage occurs in subtelomeric regions, demonstrating the specificity of the selective whole-genome amplification. (B) Circos plot of one representative SAL-1 contig that contains mostly pir genes. The contig maps to chromosome 1 of P. vivax reference PvP01. Gray lines show syntenic matches of pir genes between the two strains. (C) Gephi plot showing pir genes from AMRU-1 (red), SAL-1 (blue), and PvP01 reference (gray). Genes are connected if they share at least 32% global identity.
Figure 6.
Figure 6.. Parasite gene expression comparisons across infection regimes.
(A) Differential gene expression (DGE) across core genes. Volcano plots show DGE between infection regimes. Left: DGE of core genes between SAL-1 inoculation II versus SAL-1 inoculation I (black) and between AMRU-1 inoculation IV versus the averaged expression of SAL-1 during the homologous challenges (blue). Right: DGE of core genes across AMRU-I infection regimes. Yellow dots represent DGE between AMRU-1 parasites from Aotus monkeys previously infected with three SAL-1 inoculations (AMRU3Sal) versus AMRU-1 parasites from naïve Aotus monkeys (AMRUNaive). Black dots represent DGE between AMRU3Sal versus AMRU-1 parasites from Aotus monkeys previously infected with only one SAL-1 inoculation (AMRU1Sal). Blue dots represent DGE between AMRU1Sal versus AMRUNaive. Each dot represents one annotated P. vivax core gene and is displayed according to the fold change in expression (x-axis, in log2) and statistical significance (y-axis, in negative logarithm to the base 10 of the P-value). (B) Principal component analysis of the parasite core gene (left panel) and pir gene (right panel) expression profiles from each biological replicate, colored according to the corresponding group: SAL-1 parasites at day 14 PI of the first inoculation (gray); SAL-1 parasites at day 14 PI of the second inoculation (black); AMRU-1 parasites at day 14 PI from Aotus monkeys previously infected with three SAL-1 inoculations (light blue dots); gene expression of AMRU-1 parasites at day 28 PI from Aotus monkeys previously infected with three SAL-1 inoculations (blue dots); gene expression of AMRU-1 parasites at day 1 PI from naïve Aotus monkeys (orange dots); and gene expression of AMRU-1 parasites at day 14 PI from naïve Aotus monkeys (red dots). (C) pir gene network analysis comparing P. vivax pir gene expression in SAL-1 versus AMRU-1 infections in Aotus monkeys. The same network as in Fig 5C, except that larger circles indicate the pir gene expression level. Left panel: pir expression in SAL-1 parasites at day 14 PI of the first inoculation across individual monkeys. Right panel: comparison of pir expression in monkey MN32047 between SAL-1 parasites at day 14 PI of the first inoculation and AMRU-1 parasites at day 14 PI of the fourth inoculation.

Similar articles

Cited by

References

    1. WHO Team (2021) World Malaria Report 2021. Geneva, Switzerland: WHO.
    1. Schuldt NJ, Amalfitano A (2012) Malaria vaccines: Focus on adenovirus based vectors. Vaccine 30: 5191–5198. 10.1016/j.vaccine.2012.05.048 - DOI - PubMed
    1. Bourgard C, Albrecht L, Kayano A, Sunnerhagen P, Costa FTM (2018) Plasmodium vivax biology: Insights provided by genomics, transcriptomics and proteomics. Front Cell Infect Microbiol 8: 34. 10.3389/fcimb.2018.00034 - DOI - PMC - PubMed
    1. Price RN, Commons RJ, Battle KE, Thriemer K, Mendis K (2020) Plasmodium vivax in the era of the shrinking P. falciparum map. Trends Parasitol 36: 560–570. 10.1016/j.pt.2020.03.009 - DOI - PMC - PubMed
    1. Battle KE, Baird JK (2021) The global burden of Plasmodium vivax malaria is obscure and insidious. PLoS Med 18: e1003799. 10.1371/journal.pmed.1003799 - DOI - PMC - PubMed

Publication types

Substances