. 2024 Mar;38(3):610-620.
doi: 10.1038/s41375-023-02120-7. Epub 2023 Dec 29.

Genetic and transcriptomic analyses of diffuse large B-cell lymphoma patients with poor outcomes within two years of diagnosis

Affiliations

Genetic and transcriptomic analyses of diffuse large B-cell lymphoma patients with poor outcomes within two years of diagnosis

Weicheng Ren et al. Leukemia. 2024 Mar.

Abstract

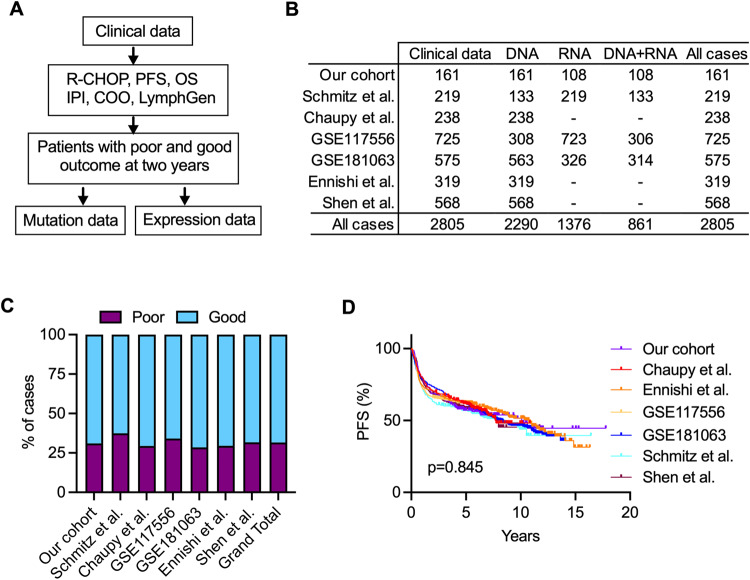
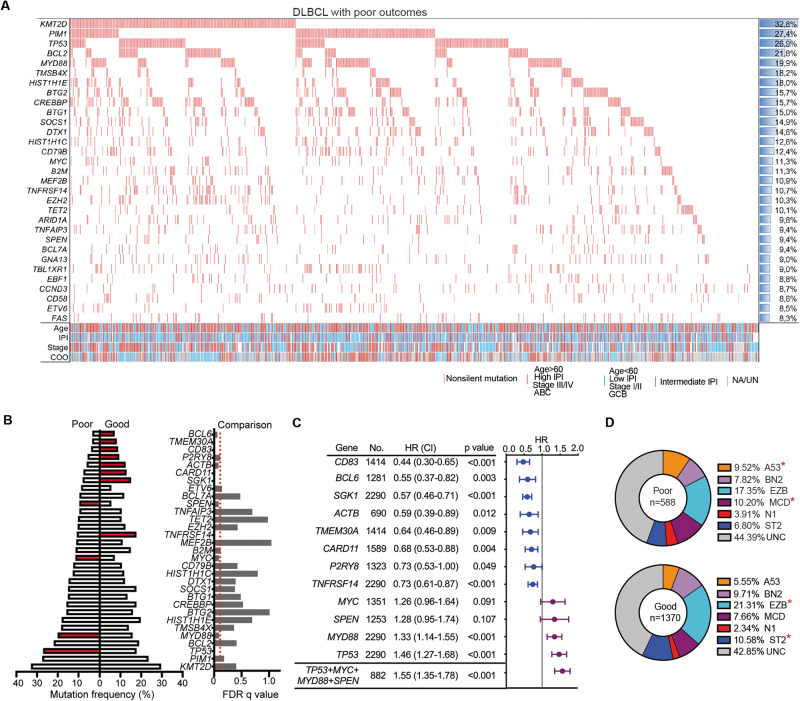
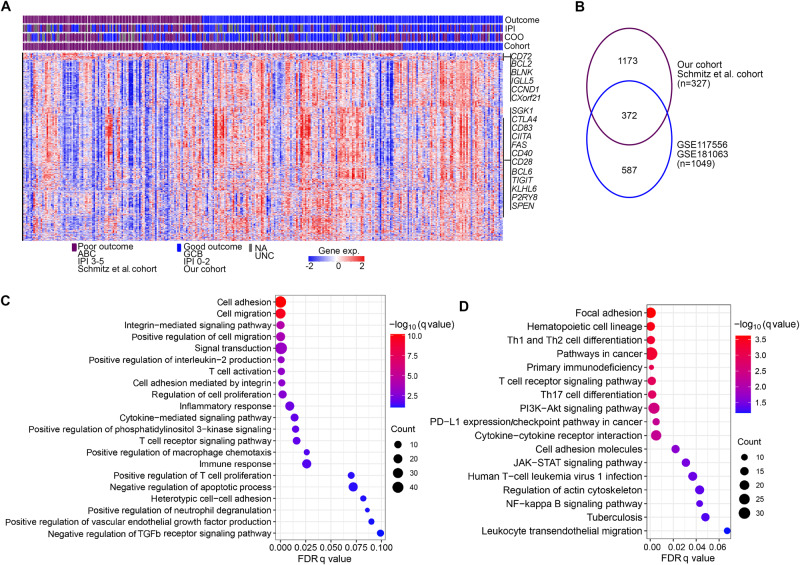
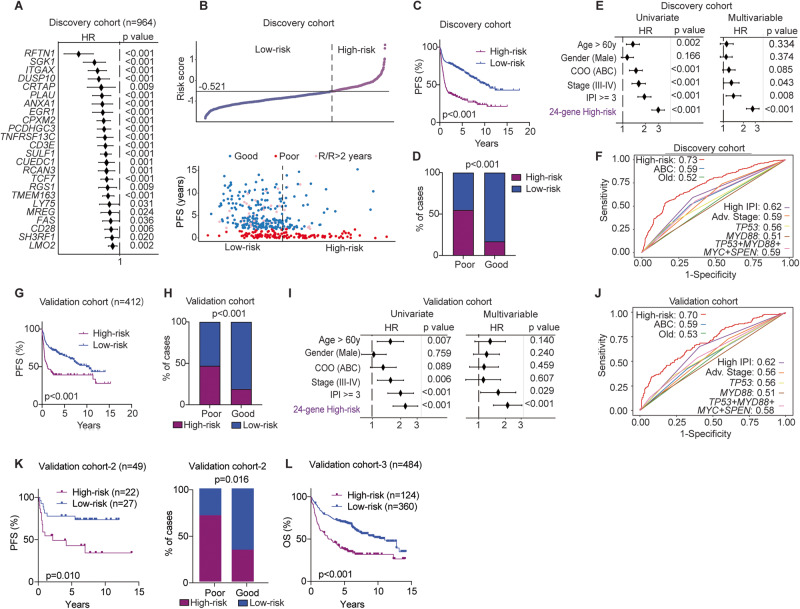
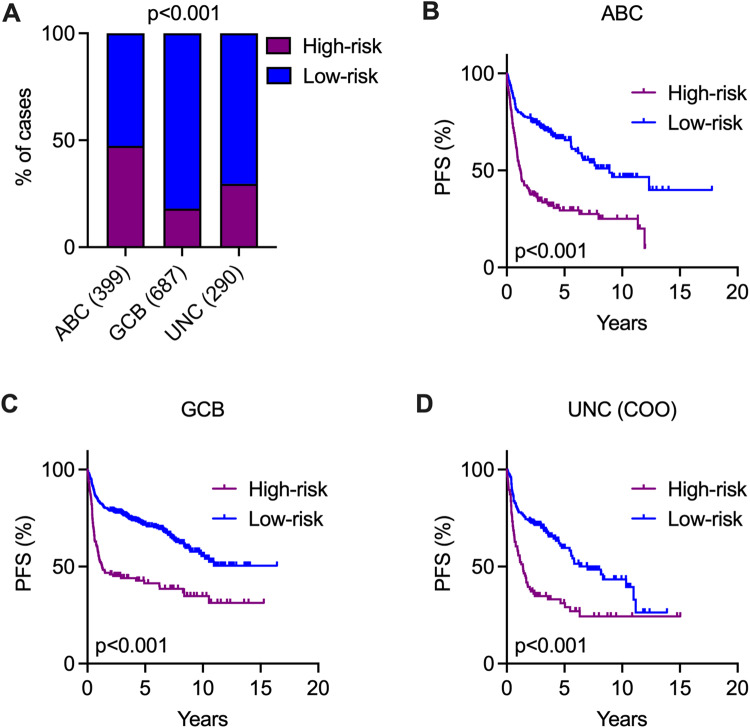
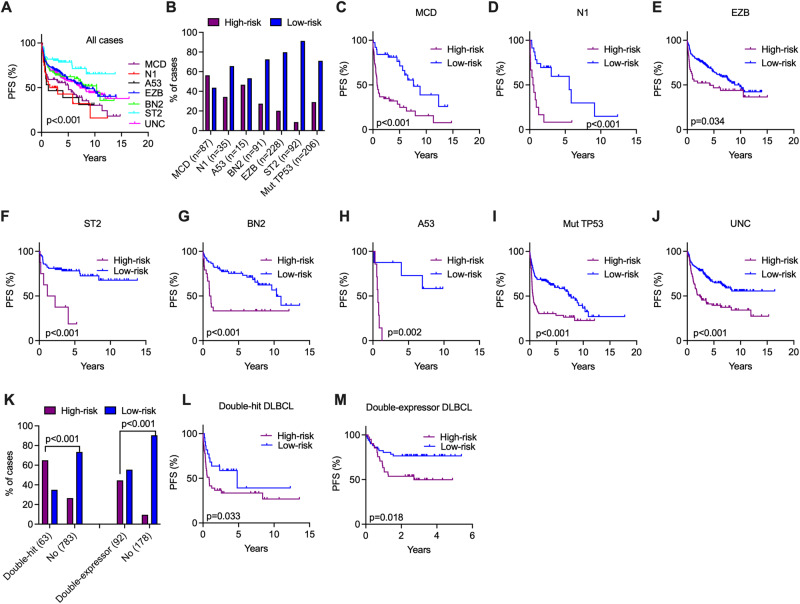
Despite the improvements in clinical outcomes for DLBCL, a significant proportion of patients still face challenges with refractory/relapsed (R/R) disease after receiving first-line R-CHOP treatment. To further elucidate the underlying mechanism of R/R disease and to develop methods for identifying patients at risk of early disease progression, we integrated clinical, genetic and transcriptomic data derived from 2805 R-CHOP-treated patients from seven independent cohorts. Among these, 887 patients exhibited R/R disease within two years (poor outcome), and 1918 patients remained in remission at two years (good outcome). Our analysis identified four preferentially mutated genes (TP53, MYD88, SPEN, MYC) in the untreated (diagnostic) tumor samples from patients with poor outcomes. Furthermore, transcriptomic analysis revealed a distinct gene expression pattern linked to poor outcomes, affecting pathways involved in cell adhesion/migration, T-cell activation/regulation, PI3K, and NF-κB signaling. Moreover, we developed and validated a 24-gene expression score as an independent prognostic predictor for treatment outcomes. This score also demonstrated efficacy in further stratifying high-risk patients when integrated with existing genetic or cell-of-origin subtypes, including the unclassified cases in these models. Finally, based on these findings, we developed an online analysis tool ( https://lymphprog.serve.scilifelab.se/app/lymphprog ) that can be used for prognostic prediction for DLBCL patients.


Conflict of interest statement

The authors declare no competing interests.

Figures

Fig. 1
Fig. 1. DLBCL cohorts used to identify patients with poor outcomes within two years following R-CHOP treatment.
A The workflow for identifying patients with poor and good outcomes in different cohorts. B An overview of clinical, DNA mutation, and gene expression data for patient cohorts included in this study. C The percentage of patients with poor outcomes within each cohort. D Kaplan–Meier survival analysis illustrating PFS in different cohorts. The p value was calculated by the log-rank test.
Fig. 2
Fig. 2. Mutation pattern in tumors derived from DLBCL patients with poor outcomes following R-CHOP treatment.
A Catalog of the most frequently mutated genes in DLBCL tumors among patients with poor outcomes. Genes that affected by nonsilent mutations across more than three cohorts and observed in more than 8% of all patients (n = 702) were included. B Comparison of mutation frequencies between DLBCLs with poor and good outcomes using Fisher’s exact test, adjusted by the false discovery rate (FDR) q value (q < 0.1 was considered significant). The presented genes included those most significantly mutated between the two outcome groups and those with mutation frequencies greater than 10%. Genes with FDR q < 0.1 were indicated as red color. C Forest plots display the association between the mutation of individual/combined genes and PFS in the combined cohorts. D Donut chart illustrating the distribution of LymphGen DNA subtypes in patients with poor or good outcomes in the combined cohorts. Fisher’s exact test was used to compute p values. *p < 0.05; NA not available, UN unknown, HR hazard ratio, CI confidence interval, UNC unclassified.
Fig. 3
Fig. 3. Gene expression pattern in tumors derived from DLBCL patients with poor and good outcomes at two years following R-CHOP treatment.
The analysis of differentially expressed genes (DEGs) was conducted separately in the RNAseq dataset (our cohort/Schmitz et al. cohort, n = 327) and the microarray dataset (GSE117556/GSE181063; n = 1049). A threshold of FDR q < 0.1 and fold change >1.2 was used to define DEGs from each dataset. A The heatmap illustrating DEGs between the two outcome groups in the RNAseq dataset. Each column represents a sample, ordered by outcome groups. Within each group, samples were ordered following the input of the data accordingly. Each row represents a gene. Selected genes that are frequently mutated in B-cell lymphomas or important for immune responses are highlighted in the figure. B The numbers of overlapping DEGs between the RNAseq dataset and the microarray dataset. GSEA analysis of the overlapping DEGs from (B) (C: Gene Ontology biological pathway, (D): Kyoto Encyclopedia of Genes and Genomes (KEGG) pathway).
Fig. 4
Fig. 4. Development and validation of an independent gene-expression signature to predict treatment outcomes in DLBCL patients.
The RNAseq and microarray datasets were merged into a larger cohort (n = 1376) using a quantile normalization approach. The samples were subsequently randomly divided into a discovery cohort (70%, n = 964; AF) and a validation cohort (30%, n = 412; GJ). A Forest plots showing the association between the expression levels of the 24 genes and PFS within the discovery cohort. B The distribution of 24-gene expression scores in each DLBCL patient, and the correlation between PFS and risk groups in the discovery cohort. Patients were assigned to high- and low-risk groups based on the optimal threshold for the ROC curve, set at −0.521. Each dot represents one patient. C Kaplan–Meier survival analysis illustrating PFS between high- and low-risk groups in the discovery cohort. The p value was calculated by the log-rank test. D Bar plots showing the distribution of high- and low-risk patients within poor and good outcome groups in the discovery cohort. Fisher’s exact test was utilized to determine the p value. E Univariate and multivariable Cox regression analyses demonstrating the prognostic independence of the 24-gene-expression scores in the discovery cohort. Key clinical parameters such as age, subtype, stage, and IPI factors are included in the analysis. F ROC curves demonstrating the performance of different parameters in identifying DLBCL patients with two-year poor outcomes in the discovery cohort. AUC values are indicated. G Kaplan–Meier survival analysis illustrating PFS of the high- and low-risk groups in the validation cohort (n = 412). Patients were classified into high- and low-risk groups using the same threshold established in the discovery cohort (−0.521). The p value was calculated by the log-rank test. H Bar plots showing the distribution of high- and low-risk patients within poor and good outcome groups in the validation cohort. Fisher’s exact test was used to determine the p value. I Univariate and multivariable Cox regression analyses demonstrating the independent prognostic role of the 24-gene expression score in the validation cohort. J ROC curves demonstrating the performance of different parameters in identifying DLBCL patients with two-year poor outcomes in the validation cohort. K, L Two additional independent cohorts (RNAseq=49, CNP0001327; microarray=484, remaining samples of the GSE181063 cohort were only available for OS data) were used to evaluate the algorithm of the 24-gene risk score. HR hazard ratio, CI confidence interval, ROC receiver operating characteristic, AUC area under the curve, OS overall survival.
Fig. 5
Fig. 5. Independent risk stratification by 24-gene expression scores in various COO subtypes of DLBCLs.
The analysis was performed on all samples with available gene expression data (n = 1376). A Bar plots showing the distribution of high- and low-risk patients in various COO subtypes. Fisher’s exact test was used to determine the p value. Kaplan–Meier survival analysis illustrating PFS between high- and low-risk groups in ABC-DLBCL (B), GCB-DLBCL (C) and UNC-DLBCL (D). COO cell-of-origin, UNC unclassified. The p value was calculated by the log-rank test. Independent analyses in the individual cohorts, discovery cohort and validation cohort are presented in Fig. S11–S12.
Fig. 6
Fig. 6. Individualized risk stratification by 24-gene expression score in LymphGen DNA subtypes.
All samples with available gene expression data and LymphGen DNA subtypes were combined for the analysis (n = 956). A Kaplan–Meier survival analysis showing the PFS in the individual LymphGen DNA subtypes. B Bar plots showing the distribution of high- and low-risk patients in the different DNA subtypes. CJ Kaplan–Meier survival analysis showing the PFS of high- and low-risk patients in the indicated DNA subtypes and the unclassified subtype. K Bar plots showing the distribution of high- and low-risk patients in the double-hits (n = 63) and double-expressors (n = 92) of MYC and BCL2. Among 1376 samples with 24-gene risk scores, 846 cases were evaluated for double-hit status, with 63 identified as double-hit. A total of 270 samples were assessed for double-expressor status, with 92 identified as double-expressors. Fisher’s exact test was used to compute p values. L, M Kaplan–Meier survival analysis showing the PFS of high- and low-risk patients in the indicated groups. UNC unclassified. For all Kaplan–Meier survival analyses, the p value was calculated by the log-rank test. Independent analyses in the discovery and validation cohorts are presented in Fig. S13.

References

    1. Coiffier B, Lepage E, Briere J, Herbrecht R, Tilly H, Bouabdallah R, et al. CHOP chemotherapy plus rituximab compared with CHOP alone in elderly patients with diffuse large-B-cell lymphoma. N Engl J Med. 2002;346:235–42. - PubMed
    1. Harrysson S, Eloranta S, Ekberg S, Enblad G, Jerkeman M, Wahlin BE, et al. Incidence of relapsed/refractory diffuse large B-cell lymphoma (DLBCL) including CNS relapse in a population-based cohort of 4243 patients in Sweden. Blood Cancer J. 2021;11:9. - PMC - PubMed
    1. Sarkozy C, Coiffier B. Primary refractory diffuse large B cell lymphoma in the rituximab era. Curr Opin Oncol. 2015;27:377–83. - PubMed
    1. Coiffier B, Sarkozy C. Diffuse large B-cell lymphoma: R-CHOP failure-what to do? Hematol Am Soc Hematol Educ Program. 2016;2016:366–78. - PMC - PubMed
    1. Viardot A, Goebeler ME, Hess G, Neumann S, Pfreundschuh M, Adrian N, et al. Phase 2 study of the bispecific T-cell engager (BiTE) antibody blinatumomab in relapsed/refractory diffuse large B-cell lymphoma. Blood. 2016;127:1410–6. - PMC - PubMed

Publication types

MeSH terms