. 2024 Jan 5;16(1):evad239.
doi: 10.1093/gbe/evad239.

Astrocytes Drive Divergent Metabolic Gene Expression in Humans and Chimpanzees

Affiliations

Astrocytes Drive Divergent Metabolic Gene Expression in Humans and Chimpanzees

Trisha M Zintel et al. Genome Biol Evol. .

Abstract

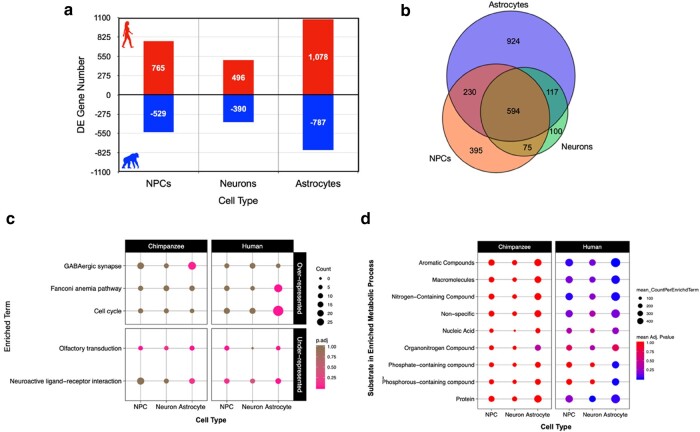
The human brain utilizes ∼20% of all of the body's metabolic resources, while chimpanzee brains use <10%. Although previous work shows significant differences in metabolic gene expression between the brains of primates, we have yet to fully resolve the contribution of distinct brain cell types. To investigate cell type-specific interspecies differences in brain gene expression, we conducted RNA-seq on neural progenitor cells, neurons, and astrocytes generated from induced pluripotent stem cells from humans and chimpanzees. Interspecies differential expression analyses revealed that twice as many genes exhibit differential expression in astrocytes (12.2% of all genes expressed) than neurons (5.8%). Pathway enrichment analyses determined that astrocytes, rather than neurons, diverged in expression of glucose and lactate transmembrane transport, as well as pyruvate processing and oxidative phosphorylation. These findings suggest that astrocytes may have contributed significantly to the evolution of greater brain glucose metabolism with proximity to humans.

Keywords: astrocytes; brain; evolution; genomics; metabolism; neurons.


Figures

Fig. 1.
Fig. 1.
Patterns of gene expression variation of iPSC-derived neural cells from humans and chimpanzees. a) The differentiation schematic and representative immunofluorescent photos of iPSC-derived NPCs stained with PAX6, astrocytes stained with GFAP, and neurons stained with TUJ1. b) A PCoA of the iPSC-derived NPCs, neurons, and astrocytes transcriptomes. c) A Venn diagram of the overlap in expression across CTs. Further details for samples are included in supplementary table S1, Supplementary Material online.
Fig. 2.
Fig. 2.
Astrocytes demonstrate the most significant differences in gene expression between human and chimpanzee neural CTs for metabolic but not neuron-specific pathways. a) Counts of genes exhibiting DE at an FDR < 5% between species for each CT and the direction of higher expression for each CT-DE comparison (red/up/positive, higher expression in human; blue/down/negative, higher expression in chimpanzee). b) A Venn diagram of overlap in genes per CT exhibiting DE between species. c) Plot of significantly (q < 0.05) overrepresented (top panel) and underrepresented (bottom panel) KEGG pathways determined by categorical enrichment analyses. Size indicates the count of genes per pathway, while color indicates the adjusted P-value (pink, lower/significant; brown, higher/nonsignificant). d) Plot of significantly overrepresented categories of GO BP terms determined by categorical enrichment analyses. The categories (y axis) represent groupings of multiple GO BP terms related to the metabolism of the indicated substrates/macromolecules. Size indicates the mean count, and color indicates the mean adjusted enrichment P-value for all terms in that category.
Fig. 3.
Fig. 3.
Humans and chimpanzees differ in metabolite transport and OXPHOS in a neural CT manner. a) Plot of all tested gene sets in the GSEA (full results in supplementary table S5, Supplementary Material online). Separate panels indicate which species “phenotype” the gene set was enriched in. Color indicates the FDR Q-value (FDR < 25% indicates significance in this analysis). Size indicates the log(count) of genes included in the enriched gene set. b) Enrichment plots of significant pathways from GSEA for a subset of panel a. The green line indicates the running enrichment score for each gene in the gene set as the analysis moves down the ranked list of genes. The enrichment score for the gene set is the peak of this curve, and an (*) indicates significantly enriched. The bottom panel is the ranked order of the genes and shows their location within that ranked set of genes. The left side of plot (and red/left portion of ranked order plot below) indicates human enrichment, while the opposite (right/blue) indicates chimpanzee enrichment.
Fig. 4.
Fig. 4.
Interspecies expression differences of OXPHOS genes is influenced by higher expression of mitochondrial genes in all neural human CTs. CT-DE results of genes per a) GO or b) KEGG OXPHOS gene sets determined as members of the core set of genes influencing significant enrichment of these gene sets in the GSEA analysis. CT-DE rank was calculated per each gene [(sign of logFC) × log10(FDR Q-value)], with values >0 indicating higher expression in human and values <0 indicating higher expression in chimpanzee. Color spectrum and size also indicate rank (red, higher in human; blue, higher in chimpanzee; larger = higher rank).
Fig. 5.
Fig. 5.
Divergence in pyruvate utilization between species’ astrocytes. We constructed a focal set of aerobic glycolysis signaling pathways in order to contextualize our DE results in the framework of a network signaling. A diagram of the major pathways involved in aerobic glycolysis (glycolysis, PPP, lactate conversion from pyruvate, and TCA cycle). For each enzyme in the pathway, 3 blocks indicate expression of this enzyme in each CT—left to right: NPCs, neurons, and astrocytes. Color indicates the level of expression (higher in human [red], higher in chimpanzee [blue], not expressed in this CT [grey]).

References

    1. Aiello LC, Wheeler P. The expensive-tissue hypothesis: the brain and the digestive system in human and primate evolution. Curr Anthropol. 1995:36(2):199–221. 10.1086/204350. - DOI
    1. Aken BL, Achuthan P, Akanni W, Amode MR, Bernsdorff F, Bhai J, Billis K, Carvalho-Silva D, Cummins C, Clapham P, et al. Ensembl 2017. Nucleic Acids Res. 2017:45(D1):D635–D642. 10.1093/nar/gkw1104. - DOI - PMC - PubMed
    1. Almad AA, Doreswamy A, Gross SK, Richard JP, Huo Y, Haughey N, Maragakis NJ. Connexin 43 in astrocytes contributes to motor neuron toxicity in amyotrophic lateral sclerosis. Glia 2016:64(7):1154–1169. 10.1002/glia.22989. - DOI - PMC - PubMed
    1. Almeida A, Moncada S, Bolaños JP. Nitric oxide switches on glycolysis through the amp protein kinase and 6-phosphofructo-2-kinase pathway. Nat Cell Biol. 2004:6(1):45. 10.1038/ncb1080. - DOI - PubMed
    1. Amiri A, Coppola G, Scuderi S, Wu F, Roychowdhury T, Liu F, Pochareddy S, Shin Y, Safi A, Song L, et al. Transcriptome and epigenome landscape of human cortical development modeled in organoids. Science 2018:362(6420):eaat6720. 10.1126/science.aat6720. - DOI - PMC - PubMed

Publication types