. 2024 Apr 15;75(8):2330-2350.
doi: 10.1093/jxb/erad507.

NAC61 regulates late- and post-ripening osmotic, oxidative, and biotic stress responses in grapevine

Affiliations

NAC61 regulates late- and post-ripening osmotic, oxidative, and biotic stress responses in grapevine

Chiara Foresti et al. J Exp Bot. .

Abstract

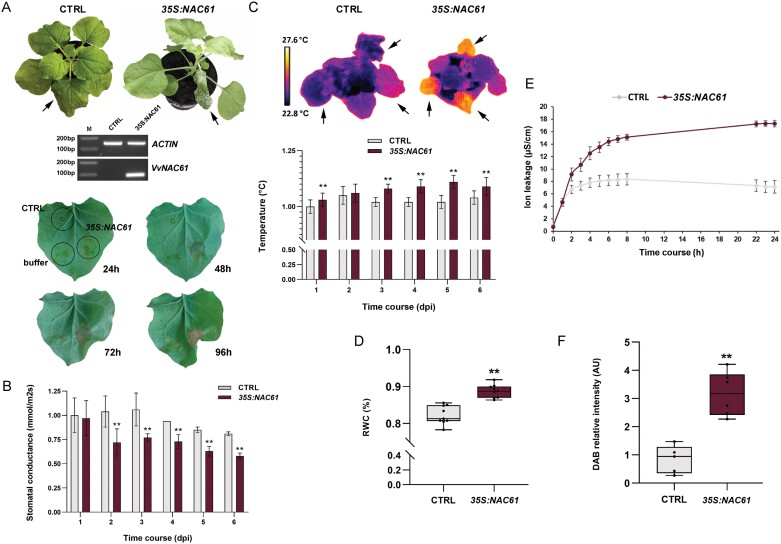
During late- and post-ripening stages, grape berry undergoes profound biochemical and physiological changes whose molecular control is poorly understood. Here, we report the role of NAC61, a grapevine NAC transcription factor, in regulating different processes involved in berry ripening progression. NAC61 is highly expressed during post-harvest berry dehydration and its expression pattern is closely related to sugar concentration. The ectopic expression of NAC61 in Nicotiana benthamiana leaves resulted in low stomatal conductance, high leaf temperature, tissue collapse and a higher relative water content. Transcriptome analysis of grapevine leaves transiently overexpressing NAC61 and DNA affinity purification and sequencing analyses allowed us to narrow down a list of NAC61-regulated genes. Direct regulation of the stilbene synthase regulator MYB14, the osmotic stress-related gene DHN1b, the Botrytis cinerea susceptibility gene WRKY52, and NAC61 itself was validated. We also demonstrate that NAC61 interacts with NAC60, a proposed master regulator of grapevine organ maturation, in the activation of MYB14 and NAC61 expression. Overall, our findings establish NAC61 as a key player in a regulatory network that governs stilbenoid metabolism and osmotic, oxidative, and biotic stress responses that are the hallmark of late- and post-ripening grape stages.

Keywords: Botrytis cinerea; NAC61; Abiotic stress; biotic stress; grapevine; late ripening; post-harvest dehydration; stilbenoid metabolism.


Conflict of interest statement

The authors have no conflict of interest to declare.

Figures

Fig. 1.
Fig. 1.
NAC61 expression analysis. (A) NAC61 expression behavior in grapevine organs throughout development (bar plot) and compared in the heatmap (logarithmic value) with that of NAC60 and NAC33. The data were retrieved from the atlas transcriptomic dataset of cv. ‘Corvina’ (Fasoli et al., 2012). Each value represents the mean ±SD of three biological replicates. (B) Correlation between NAC61 expression level and sugar content in grape berries sampled from fruit set to maturity in cv. ‘Cabernet Sauvignon’ and cv. ‘Pinot noir’ (Fasoli et al., 2018). The black line represents the trend of the averaged values of the two varieties. The R2 values shown correspond to the fitting of different polynomial regressions to each corresponding group of samples (orange for cv. ‘Cabernet Sauvignon’ samples, blue for cv. ‘Pinot noir’ samples, and black for the entire set of samples). (C) Correlation between NAC61 expression level and sugar content in grape berries sampled during post-harvest dehydration in six different varieties (Zenoni et al., 2016). (D) Correlation between NAC61 expression level and berry weight loss in cv. ‘Corvina’ berries sampled during traditional long and forced short post-harvest dehydration processes (Zenoni et al., 2020). Expression values were determined by microarray analysis and each value represents the mean ±SD from three biological replicates. (E) NAC61 GCNs based on berry, leaf, and tissue-independent (TI) datasets. Left, Venn diagram showing exclusive and shared genes based on the three datasets; right, three-dimensional plot of co-expressed genes in which NAC, WRKY, and ZIP family members already described as having involvement in berry ripening and/or stress responses are indicated.
Fig. 2.
Fig. 2.
NAC61 ectopic expression in N. benthamiana plants. (A) Control and NAC61-expressing N. benthamiana plants 3 d after infection (top panel), RT–PCR validating the NAC61 ectopic expression in comparison to the control (middle panel), and spot-infiltrated leaves after 24, 48, 72, and 96 h (bottom panel). (B) Stomatal conductance measurements in NAC61-expressing leaves compared with control leaves. (C) Thermal camera visualization (top panel) and leaf temperature measurements (bottom panel) in NAC61-expressing leaves compared with controls. (D) RWC measurements in NAC61-expressing leaves compared with controls at 2 d after agroinfiltration. (E) Ion leakage measurements in NAC61-expressing leaves compared with controls from T0 (24 h after leaf agroinfiltration) to 24 h. (F) DAB staining determining H2O2 accumulation in NAC61-expressing leaves compared with control leaves at 2 d after agroinfiltration. Each value represents the mean ±SD of three biological replicates tested in technical replicate (n=3). Asterisks indicate statistically significant differences (**P<0.01; t-test). Data shown in B, C, and E have been normalized to the control value at the starting time point.
Fig. 3.
Fig. 3.
Transcriptomic responses to NAC61 overexpression in leaves of grapevine cv. ‘Thompson seedless’. (A) Functional enrichment analysis of up-regulated and down-regulated DEGs. (B) Heatmap of up-regulated DEGs involved in phenylpropanoid synthesis, regulation, and modification (Supplementary Dataset S2). Markers of the PHW process (Zenoni et al., 2016) and genes belonging to the STS GRN (Pilati et al., 2021) are highlighted according to the color code in the Venn diagram.
Fig. 4.
Fig. 4.
NAC61 DAP-seq analyses. (A) Distribution of NAC61 DNA-binding events with respect to their position from the TSS of their assigned genes. The distribution of peak positions is represented in the pie chart. (B) De novo forward binding motif obtained from the inspection of the top 600 scoring peaks of the NAC61 library using the RSAT tool. (C) Functional enrichment analysis of genes to which NAC61 bound (from –3 kb to +100 bp relative to the TSS).
Fig. 5.
Fig. 5.
Identification and validation of HCTs. (A) Venn diagram showing the number of common genes between the DAP-seq bound genes (peaks in the region from –3 kb to +100 bp relative to the TSS), DEGs (FC ≥1.5 and adjusted P-value <0.1), and GCNs (berry, leaf, and tissue-independent datasets) (Supplementary Dataset S5). The NAC61 HCTs are in the grey-shaded sections. (B) Heatmap representing the atlas expression (Fasoli et al., 2012) of the HCTs up-regulated by the overexpression of NAC61 in cv. ‘Thompson seedless’ leaves. The clusterization of HCTs was performed by using the Expression Atlases App (Corvina) within the VitViz platform (http://www.vitviz.tomsbiolab.com/), using the z-score data transformation and clustering by row. The 29 genes shared by the three datasets are highlighted in bold. Markers of the PHW process (Zenoni et al., 2016) and genes belonging to the STS GRN (Pilati et al., 2021) are indicated with violet and green circles, respectively. (C) NAC61 DNA-binding events shown as density plots and delimited between –3 kb and +100 bp from the TSS of NAC61, WRKY52, DHN1b, and MYB14. The peaks were identified by GEM and were pointed out with their corresponding signal score in the proximal promoter regions. Asterisks indicate the most significant peaks obtained by the DAP-seq analysis. The negative control corresponds to an input library generated with an empty GST-HALO vector. (D) NAC61, WRKY52, DHN1b, and MYB14 promoter activation by NAC61 tested by DLRA in infiltrated N. benthamiana leaves. LUC values are reported relative to the REN value. Each value represents the mean ±SD of three biological replicates tested in technical replicate (n=3). Asterisks indicate statistically significant differences (*P<0.05, **P<0.01; t-test).
Fig. 6.
Fig. 6.
The NAC61–NAC60 regulatory complex regulates NAC61 and MYB14 activation. (A) NAC60 DNA-binding events shown as density plots and delimited between –3 kb and +100 bp from the TSS of NAC61. The NAC60 binding motifs were searched for in three different genomic libraries (a, berry gDNA; b and c are biological replicates of leaf gDNA; D’Incà et al., 2023) (B) NAC61 expression level in grapevine leaves stably overexpressing NAC60 (OX:NAC60) and expressing the NAC60 dominant repressor (NAC60.EAR), determined by RT–qPCR. Each value is relative to the expression of UBIQUITIN1 (VIT_16s0098g01190) and represents the mean ±SD of three biological replicates (D’Incà et al., 2023). Asterisks indicate statistically significant differences (*P<0.05; t-test) in comparison to the control. (C) NAC61 promoter transactivation by NAC60 tested by DLRA in infiltrated N. benthamiana leaves. LUC values are reported relative to the REN value. Each value represents the mean ±SD of three biological replicates tested in technical replicate (n=3). Asterisks indicate statistically significant differences (**P<0.01; t-test). (D) BiFC analysis in grapevine protoplasts showing NAC61–NAC60 protein interaction. Corresponding controls are also shown. Images show a representative case of YFP signal being detected in the cell nucleus by confocal laser scanning. (E) NAC61 and MYB14 promoter activation tested by DLRA in infiltrated N. benthamiana leaves. The activity of NAC61 alone (also reported in Fig. 5D) and combined NAC61–NAC60 activity were tested. LUC values are reported relative to the REN value. Each value represents the mean ±SD of three biological replicates tested in technical replicate (n=3). Asterisks indicate statistically significant differences (**P<0.01; t-test). The data reported in C and E were derived from the same experiment and control values are therefore the same.
Fig. 7.
Fig. 7.
Trends in the expression of NAC61 and target genes during post-harvest dehydration conducted in different conditions. (A) NAC61 and MYB14 expression levels during post-harvest dehydration performed under high- and low-temperature conditions (Shmuleviz et al., 2023). Each value is relative to the expression of UBIQUITIN1 (VIT_16s0098g01190) and data presented are the mean ±SD of three biological replicates. Asterisks indicate significant differences (*P<0.05; t-test). (B) Experimental plan for noble rot induction. Berries of cv. ‘Müller Thurgau’ were collected at full maturity and put in a dehydrating room for 29 d to reach 30% weight loss. Then, half of the berries were covered to induce noble rot. The three stages (t0, t1, and t2) of infected and control berries collected for further analyses are shown with representative images. (C) Glycerol to d-gluconic acid ratio assessed as an indicator of noble rot development. Each value corresponds to the mean ±SD of three replicates. Asterisks indicate significant differences (*P<0.05; t-test). (D) NAC61, MYB14, and WRKY52 expression levels in noble-rot-induced berries tested at different phases of B. cinerea infection in cv. ‘Müller-Thurgau’ berries (noble-rot-induced samples) compared with control berries. Each value is relative to the expression of UBIQUITIN1 (VIT_16s0098g01190) and represents the mean ±SD of three biological replicates. Asterisks indicate statistically significant differences (*P<0.05, **P<0.01; t-test) of the noble-rot-induced samples compared with the controls.
Fig. 8.
Fig. 8.
Proposed model of NAC61 mechanism of action. NAC61 high-confidence targets (HCTs) related to stilbenoid metabolism and stress responses that are inherent in late- and post-ripening phases are highlighted. The regulatory mechanisms controlling NAC61 expression are also depicted. Validated mechanisms of transcriptional regulation are shown with black solid lines and hypothetical mechanisms are shown with dotted lines. Asterisks indicate genes putatively also involved in biotic stress responses (*) and abiotic/osmotic stress responses (**). The orange dotted line represents hypothetical physical interactions.

References

    1. Amato A, Cavallini E, Walker AR, et al.. 2019. The MYB5-driven MBW complex recruits a WRKY factor to enhance the expression of targets involved in vacuolar hyper-acidification and trafficking in grapevine. The Plant Journal 99, 1220–1241. - PubMed
    1. Amato A, Cavallini E, Zenoni S, Finezzo L, Begheldo M, Ruperti B, Tornielli GB.. 2016. A grapevine TTG2-like WRKY transcription factor is involved in regulating vacuolar transport and flavonoid biosynthesis. Frontiers in Plant Science 7, 1979. - PMC - PubMed
    1. Antico CJ, Colon C, Banks T, Ramonell KM.. 2012. Insights into the role of jasmonic acid-mediated defenses against necrotrophic and biotrophic fungal pathogens. Frontiers in Biology 7, 48–56.
    1. Aydemir BÇ, Özmen CY, Kibar U, Mutaf F, Büyük PB, Bakır M, Ergül A.. 2020. Salt stress induces endoplasmic reticulum stress-responsive genes in a grapevine rootstock. PLoS One 15, e0236424. - PMC - PubMed
    1. Balazadeh S, Kwasniewski M, Caldana C, Mehrnia M, Zanor MI, Xue GP, Mueller-Roeber B.. 2011. ORS1, an H2O2-responsive NAC transcription factor, controls senescence in Arabidopsis thaliana. Molecular Plant 4, 346–360. - PMC - PubMed

Publication types