. 2023 Dec;248(23):2262-2272.
doi: 10.1177/15353702231220667. Epub 2023 Dec 30.

IP3R-1 aggravates endotoxin-induced acute lung injury in mice by regulating MAM formation and mitochondrial function

Affiliations

IP3R-1 aggravates endotoxin-induced acute lung injury in mice by regulating MAM formation and mitochondrial function

Shuan Dong et al. Exp Biol Med (Maywood). 2023 Dec.

Abstract

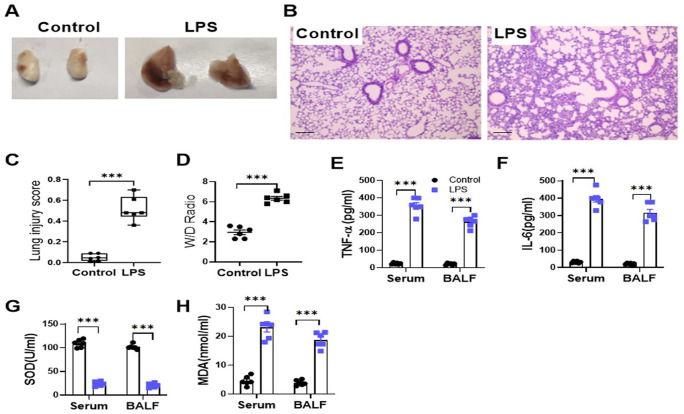
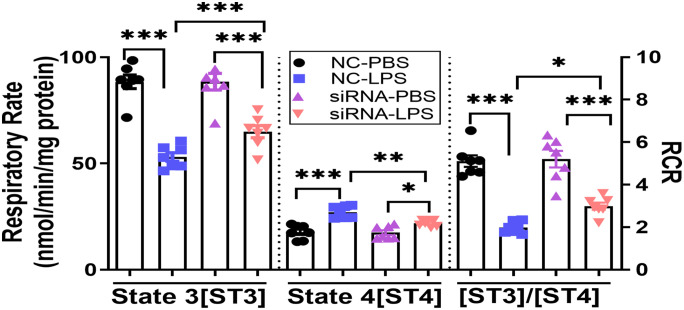
Acute lung injury (ALI) caused by endotoxin represents one of the common clinical emergencies. Mitochondria-associated endoplasmic reticulum membranes (MAM) serve as a critical link between mitochondria and endoplasmic reticulum (ER), which has an essential effect on maintaining intracellular homeostasis. As an important component of MAM, type-1 inositol-1,4,5-trisphosphate receptor (IP3R-1) mediates the ER-to-mitochondrial transport of Ca2+. This study explored the role of IP3R-1 and MAM in ALI. Besides the levels of inflammasome-associated components interleukin (IL)-6, tumor necrosis factor (TNF)-α, and malonyldialdehyde (MDA) were increased in both bronchoalveolar lavage fluid (BALF) and serum, increased cross-sectional area of mitochondria, elevated MAM formation, and decreased respiratory control ratio (RCR) were observed within lung tissues collected in lipopolysaccharide (LPS)-treated mice, accompanied by upregulation of IP3R-1 in total lung lysates and MAM. Ca2+ uptake level in the mitochondria, production of reactive oxygen species (ROS) in the mitochondria, and the formation of MAM were elevated within LPS-treated MLE-12 cells, and all those changes in response to LPS were partly inhibited by knocking down of IP3R-1 expression in MLE-12 cells. Collectively, IP3R-1 has a critical effect on MAM formation and mitochondrial dysfunction, which could be innovative therapeutic targets for ALI caused by endotoxin.

Keywords: Ca2+; Endotoxin-induced acute lung injury; IP3R-1; MAM; mitochondria.


Conflict of interest statement

Declaration Of Conflicting InterestsThe author(s) declared no potential conflicts of interest with respect to the research, authorship, and/or publication of this article.

Figures

Figure 1.
Figure 1.
Administration of endotoxin could lead to severe lung injury. Data are presented for the lungs harvested from LPS-treated and control mice. (A) The gross morphology of the isolated lungs. (B) The photomicrographs showing sections under H&E staining. Scale bar = 100 µm. (C) Lung injury score assessment. (D) Lung wet/dry weight ratio. (E) to (H) ELISA for TNF-α, IL-6, and MDA-7 protein expression (E to G) and SOD activity (H) in the serum and BALF. The ALI scores were represented as median (Min, Max) and analyzed by Mann–Whitney U-test. n = 6; ***P < 0.001. In (E) to (H), all bars indicate mean ± SEM. n = 6; ***P < 0.001; Student’s t-test.
Figure 2.
Figure 2.
Endotoxin-induced lung injury leads to increased ER and mitochondrial interaction in the lung. Data are presented for the lungs harvested from LPS-treated and control mice. (A) Typical TEM images showing mouse lung sections after either endotoxin or saline challenge. Scale bar: 1 µm (right panel) and 500 nm (left panel). M: mitochondria (white arrow), ER: endoplasmic reticulum (black arrow). (B) to (D) The total number of mitochondria per field (B), the cross-sectional area of mitochondria per field (C), and the ratio between the percent of mitochondria connected to ER to the total mitochondrial perimeter (D). (E) Respiratory control ratio (RCR). All bars indicate mean ± SEM. n = 6~7; *P < 0.05; **P < 0.01; ***P < 0.001; Student’s t-test.
Figure 3.
Figure 3.
MAM-related protein expression in the total lung lysates collected in endotoxin-induced ALI mice. Data are presented for the lungs harvested from LPS-treated and control mice. (A) Western-blotting assay on the expression of IP3R-1, IP3R-2, Mfn-2, PACS-2, and Sig-1R protein levels within total lung lysates. (B) to (F) Protein quantification within the total lung lysates. All bars represent mean ± SEM. n = 3; *P < 0.05; Student’s t-test.
Figure 4.
Figure 4.
Western-blotting assay on the indicated proteins in different subcellular fractions of the lung lysates. Data are presented for the lungs harvested from LPS-treated and control mice. (A) Expression of PDI, Grp-75, and IP3R-1 from different subcellular fractions. (B) to (D) Expressions of IP3R-1 and Mfn-2 in the MAM fraction of the lung lysates. (E) and (F) Western-blotting assay and quantitative analysis on IP3R-2 expression kinetics in the MAM fractions. PM: pure mitochondria; CM: crude mitochondria; MAM: mitochondria-associated endoplasmic reticulum membranes; ER: endoplasmic reticulum. All bars indicate mean ± SEM. *P < 0.05; n = 3; Student’s t-test or one-way ANOVA.
Figure 5.
Figure 5.
Specific knockdown of IP3R-1 inhibited the ER and mitochondria interaction in MLE-12 cells challenged with LPS. (A) Representative TEMs of control MLE-12 (NC-siRNA) and knockdown MLE-12 (IP3R-1 siRNA) cells following either endotoxin or PBS treatments. Scale bar: 1 µm. White arrow indicates endoplasmic reticulum interacted with mitochondria. (B) to (D) The total number of mitochondria per field (B), the cross-sectional area of mitochondria per field (C), and the ratio between the percent of mitochondria connected to ER to the total mitochondrial perimeter (D). M: mitochondria. All bars are mean ± SEM. n = 6; *P < 0.05; ***P < 0.001; one-way ANOVA.
Figure 6.
Figure 6.
Oxygen consumption measurements in isolated mitochondria from MLE-12 cells under different treatments. The graph indicates the mean ± SEM. n = 7; *P < 0.05; **P < 0.01; ***P < 0.001; one-way ANOVA.
Figure 7.
Figure 7.
Mitochondrial Ca2+ influx, ROS, and mitochondrial membrane potential levels measured within different treated MLE-12 cells. Mitochondrial Ca2+ signal was determined with Rhod-2AM staining, ROS was determined with MitoSOX, mitochondrial membrane potential was analyzed with TMRM through flow cytometry. The mean fluorescence intensity (MFI) expressed as Geom. Mean is presented in each histogram overlay.
Figure 8.
Figure 8.
Visualization of the VDAC-1/IP3R-1 complex by immunofluorescence. VDAC-1 was stained with DsRED (red), IPR3-1 was stained using FITC (green), whereas nucleus was stained using DAPI (blue). The yellow color on the merged images illustrates colocalization between VDAC-1 and IPR3-1. Scale bar = 50 µm.
Figure 9.
Figure 9.
Knockdown of IP3R-1 decreased the colocalization coefficient in MLE-12 cells challenged with LPS. (A) and (B) Quantification of the colocalization of VDAC-1 and IP3R-1 was performed by calculating Mander’s colocalization coefficient. The graph represents mean ± SEM; n = 3; *P < 0.05; one-way ANOVA.

Similar articles

Cited by

References

    1. Singer M, Deutschman CS, Seymour CW, Shankar-Hari M, Annane D, Bauer M, Bellomo R, Bernard GR, Chiche JD, Coopersmith CM, Hotchkiss RS, Levy MM, Marshall JC, Martin GS, Opal SM, Rubenfeld GD, van der Poll T, Vincent JL, Angus DC, et al.. The third international consensus definitions for sepsis and septic shock (Sepsis-3). JAMA 2016;315:801–10 - PMC - PubMed
    1. Cuthbertson BH, Elders A, Hall S, Taylor J, MacLennan G, Mackirdy F, Mackenzie SJ; Scottish Critical Care Trials Group; Scottish Intensive Care Society Audit Group. Mortality and quality of life in the five years after severe sepsis. Crit Care 2013;17:R70 - PMC - PubMed
    1. Liang L, Moore B, Soni A. National inpatient hospital costs: the most expensive conditions by payer. 2017, https://www.ncbi.nlm.nih.gov/books/NBK561141/ - PubMed
    1. Millar FR, Summers C, Griffiths MJ, Toshner MR, Proudfoot AG. The pulmonary endothelium in acute respiratory distress syndrome: insights and therapeutic opportunities. Thorax 2016;71:462–73 - PubMed
    1. ARDS Definition Task Force; Ranieri VM, Rubenfeld GD, Thompson BT, Ferguson ND, Caldwell E, Fan E, Camporota L, Slutsky AS. Acute respiratory distress syndrome: the Berlin Definition. JAMA 2012;307:2526–33 - PubMed