. 2023 Dec;248(23):2393-2407.
doi: 10.1177/15353702231220671. Epub 2023 Dec 30.

2-Bromopalmitate inhibits malignant behaviors of HPSCC cells by hindering the membrane location of Ras protein

Affiliations

2-Bromopalmitate inhibits malignant behaviors of HPSCC cells by hindering the membrane location of Ras protein

Chen Wang et al. Exp Biol Med (Maywood). 2023 Dec.

Abstract

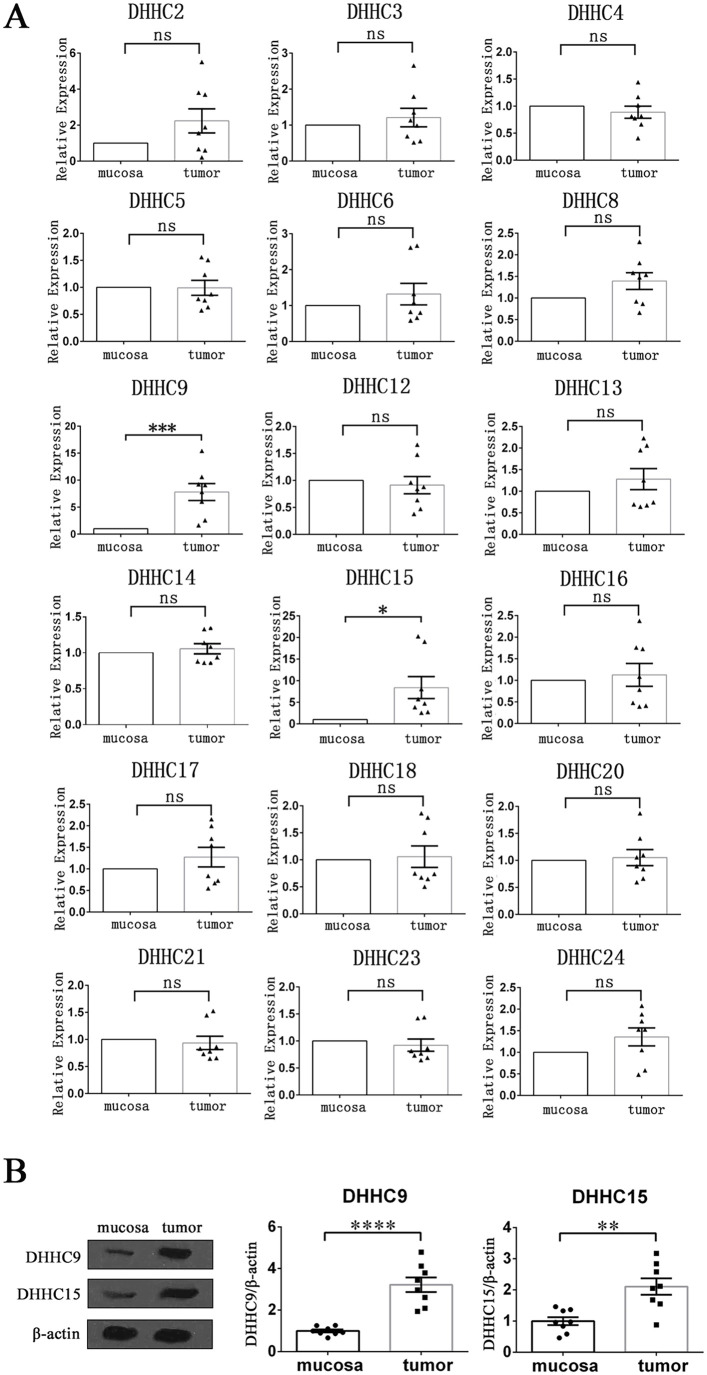
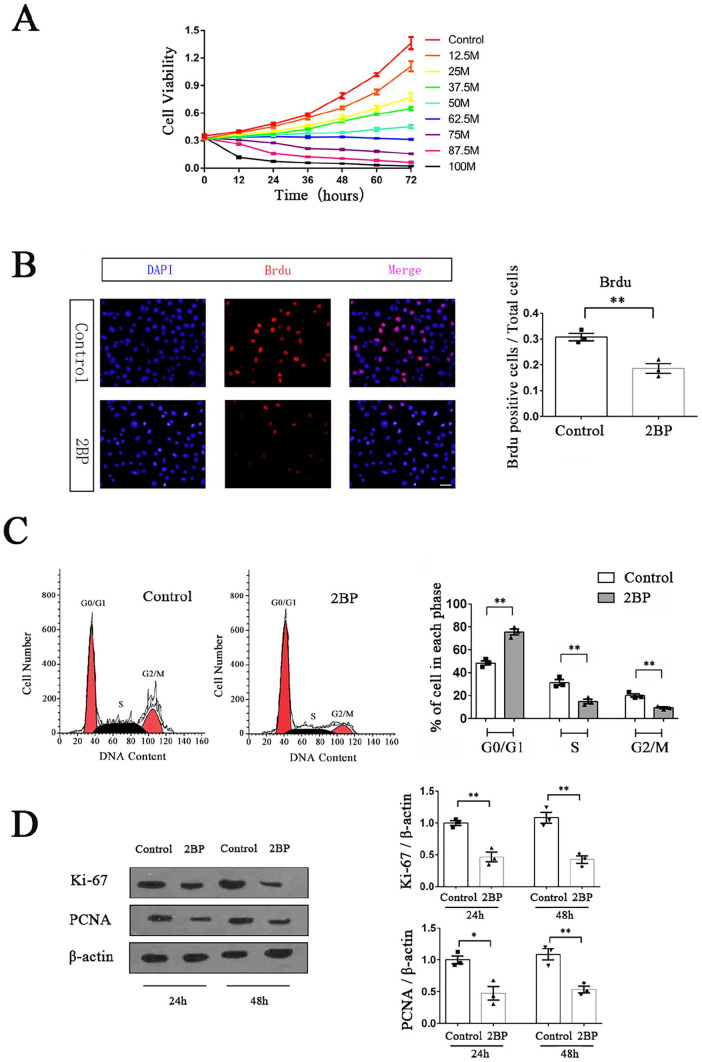
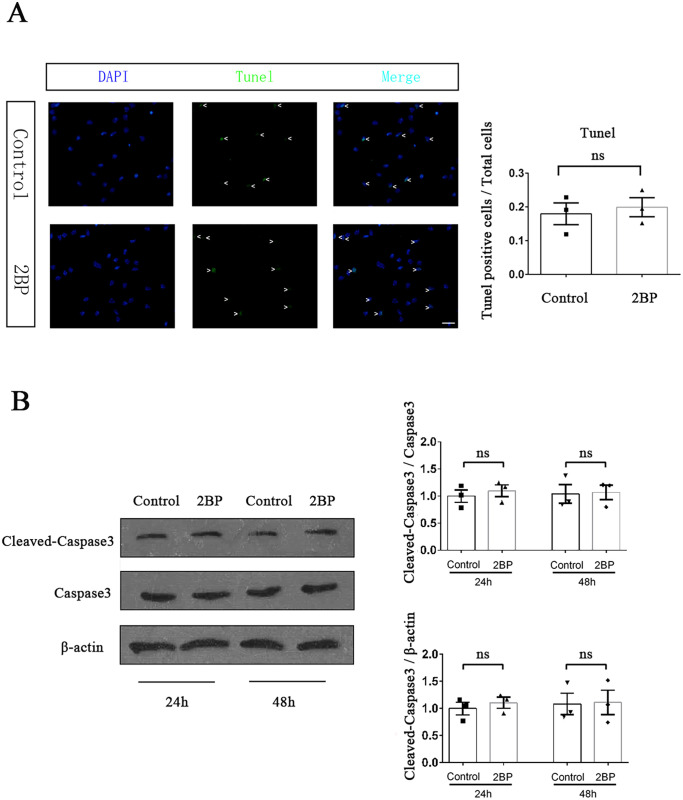
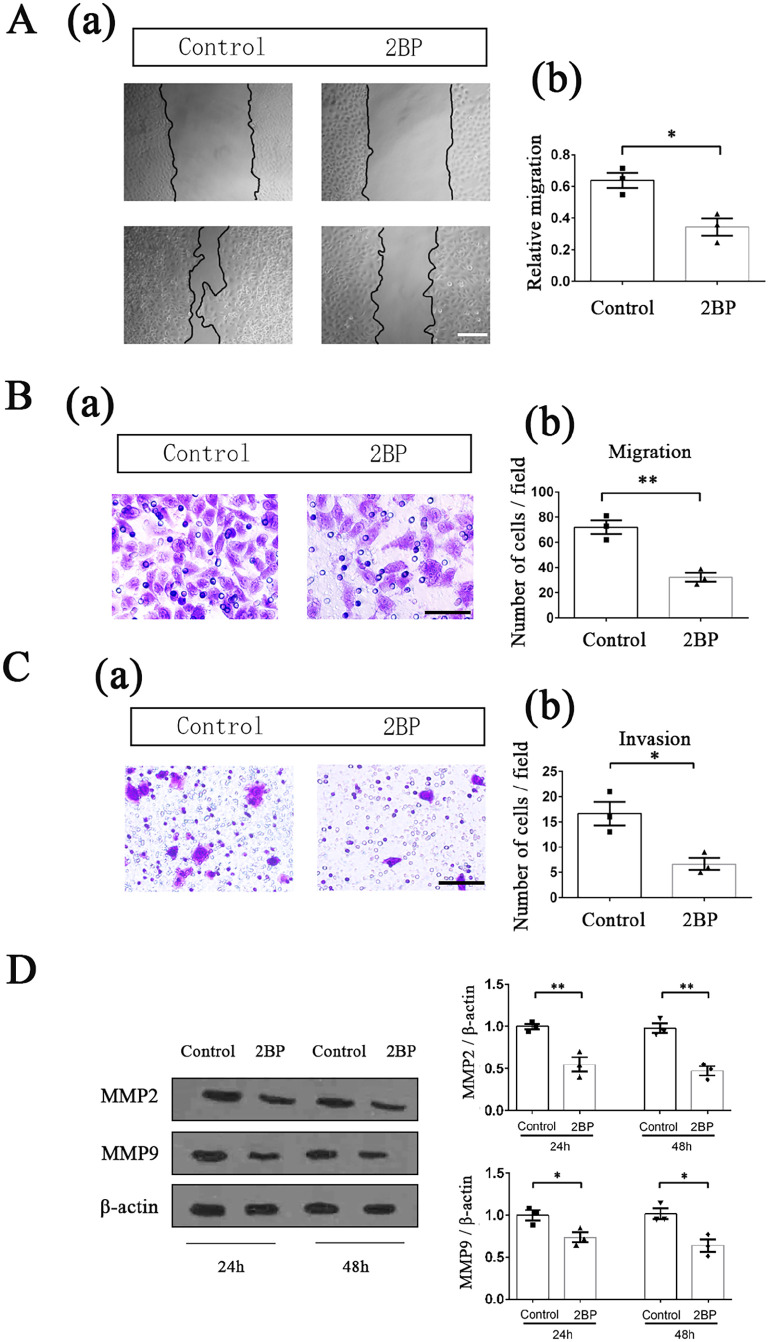
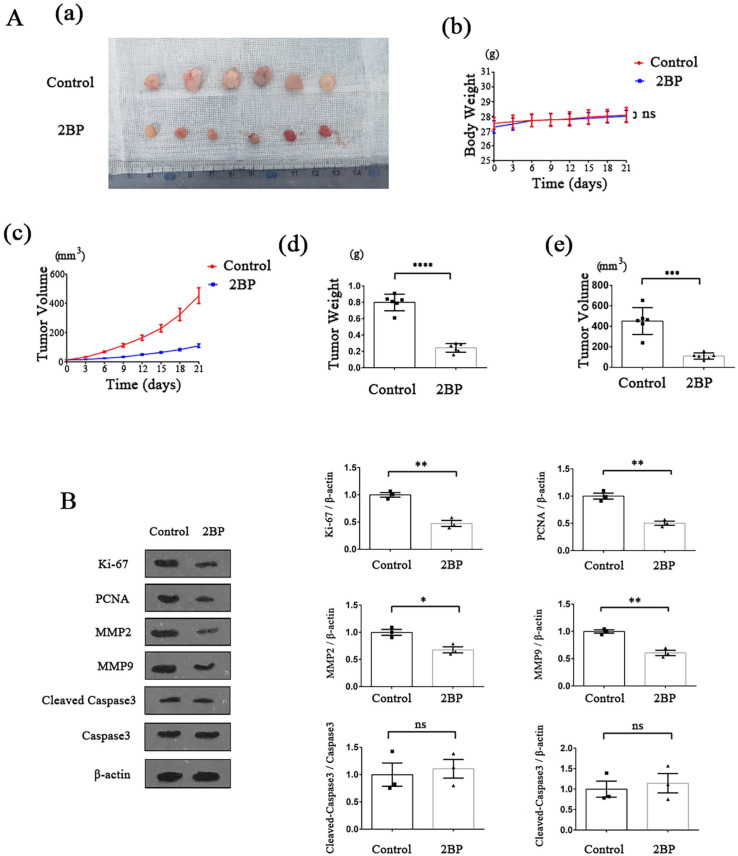
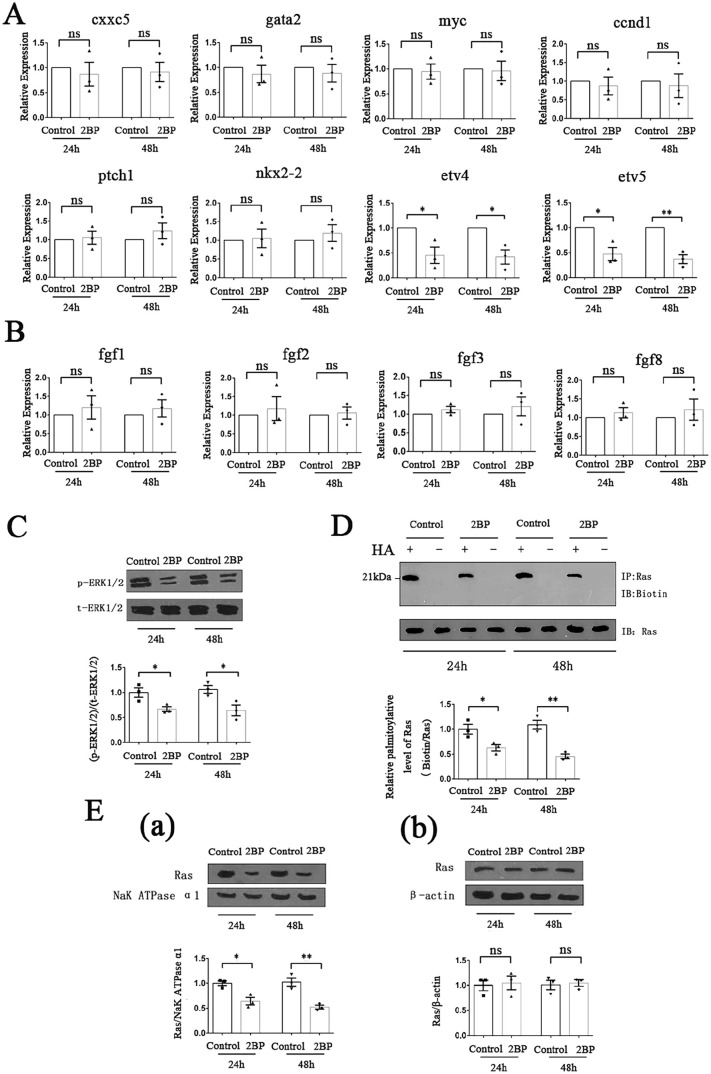
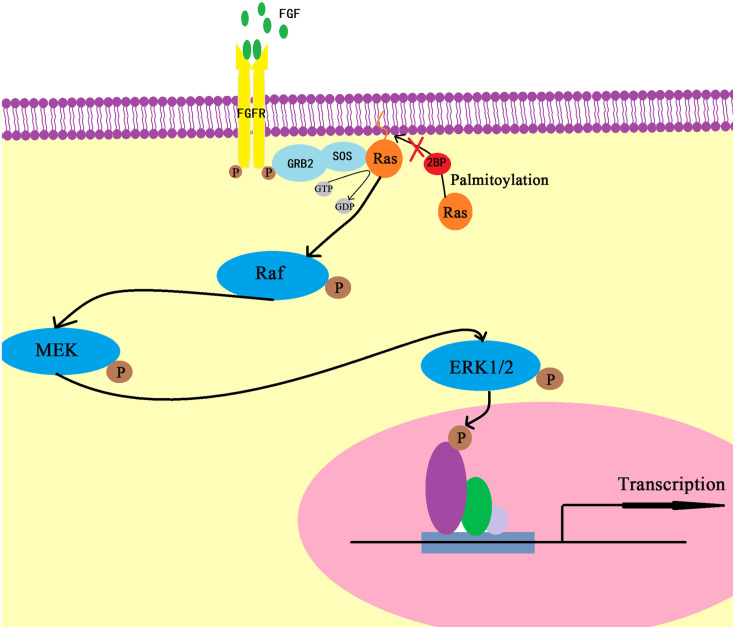
Palmitoylation, which is mediated by protein acyltransferase (PAT) and performs important biological functions, is the only reversible lipid modification in organism. To study the effect of protein palmitoylation on hypopharyngeal squamous cell carcinoma (HPSCC), the expression levels of 23 PATs in tumor tissues of 8 HPSCC patients were determined, and high mRNA and protein levels of DHHC9 and DHHC15 were found. Subsequently, we investigated the effect of 2-bromopalmitate (2BP), a small-molecular inhibitor of protein palmitoylation, on the behavior of Fadu cells in vitro (50 μM) and in nude mouse xenograft models (50 μmol/kg), and found that 2BP suppressed the proliferation, invasion, and migration of Fadu cells without increasing cell apoptosis. Mechanistically, the effect of 2BP on the transduction of BMP, Wnt, Shh, and FGF signaling pathways was tested with qRT-PCR, and its drug target was explored with western blotting and acyl-biotinyl exchange assay. Our results showed that 2BP inhibited the transduction of the FGF/ERK signaling pathway. The palmitoylation level of Ras protein decreased after 2BP treatment, and its distribution in the cell membrane structure was reduced significantly. The findings of this work reveal that protein palmitoylation mediated by DHHC9 and DHHC15 may play important roles in the occurrence and development of HPSCC. 2BP is able to inhibit the malignant biological behaviors of HPSCC cells, possibly via hindering the palmitoylation and membrane location of Ras protein, which might, in turn, offer a low-toxicity anti-cancer drug for targeting the treatment of HPSCC.

Keywords: 2-Bromopalmitate; FGF/ERK signaling pathway; Ras protein; hypopharyngeal squamous cell carcinoma; malignant behaviors; protein palmitoylation.


Conflict of interest statement

Declaration of conflicting interestsThe author(s) declared no potential conflicts of interest with respect to the research, authorship, and/or publication of this article.

Figures

Figure 1.
Figure 1.
Expression levels of PATs in HPSCC tumor tissues and normal mucosa tissues. (A) qRT-PCR was performed to detect and compare the mRNA expression levels of PATs (DHHC protein family) in tumor tissues and normal mucosal tissues of 8 HPSCC patients. β-actin acted as an internal control. Data were shown as mean ± SEM. (B) The protein expression levels of DHHC9 and DHHC15 in tumor tissues and normal mucosal tissues of 8 HPSCC patients were determined with western blotting. The gray value of each strip was detected by Image J software. β-actin acted as an internal control. Standardized data were shown as mean ± SEM.
Figure 2.
Figure 2.
2BP inhibited the proliferation of HPSCC cells. (A) MTT method was used to detect the cell viability of Fadu cells treated with different concentrations of 2BP in 72 h. Cell viability-time curves were drawn, and their slopes represented the cell growth rates. (B) Brdu labeling assay was performed to compare the proliferation of Fadu cells between the 2BP-treated group (50 μM) and the control group at 48 h after drug treatment. Scale bar represented 30 μm. Brdu positive cells (red)/total cells (blue) were calculated and shown as mean ± SEM. (C) The cell cycle distribution of Fadu cells at 48 h after drug treatment was determined with flow cytometry. Percentages of cells in G0/G1, S, and G2/M phase were shown as mean ± SEM. (D) The protein expression levels of Ki-67 and PCNA were determined with western blotting assay at 24 and 48 h after drug treatment. The gray value of each strip was detected by Image J software. β-Actin acted as an internal control. Standardized data were shown as mean ± SEM.
Figure 3.
Figure 3.
50 μM 2BP did not increase the apoptosis of Fadu cells. (A) TUNEL assay was performed to compare the apoptosis of Fadu cells between the 2BP-treated group (50 μM) and the control group at 48 h after drug treatment. TUNEL positive cells (green)/total cells (blue) were calculated and shown as mean ± SEM. Scale bar represents 30 μm. (B) The protein expression level of cleaved-caspase3 was determined with western blotting assay at 24 and 48 h after drug treatment. The gray value of each strip was detected by Image J software. Capases3 and β-actin acted as internal control, respectively. Standardized data were shown as mean ± SEM.
Figure 4.
Figure 4.
50 μM 2BP inhibited the migration and invasion of HPSCC cells. Effect of 2BP on the migration of Fadu cells was tested by wound-healing experiment. (a) Fadu cells were scraped with a pipette tip and then incubated with or without 50 μM 2BP for 48 h. The area of the scratch was measured with the Image J software. Scale bar represents 100 μm. (b) Relative migration was quantified as (Initial scratch area—scratch area after 48 h)/Initial scratch area. Data were shown as mean ± SEM. (B) Effect of 2BP on migration of Fadu cells was tested by transwell system in which the fibrous membrane was not coated with matrigel. (a) Migrational cells on the bottom side of the membrane were photographed and counted after 50 μM 2BP treatment for 48 h. Scale bar represented 30 μm. (b) Quantification of migrational cells. The migrational cells were counted in 10 different fields, and the average was calculated. Data were presented as mean ± SEM. (C) Effect of 2BP on invasion of Fadu cells was tested by matrigel-coated transwell system. (a) Invasive cells on the bottom side of the membrane were photographed and counted after 50 μM 2BP treatment for 48 h. Scale bar represents 60 μm. (b) Quantification of invasive cells. The invasive cells were counted in 10 different fields, and the average was calculated. Data were presented as mean ± SEM. (D) The protein expression levels of MMP2 and MMP9 were determined with western blotting assay at 24 and 48 h after drug treatment. The gray value of each strip was detected by Image J software. β-Actin acted as an internal control. Standardized data were shown as mean ± SEM.
Figure 5.
Figure 5.
Effect of 2BP on HPSCC cells in nude mouse xenograft model. HPSCC nude mouse xenograft model was established, and the effect of 2BP on tumor growth was monitored (n = 6 for each group). (A) (a) After 21-day drug treatment period, tumors were resected and photographed. (b) The body weight of the nude mice was measured every 3 days, and the weight-time curves were shown. Within 21-day drug treatment period, there was no significant difference in body weight between the 2BP-treated group and the control group. Data were shown as mean ± SEM. (c) The tumor volume of the nude mice was measured every 3 days and the tumor volume-time curves were shown. Data were shown as mean ± SEM. (d) and (e) After 21-day drug treatment period, nude mice were executed and tumors were resected. The volume and weight of tumors were measured. Data were shown as mean ± SEM. (B) The protein expression levels of Ki-67, PCNA, MMP2, MMP9, and cleaved-caspase3 in the resected tumors of 2BP-treated group and control group were determined with western blotting assay. The gray value of each strip was detected by Image J software. For Ki-67, PCNA, MMP2, and MMP9, β-actin acted as an internal control. For cleaved-caspase3, capases3, and β-actin acted as internal control, respectively. Standardized data were shown as mean ± SEM.
Figure 6.
Figure 6.
2BP interfered with FGF/ERK signaling transduction by suppressing the palmitoylation of Ras protein and hindering its membrane localization. HPSCC cells were treated with or without 50 μM 2BP for 24 and 48 h. (A) Transcription levels of cxxc5, gata2, myc, ccnd1, ptch1, nkx2-2, etv4, and etv5 were detected with qRT-PCR. β-Actin acted as an internal control. Data were shown as mean ± SEM. (B) Transcription levels of fgf1, fgf2, fgf3, and fgf8 were detected with qRT-PCR. β-Actin acted as an internal control. Data were shown as mean ± SEM. (C) Protein level of p-ERK1/2 were determined with western blotting assay. The gray value of each strip was detected by Image J software. t-ERK1/2 acted as an internal control. Standardized data were shown as mean ± SEM. (D) The palmitoylation level of Ras protein was detected using the ABE method. Palmitoylated Ras protein was labeled with biotin and then determined. Total Ras protein served as internal control. Standardized data were shown as mean ± SEM. (E) 2BP hindered the membrane localization of Ras protein. (a) Membrane proteins of HPSCC cells were extracted and the protein level of Ras was determined with western blotting assay. The gray value of each strip was detected by Image J software. NaK ATPase α1 served as an internal control. Standardized data were shown as mean ± SEM. (b) Total proteins of HPSCC cells were extracted and the protein level of Ras was determined with western blotting assay. The gray value of each strip was detected by Image J software. β-Actin served as an internal control. Standardized data were shown as mean ± SEM.
Figure 7.
Figure 7.
Schematic diagram of underlying molecular mechanism.

Similar articles

Cited by

References

    1. Wang S, Osgood AO, Chatterjee A. Uncovering post-translational modification-associated protein-protein interactions. Curr Opin Struct Biol 2022;74:102352. - PMC - PubMed
    1. Taro C, Takahisa F. Post-translational modification enzymes as key regulators of ciliary protein trafficking. J Biochem 2021;169:633–42 - PMC - PubMed
    1. Won SJ, Martin BR. Temporal profiling establishes a dynamic S-palmitoylation cycle. ACS Chem Biol 2018;13:1560–8 - PMC - PubMed
    1. Zhang M, Zhou L, Xu Y, Yang M, Xu Y, Komaniecki GP, Kosciuk T, Chen X, Lu X, Zou X, Linder ME, Lin H. A STAT3 palmitoylation cycle promotes TH17 differentiation and colitis. Nature 2020;586:434–9 - PMC - PubMed
    1. Jiang H, Zhang X, Chen X, Aramsangtienchai P, Tong Z, Lin H. Protein lipidation: occurrence, mechanisms, biological functions, and enabling technologies. Chem Rev 2018;118:919–88 - PMC - PubMed