. 2024 Jan 23;43(1):113622.
doi: 10.1016/j.celrep.2023.113622. Epub 2023 Dec 29.

ATM-deficiency-induced microglial activation promotes neurodegeneration in ataxia-telangiectasia

Affiliations

ATM-deficiency-induced microglial activation promotes neurodegeneration in ataxia-telangiectasia

Jenny Lai et al. Cell Rep. .

Abstract

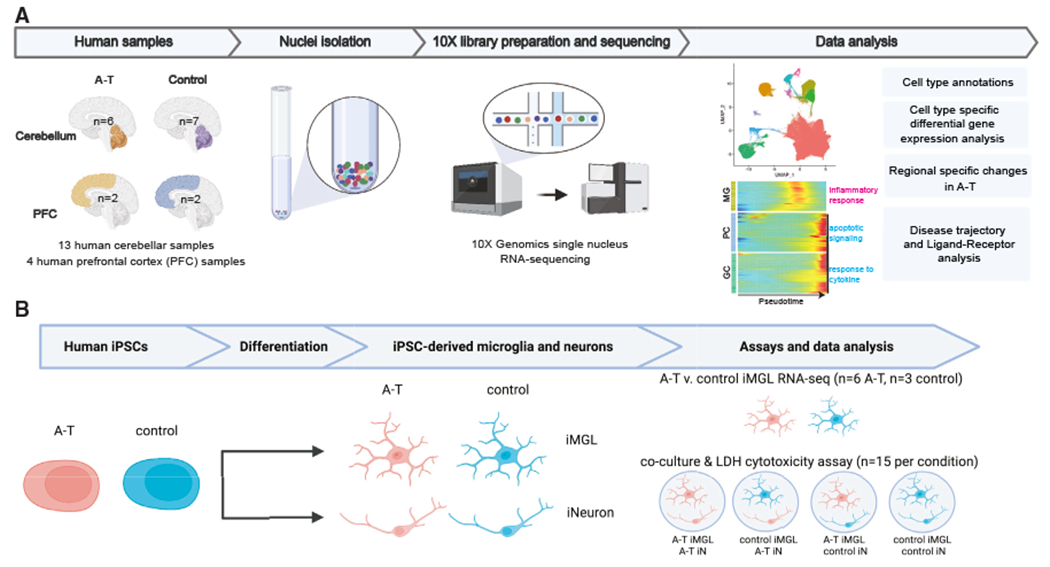
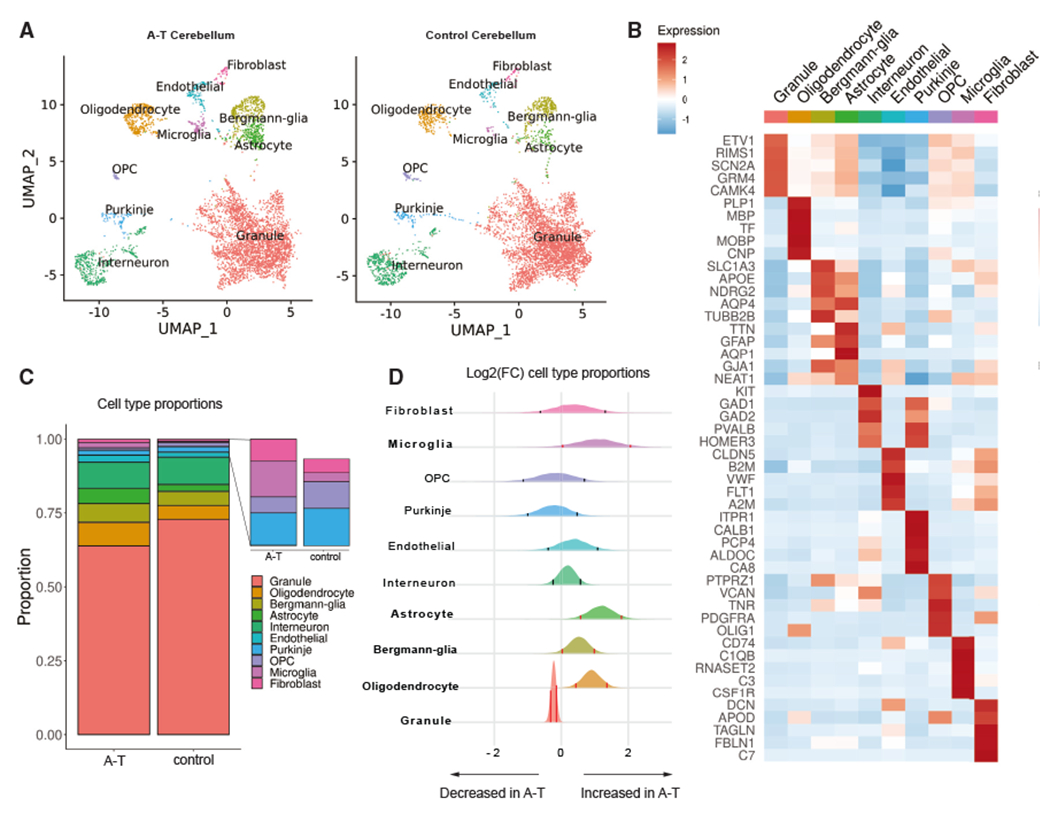
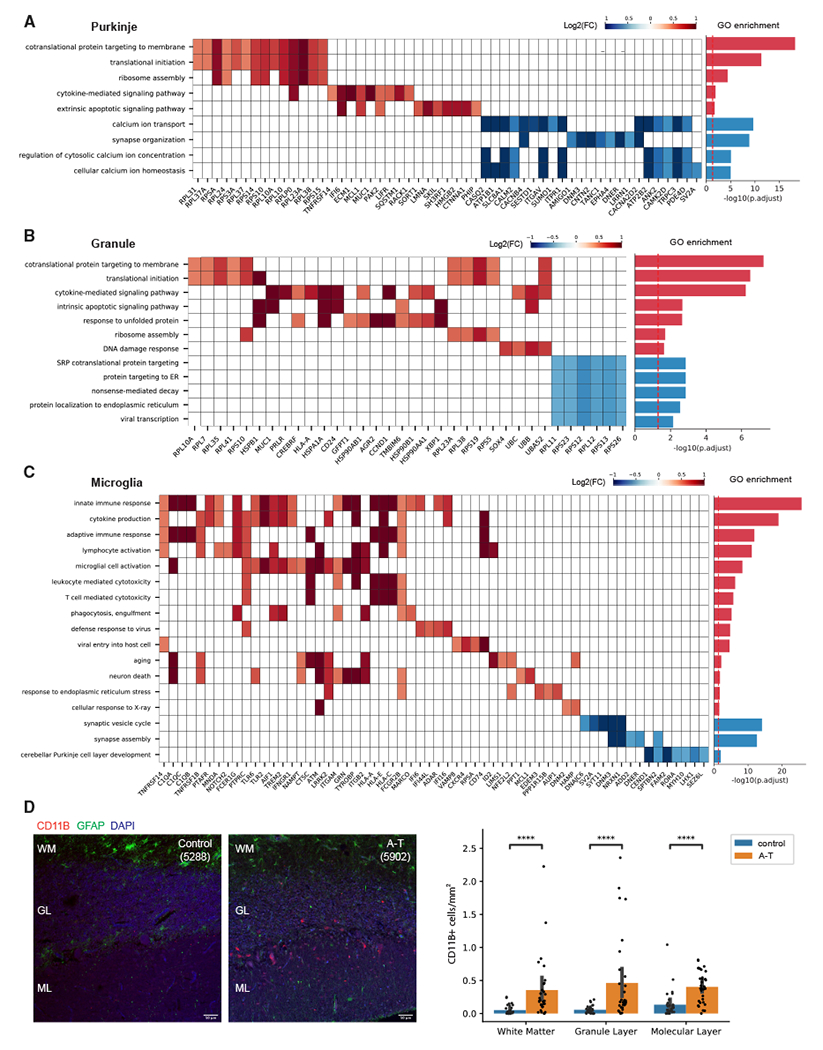
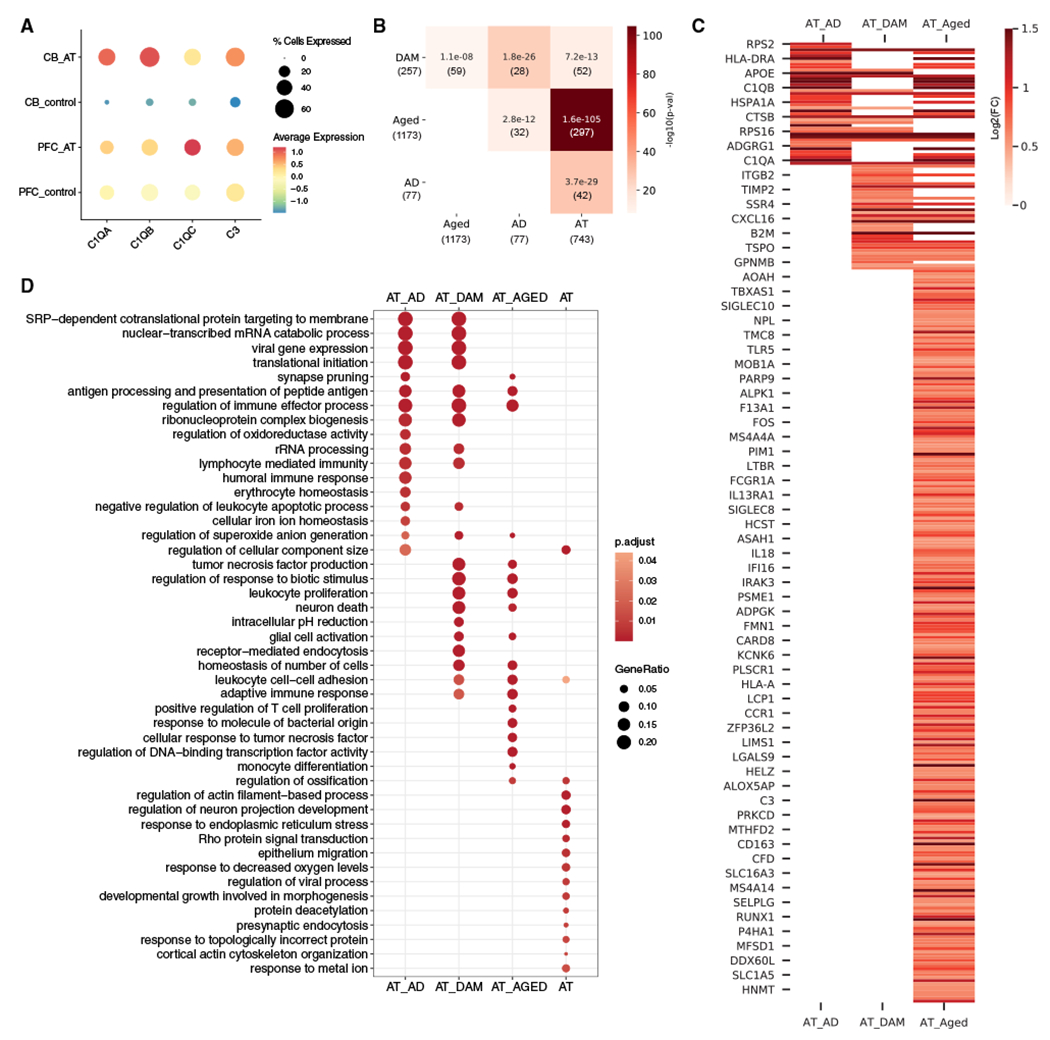
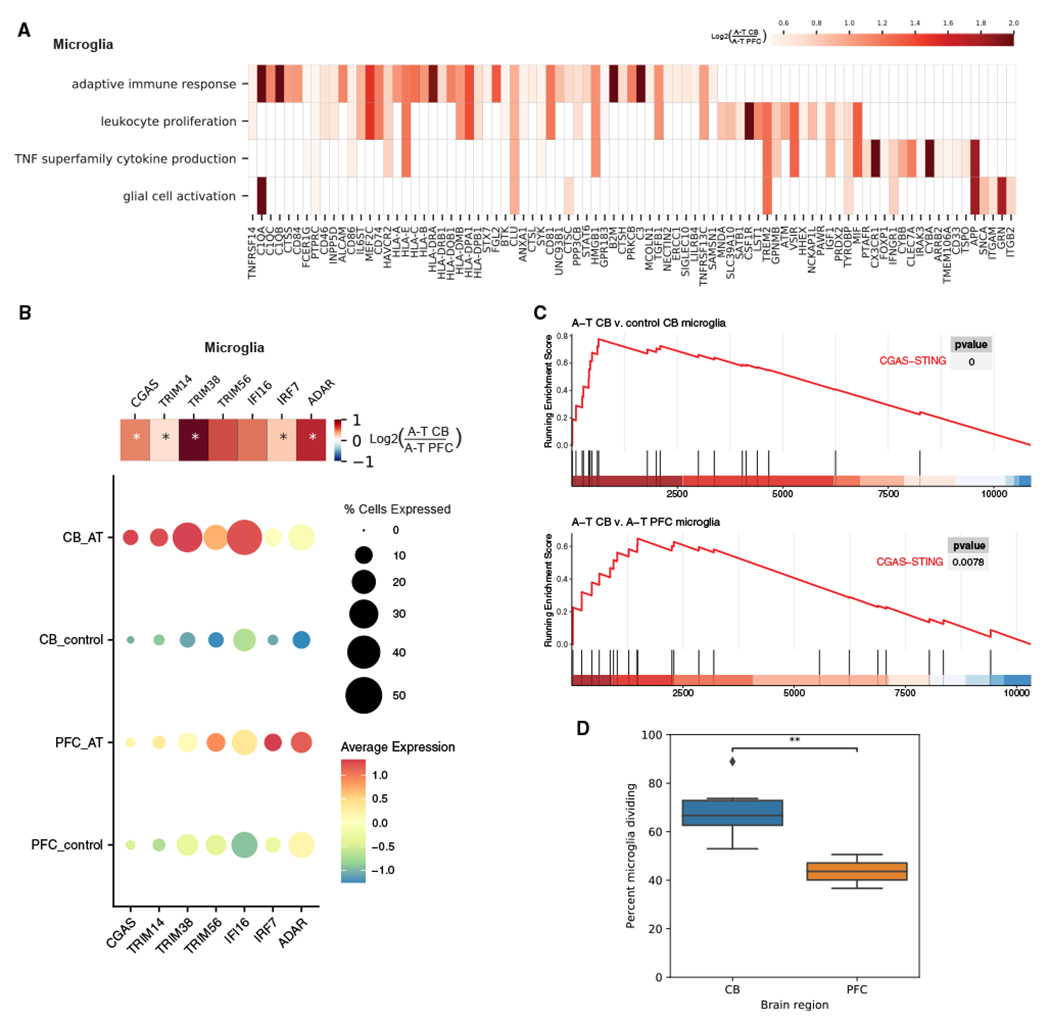
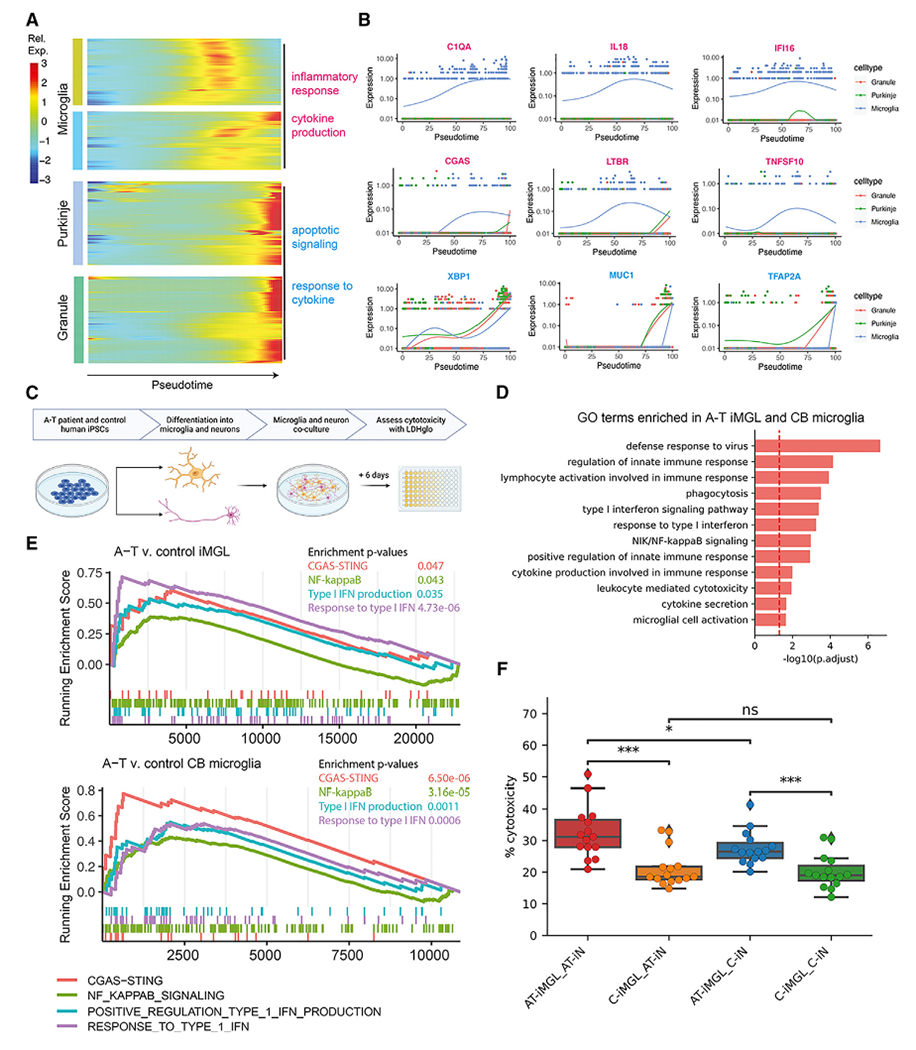
While ATM loss of function has long been identified as the genetic cause of ataxia-telangiectasia (A-T), how it leads to selective and progressive degeneration of cerebellar Purkinje and granule neurons remains unclear. ATM expression is enriched in microglia throughout cerebellar development and adulthood. Here, we find evidence of microglial inflammation in the cerebellum of patients with A-T using single-nucleus RNA sequencing. Pseudotime analysis revealed that activation of A-T microglia preceded upregulation of apoptosis-related genes in granule and Purkinje neurons and that microglia exhibited increased neurotoxic cytokine signaling to granule and Purkinje neurons in A-T. To confirm these findings experimentally, we performed transcriptomic profiling of A-T induced pluripotent stem cell (iPSC)-derived microglia, which revealed cell-intrinsic microglial activation of cytokine production and innate immune response pathways compared to controls. Furthermore, A-T microglia co-culture with either control or A-T iPSC-derived neurons was sufficient to induce cytotoxicity. Taken together, these studies reveal that cell-intrinsic microglial activation may promote neurodegeneration in A-T.

Keywords: CP: Neuroscience; ataxia-telangiectasia; cerebellar degeneration; microglial activation; single-nucleus RNA-sequencing.


Conflict of interest statement

Declaration of interests The authors declare no competing interests.

Figures

Figure 1.
Figure 1.. Dissecting cell-type-specific contributions to neurodegeneration in ataxia-telangiectasia using single-nucleus RNA sequencing of postmortem brain and patient iPSC-derived cultures
(A) Schematic overview of single-nucleus RNA sequencing (snRNA-seq) experimental design and computational analyses. (B) Schematic overview of ataxia-telangiectasia (A-T) patient and control human iPSC-derived experimental design. n represents the number of independent culture wells. MG, microglia; PC, Purkinje cells; GC, granule cells; iMGL, iPSC-derived microglia; iN, iPSC-derived neurons.
Figure 2.
Figure 2.. Cell types resolved in A-T and control human cerebellum by snRNA-seq
(A) Uniform manifold approximation and projection (UMAP) dimensionality reduction plot of major cell types identified in A-T and control human cerebellum, downsampled to 10,000 cells for each condition. (B) Top five marker genes for each major cell type in control cerebellum. Heatmap depicts centered and scaled log-normalized expression values. (C) Cell-type proportions in A-T and control cerebellum. (D) Relative abundance of cell types in A-T versus control cerebellum, shown as the posterior distribution of log2(proportion in A-T/proportion in control) with 89% credible interval. Red bars highlight credible intervals that do not overlap 0. Bolded cell-type labels indicate a significant difference in relative abundance.
Figure 3.
Figure 3.. Gene Ontology (GO) analysis of differentially expressed genes in A-T cerebellum
(A–C) Select enriched GO biological processes among DEGs in (A) A-T Purkinje neurons, (B) granule neurons, and (C) microglia. Select genes in each pathway and their log2 fold changes (A-T/control) shown in the heatmap. Bar plot shows significance of pathway enrichment among upregulated genes (red) and downregulated genes (blue). (D) CD11B immunostaining of postmortem cerebellar cortex from A-T and control. WM, white matter; GL, granule layer; ML, molecular layer. Quantification of CD11B+ cells across cerebellar cortex layers in A-T and control. Error bar represents 95% confidence interval. ****Bonferroni-adjusted p < 1e—04, Mann-Whitney U test. Scale bar, 50 μm.
Figure 4.
Figure 4.. A-T cerebellar microglia share transcriptomic signatures with aging and neurodegenerative microglia
(A) Average scaled expression of complement components C1QA, C1QB, C1QC, and C3 in microglia from A-T and control cerebellum (CB) and prefrontal cortex (PFC). (B) Overlap between A-T microglia upregulated genes and human Alzheimer’s disease (AD) microglia markers, disease-associated microglia (DAM) markers, and human aging microglia markers (Aged). Overlap p values from Fisher’s exact test shown in each cell. Color represents —log10(overlap p value). Number of genes in each set and intersection are shown in parentheses. (C) Heatmap of A-T microglia log2 fold changes (false discovery rate [FDR] < 0.05) for overlapping microglia markers. AT_AD, A-T and Alzheimer’s disease microglia overlapping genes; AT_DAM, A-T and DAM overlapping genes; AT_AGED, A-T and human aging microglia overlapping genes. (D) GO biological process enrichment of overlapping microglia markers. AT, A-T microglia-only upregulated genes. Pathways with FDR <0.05 shown.
Figure 5.
Figure 5.. Stronger activation of microglia in A-T CB compared to PFC
(A) Heatmap showing enriched GO biological processes and log2 fold changes of significant DEGs in each pathway with greater upregulation in A-T CB microglia than A-T PFC microglia. (B) Dot plot of average scaled expression of CGAS-STING pathway genes in microglia of the CB and PFC in A-T and control. Heatmap shows log2 fold change of CGAS-STING pathway genes in A-T cerebellar microglia versus A-T PFC microglia. *FDR < 0.05. (C) Gene set enrichment analysis (GSEA) plot for the CGAS-STING pathway in A-T CB microglia versus control microglia (top) and A-T CB versus A-T PFC microglia (bottom). (D) Percentage of microglia putatively in replicating phase in control CB and PFC. **p < 0.01, t test.
Figure 6.
Figure 6.. A-T patient iPSC-derived microglia reveal cell-intrinsic activation and increased cytotoxicity in neuronal co-cultures
(A) Heatmap of genes that significantly change over aligned pseudotime in microglia, Purkinje neurons, and granule neurons clustered by pseudotemporal expression patterns. Each cluster is annotated with enriched GO terms (FDR < 0.05). (B) Expression of select inflammatory genes (magenta) and apoptotic signaling and response to cytokine genes (cyan) over aligned pseudotime in microglia, Purkinje neurons, and granule neurons. (C) Schematic of A-T and control iPSC-microglia (iMGLs) and iPSC-neuron (iNs) co-culture experiment. (D) GO terms enriched among genes upregulated in A-T iMGL and A-T cerebellar microglia versus control. (E) GSEA plots for CGAS-STING, NF-κB, type I interferon (IFN) production, and response to type I IFN pathways in A-T versus control iMGLs (top) and A-T versus control CB microglia (bottom). (F) Percentage of cytotoxicity of iMGL and iN co-cultures based on LDH-based cytotoxicity assay (bottom). C, PGP1 control. *p < 0.05 and ***p < 0.001, ns, not significant, Mann-Whitney U test.

References

    1. Savitsky K, Bar-Shira A, Gilad S, Rotman G, Ziv Y, Vanagaite L, Tagle DA, Smith S, Uziel T, Sfez S, et al. (1995). A single ataxia telangiectasia gene with a product similar to PI-3 kinase. Science 268, 1749–1753. - PubMed
    1. Petley E, Yule A, Alexander S, Ojha S, and Whitehouse WP (2022). The natural history of ataxia-telangiectasia (A-T): A systematic review. PLoS One 17, e0264177. - PMC - PubMed
    1. Lavin MF, and Shiloh Y (1997). The genetic defect in ataxia-telangiectasia. Annu. Rev. Immunol 15, 177–202. - PubMed
    1. Watters D, Khanna KK, Beamish H, Birrell G, Spring K, Kedar P, Gatei M, Stenzel D, Hobson K, Kozlov S, et al. (1997). Cellular localisation of the ataxia-telangiectasia (ATM) gene product and discrimination between mutated and normal forms. Oncogene 14, 1911–1921. - PubMed
    1. Zhang Y, Lee JH, Paull TT, Gehrke S, D’Alessandro A, Dou Q, Gladyshev VN, Schroeder EA, Steyl SK, Christian BE, and Shadel GS (2018). Mitochondrial redox sensing by the kinase ATM maintains cellular antioxidant capacity. Sci. Signal 11, eaaq0702. - PMC - PubMed

Publication types

MeSH terms