

A longitudinal transcriptomic analysis of Rhipicephalus microplus midgut upon feeding
- PMID: 38159432
- PMCID: PMC10947743
- DOI: 10.1016/j.ttbdis.2023.102304
A longitudinal transcriptomic analysis of Rhipicephalus microplus midgut upon feeding
Abstract
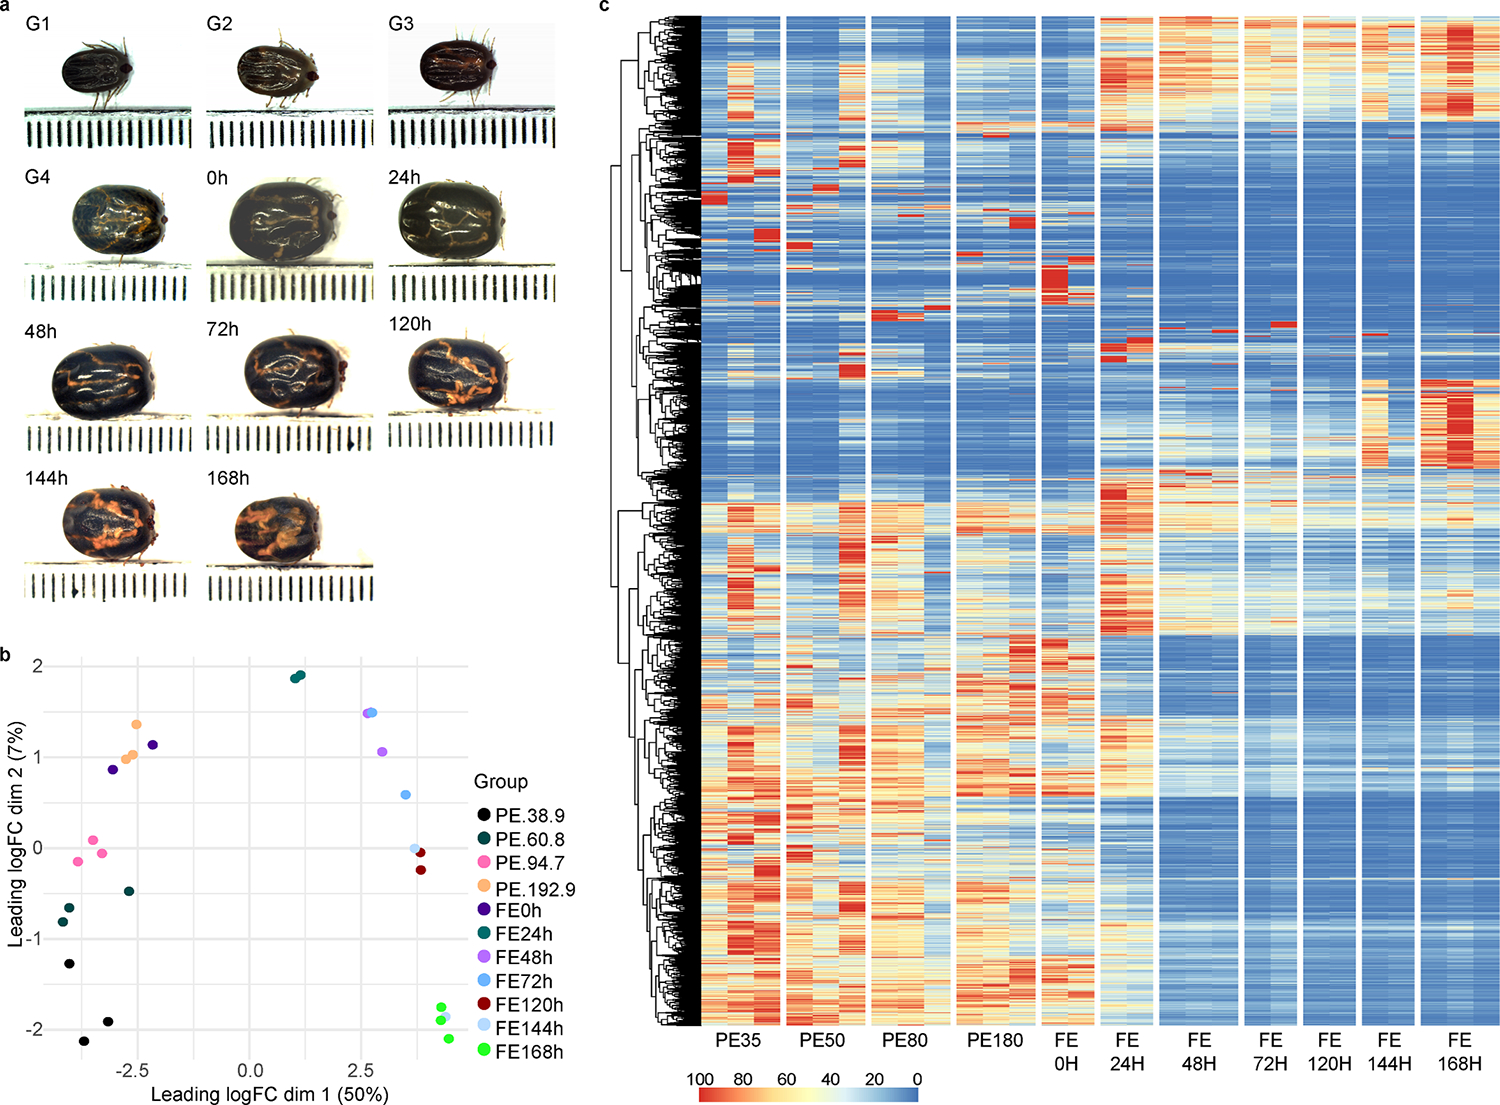
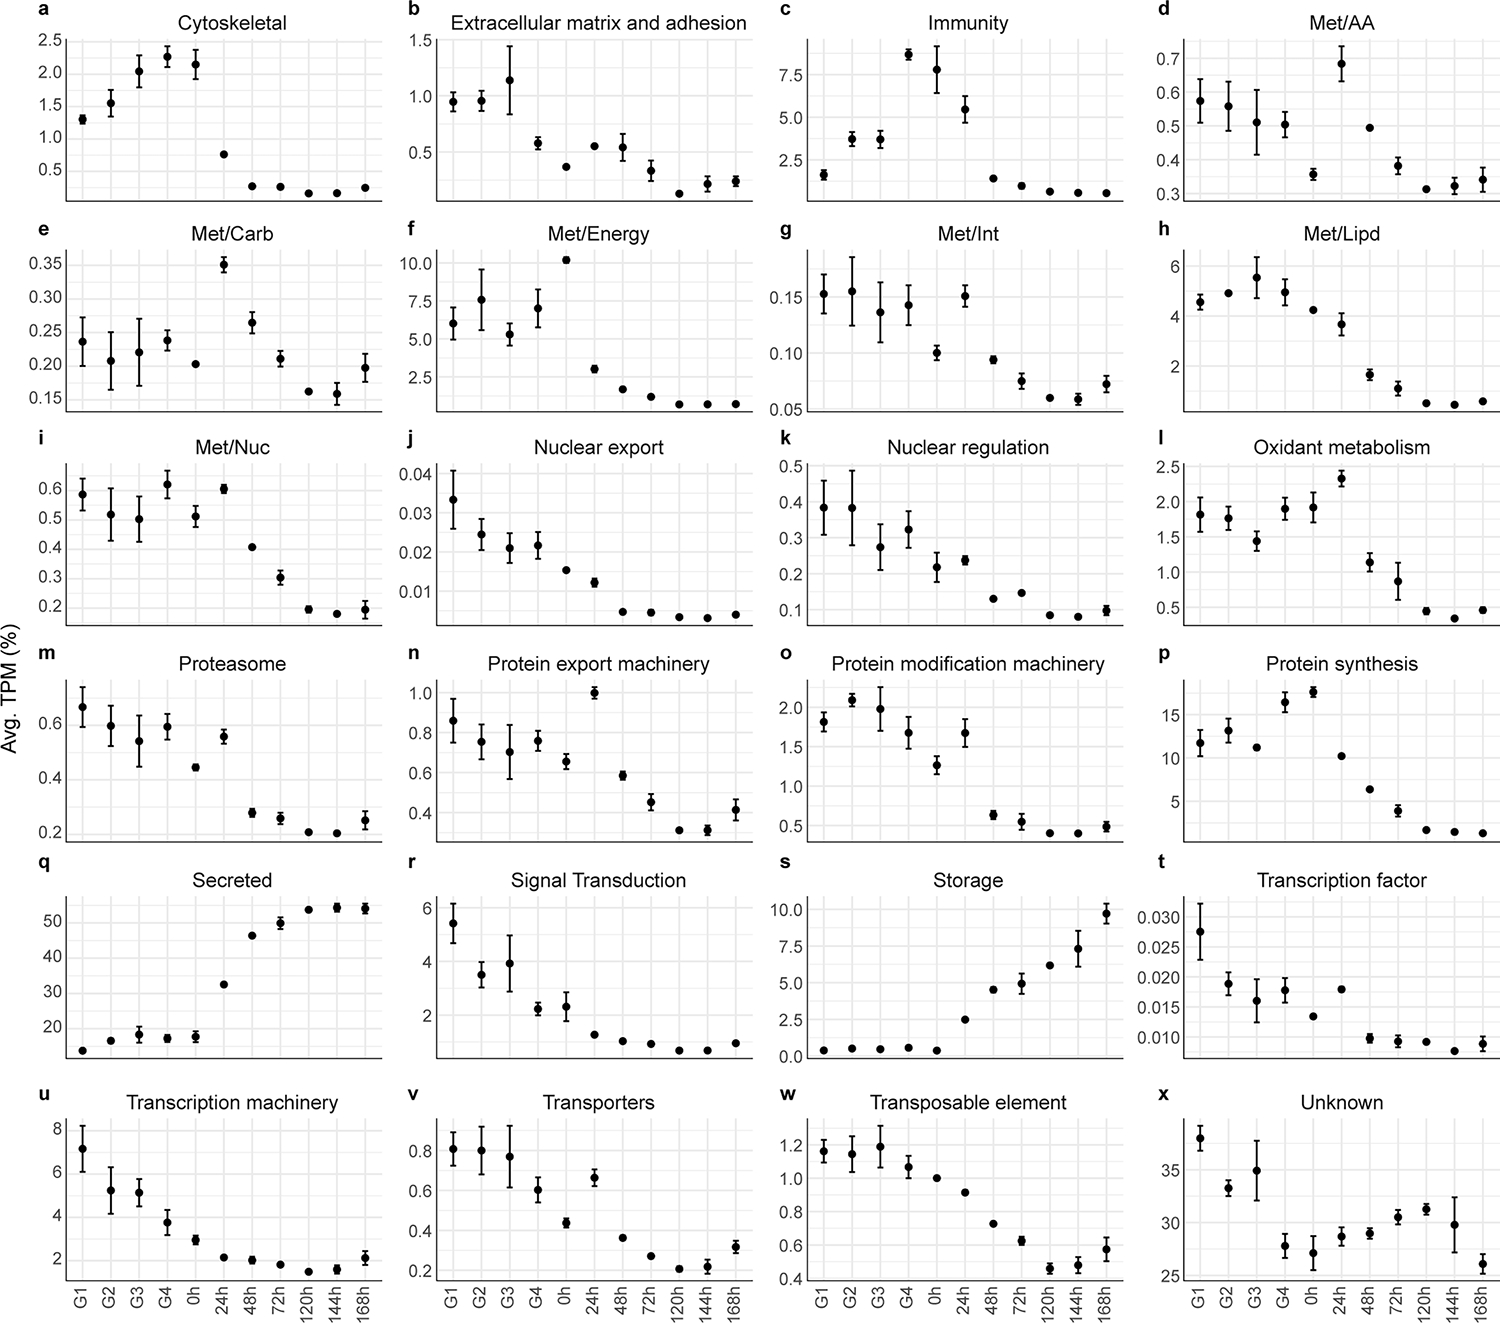
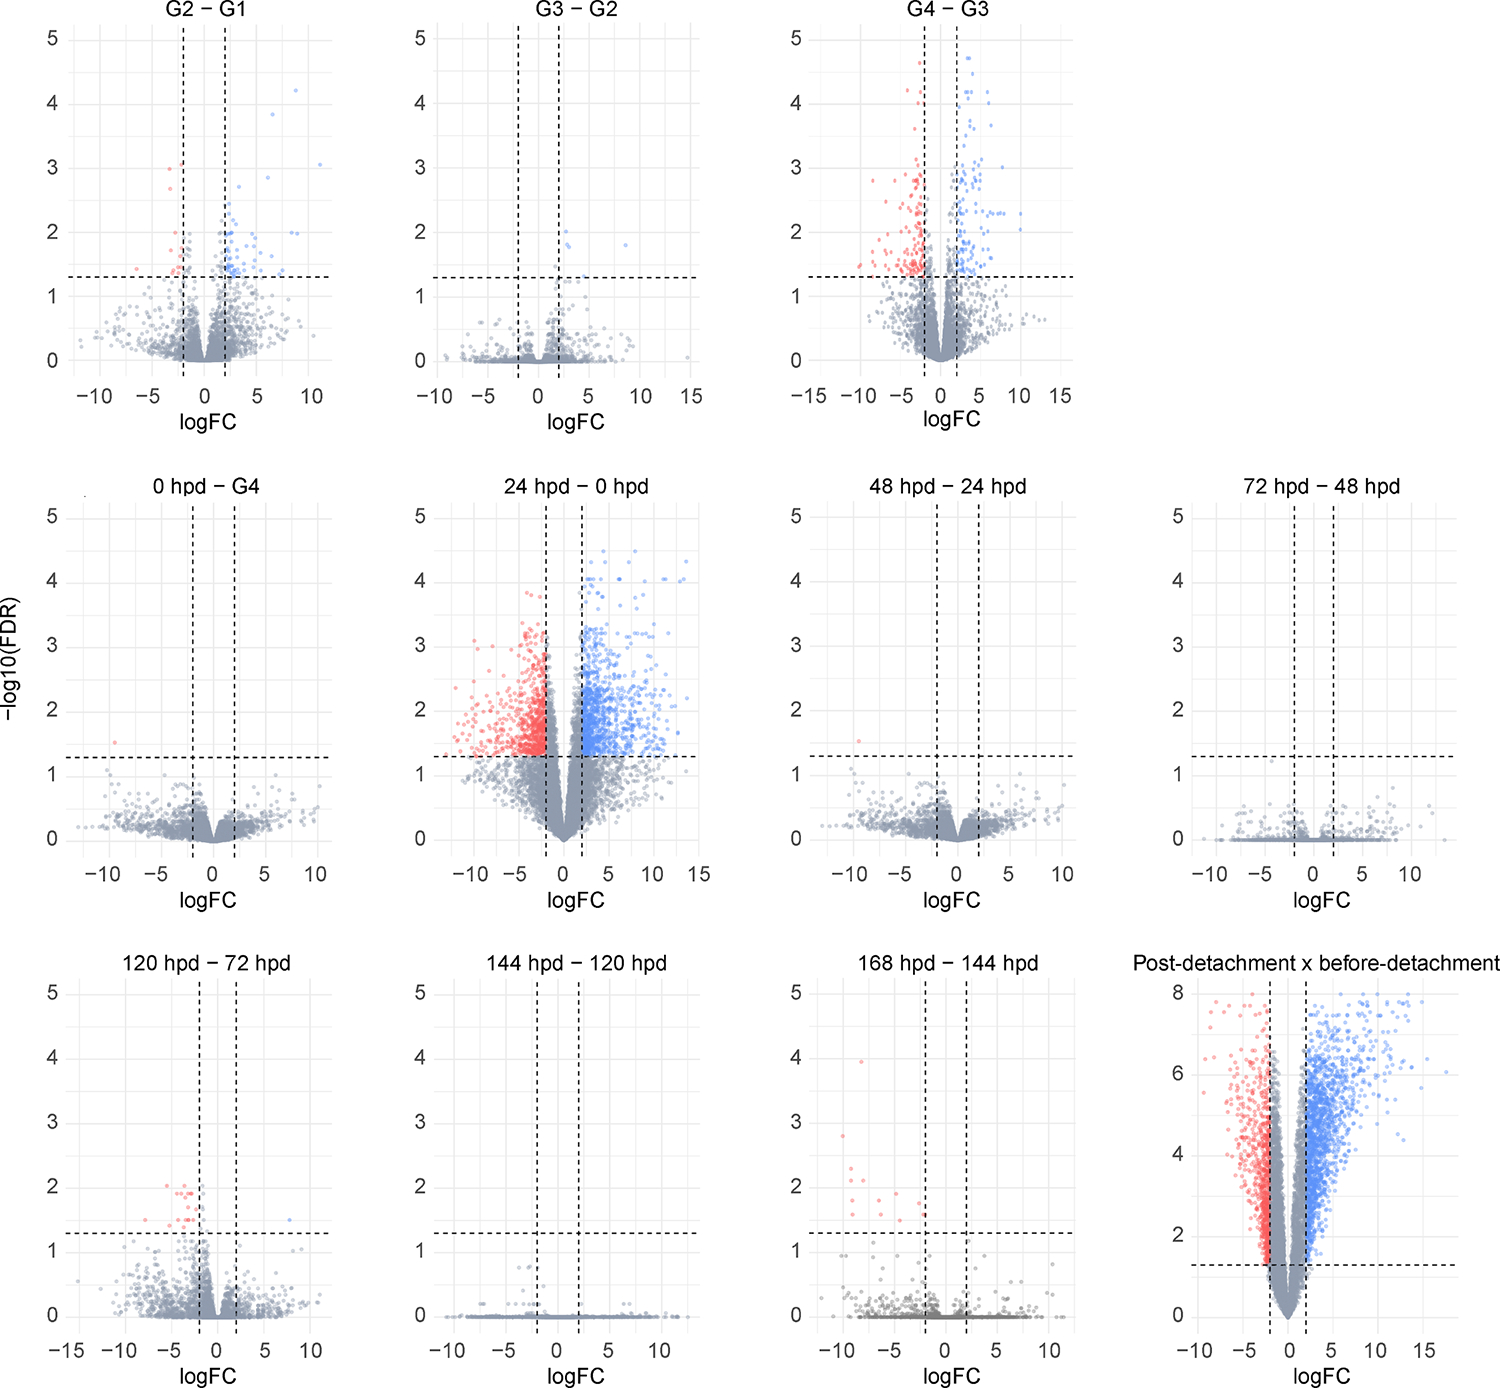
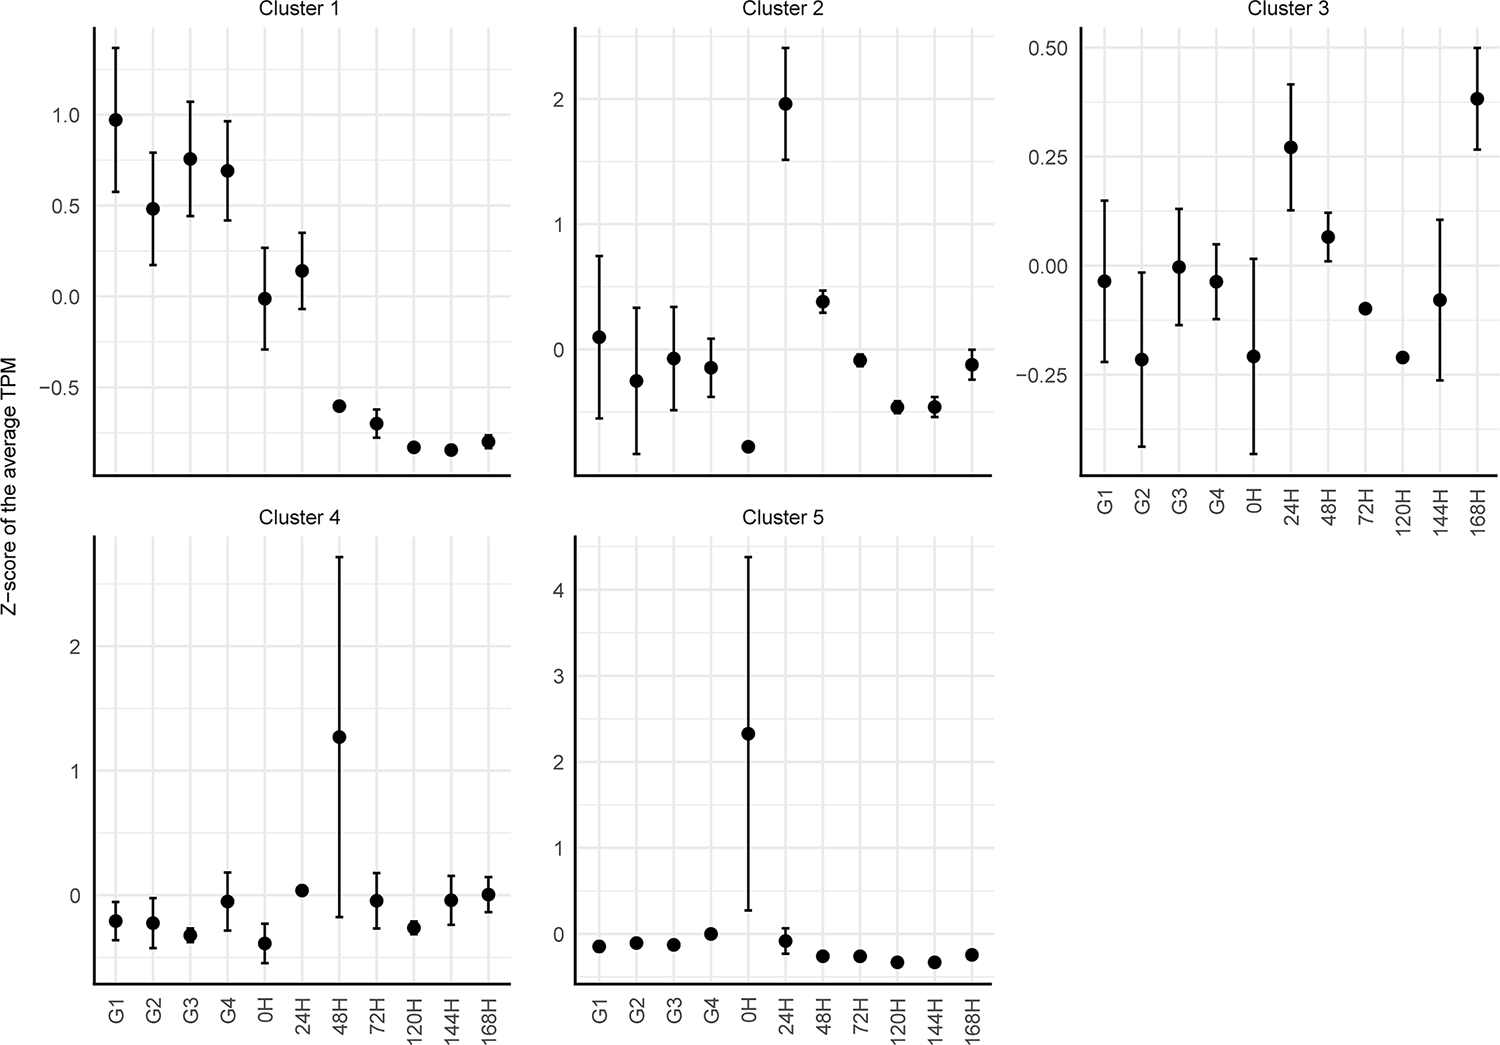
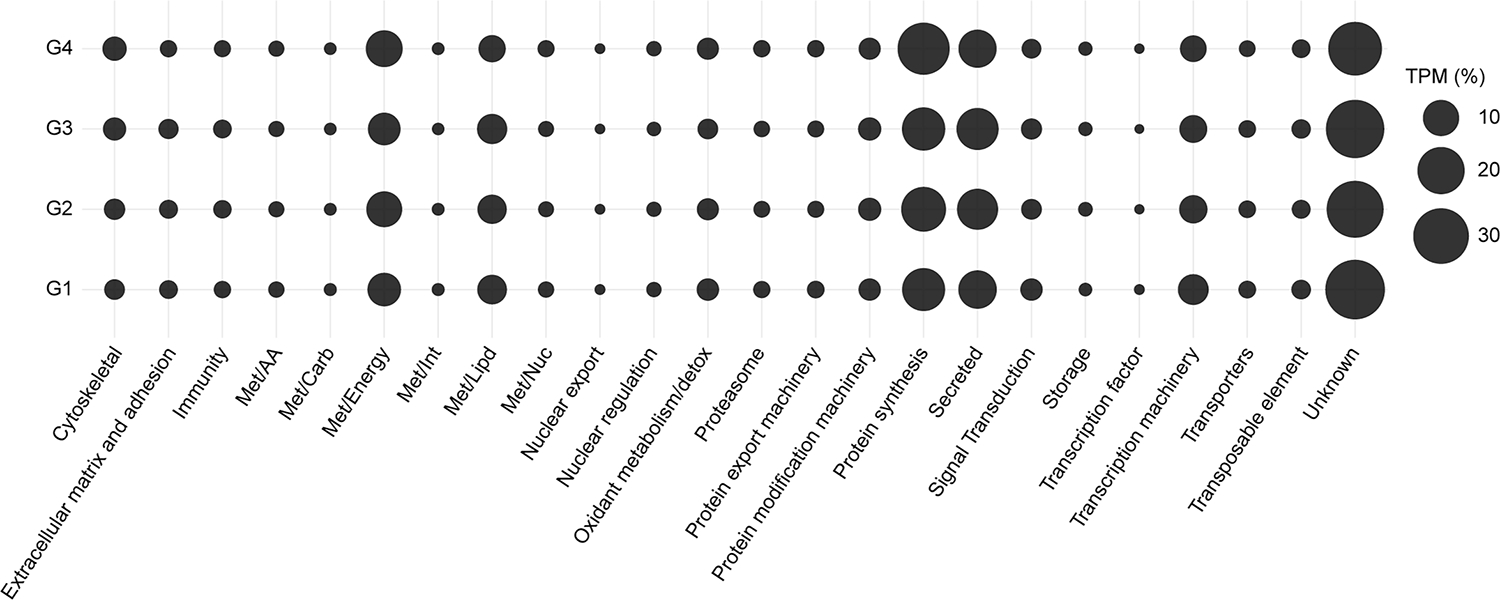
Rhipicephalus microplus, a highly host-specific tick that primarily feeds on cattle, posing a significant threat to livestock production. The investigation of tick physiology is crucial for identifying potential targets in tick control. Of particular interest adult female ticks undergo a significant expansion of the midgut during feeding, leading to an over 100-fold increase in body weight. Beyond the functions of storing and digesting blood meals, the tick midgut plays a crucial role in acquiring and transmitting pathogens. However, our understanding of tick midgut physiology remains limited. In this study we conducted a comprehensive longitudinal transcriptome analysis of the midgut from adult female R. microplus ticks collected at various feeding stages, providing an overview of the transcriptional modulation in this organ as feeding progress. By employing a de novo assembly approach followed by coding-sequences (CDS) extraction, 60,599 potential CDS were identified. In preparation for functional annotation and differential expression analysis, transcripts that showed an average transcript per million (TPM) ≥ 3 in at least one of the biological conditions were extracted. This selection process resulted in a total of 10,994 CDS, which were categorized into 24 functional classes. Notably, our differential expression analysis revealed three main transcriptional profiles. In the first one, representing the slow-feeding stage, the most abundant functional classes were the "protein synthesis" and "secreted" groups, reflecting the highly active state of the tick midgut. The second profile partially accounts for the rapid-feeding stage, in which a high number of differentially expressed transcripts was observed. Lastly, the third transcriptional profile represents post-detached ticks. Notably the highest number of modulated transcripts was observed up to 48 h post-detachment (hpd), however no major differences was observed up to 168 hpd. Overall, the data presented here offers a temporal insight into tick midgut physiology, contributing to the identification of potential targets for the development of anti-tick control strategies.
Keywords: Blood meal digestion; Midgut; RNA-sequencing; Ticks.
Copyright © 2023. Published by Elsevier GmbH.
Figures
Similar articles
-
Exploring midgut expression dynamics: longitudinal transcriptomic analysis of adult female Amblyomma americanum midgut and comparative insights with other hard tick species.bioRxiv [Preprint]. 2024 Sep 24:2024.09.20.614175. doi: 10.1101/2024.09.20.614175. bioRxiv. 2024. PMID: 39372786 Free PMC article. Preprint.
-
Gene expression profiling of adult female tissues in feeding Rhipicephalus microplus cattle ticks.Int J Parasitol. 2013 Jun;43(7):541-54. doi: 10.1016/j.ijpara.2013.01.009. Epub 2013 Mar 13. Int J Parasitol. 2013. PMID: 23500075
-
Exploring the midgut proteome of partially fed female cattle tick (Rhipicephalus (Boophilus) microplus).J Insect Physiol. 2010 Feb;56(2):212-26. doi: 10.1016/j.jinsphys.2009.10.003. Epub 2009 Oct 28. J Insect Physiol. 2010. PMID: 19840806
-
A longitudinal transcriptomic analysis from unfed to post-engorgement midguts of adult female Ixodes scapularis.Sci Rep. 2023 Jul 13;13(1):11360. doi: 10.1038/s41598-023-38207-5. Sci Rep. 2023. PMID: 37443274 Free PMC article. Review.
-
Cattle Tick Rhipicephalus microplus-Host Interface: A Review of Resistant and Susceptible Host Responses.Front Cell Infect Microbiol. 2017 Dec 11;7:506. doi: 10.3389/fcimb.2017.00506. eCollection 2017. Front Cell Infect Microbiol. 2017. PMID: 29322033 Free PMC article. Review.
Cited by
-
Biochemical analysis of Hyalomma dromedarii salivary glands and gut tissues using SR-FTIR micro-spectroscopy.Sci Rep. 2024 Apr 12;14(1):8515. doi: 10.1038/s41598-024-59165-6. Sci Rep. 2024. PMID: 38609442 Free PMC article.
-
Exploring midgut expression dynamics: longitudinal transcriptomic analysis of adult female Amblyomma americanum midgut and comparative insights with other hard tick species.bioRxiv [Preprint]. 2024 Sep 24:2024.09.20.614175. doi: 10.1101/2024.09.20.614175. bioRxiv. 2024. PMID: 39372786 Free PMC article. Preprint.
-
Exploring the longitudinal expression dynamics of midguts in adult female Amblyomma americanum ticks.BMC Genomics. 2024 Oct 24;25(1):996. doi: 10.1186/s12864-024-10905-y. BMC Genomics. 2024. PMID: 39448894 Free PMC article.
-
A fluorescently-tagged tick kinin neuropeptide triggers peristalsis and labels tick midgut muscles.Sci Rep. 2024 May 13;14(1):10863. doi: 10.1038/s41598-024-61570-w. Sci Rep. 2024. PMID: 38740831 Free PMC article.
-
In Situ Localization of Staphylococcus shinii and Staphylococcus succinus in Infected Rhipicephalus microplus Ticks: Implications for Biocontrol Strategies.Pathogens. 2024 Nov 21;13(12):1025. doi: 10.3390/pathogens13121025. Pathogens. 2024. PMID: 39770285 Free PMC article.
References
-
- Agyei AD, Runham NW, 1995. Studies on the morphological changes in the midguts of two ixodid tick species Boophilus microplus and Rhipicephalus appendiculatus during digestion of the blood meal. Int. J. Parasitol. 25, 55–62. - PubMed
-
- Agyei AD, Herbert IV, Runham NW, 1991. Histochemical localisation of acid phosphatase and non-specific esterase in the midguts of two species of tick, Boophilus microplus and Rhipicephalus appendiculatus, as determined by light microscopy. Parasitol. Res. 77, 629–634. - PubMed
-
- Andreotti R, 2006. Performance of two Bm86 antigen vaccin formulation against tick using crossbreed bovines in stall test. Rev. Bras. Parasitol. Vet. 15, 97–100. - PubMed
-
- Barillasmury CV, Noriega FG, Wells MA, 1995. Early trypsin activity is part of the signal-transduction system that activates transcription of the late trypsin gene in the midgut of the mosquito. Aedes-Aegypti. Insect. Biochem. Mol. 25, 241–246. - PubMed
MeSH terms
Grants and funding
LinkOut - more resources
Full Text Sources
