. 2024 Feb 1;84(3):506-521.e11.
doi: 10.1016/j.molcel.2023.12.011. Epub 2023 Dec 29.

Recruitment of trimeric eIF2 by phosphatase non-catalytic subunit PPP1R15B

Affiliations

Recruitment of trimeric eIF2 by phosphatase non-catalytic subunit PPP1R15B

Agnieszka Fatalska et al. Mol Cell. .

Abstract

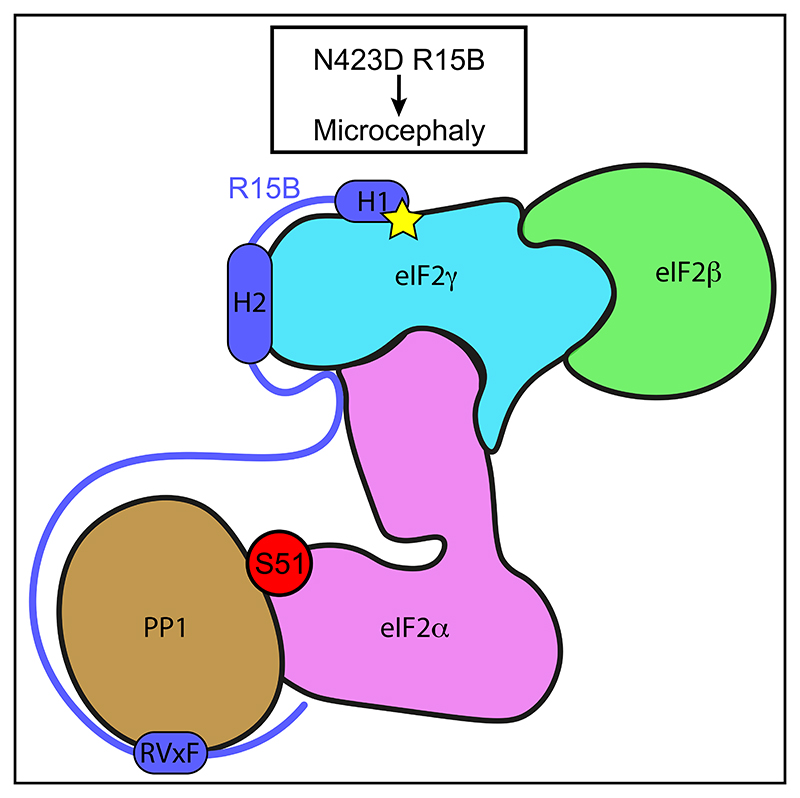
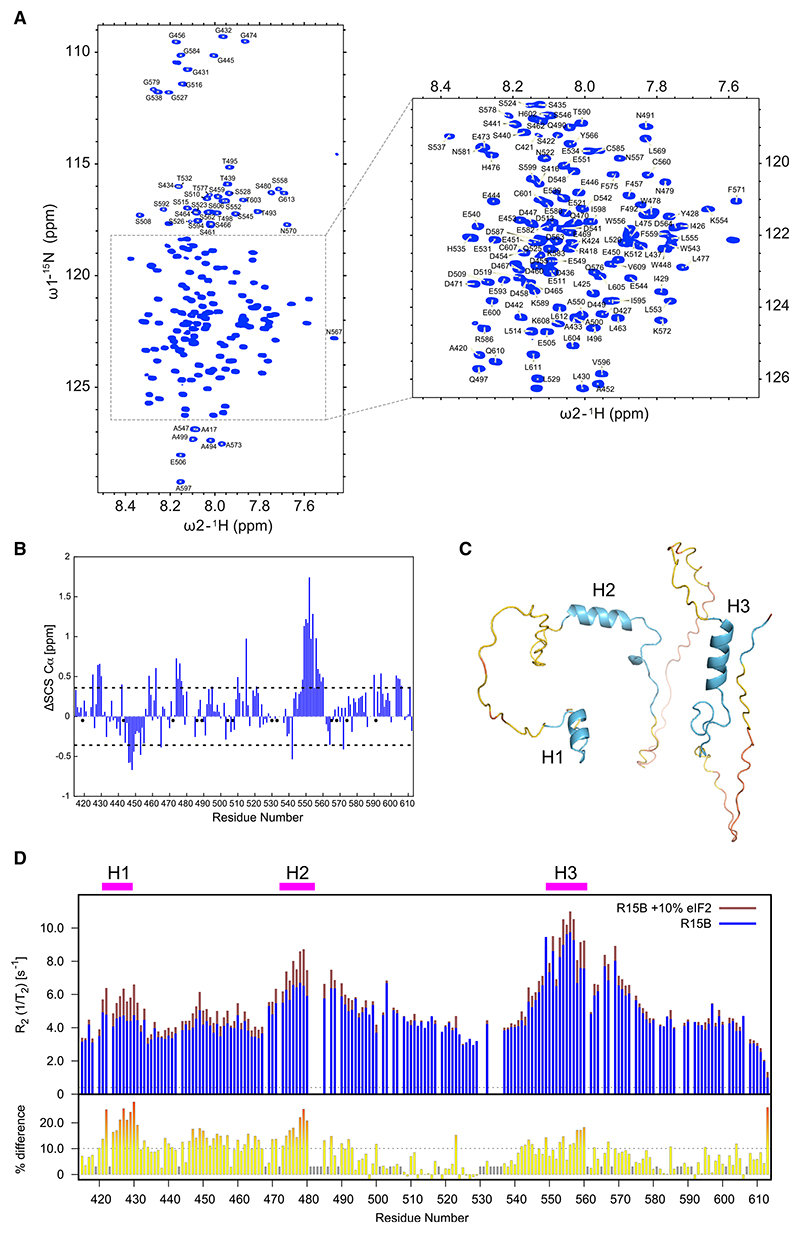
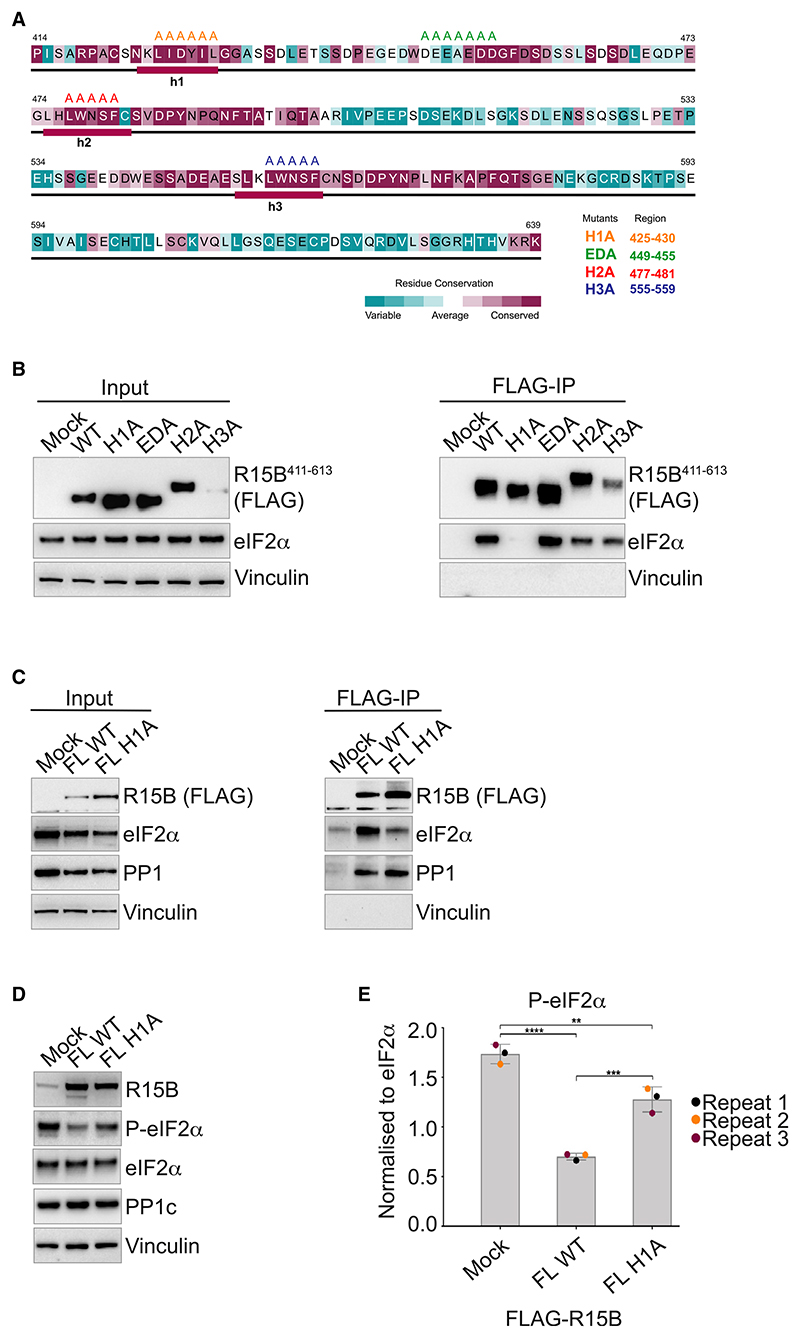
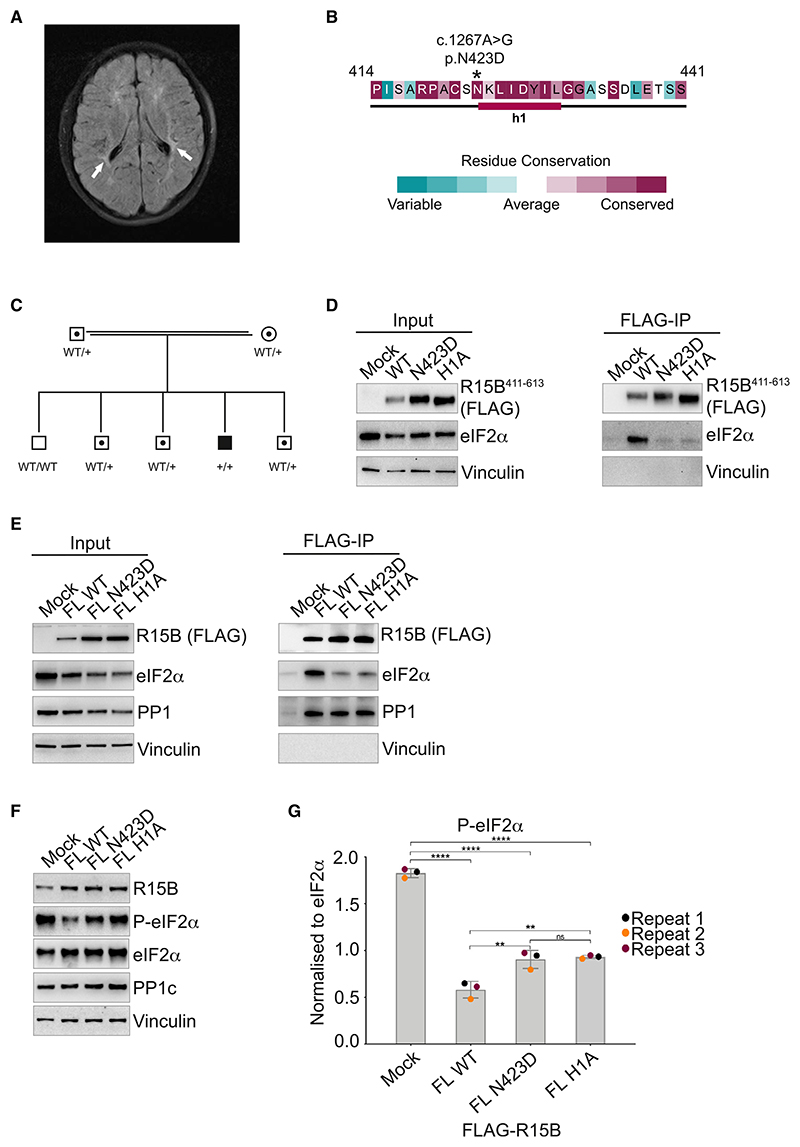
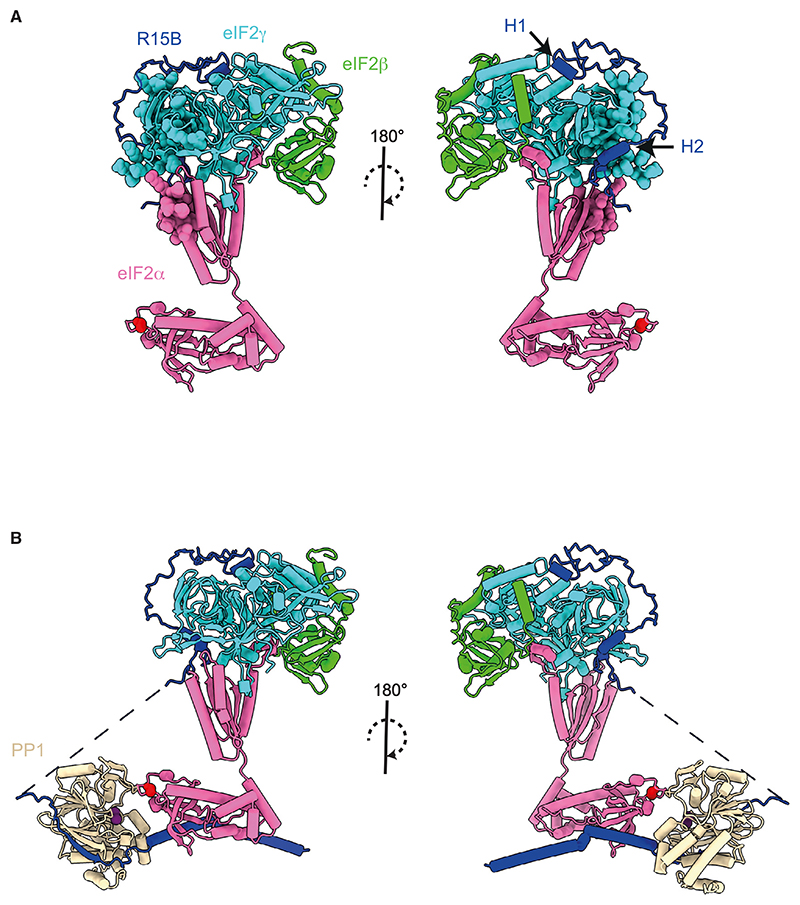
Regulated protein phosphorylation controls most cellular processes. The protein phosphatase PP1 is the catalytic subunit of many holoenzymes that dephosphorylate serine/threonine residues. How these enzymes recruit their substrates is largely unknown. Here, we integrated diverse approaches to elucidate how the PP1 non-catalytic subunit PPP1R15B (R15B) captures its full trimeric eIF2 substrate. We found that the substrate-recruitment module of R15B is largely disordered with three short helical elements, H1, H2, and H3. H1 and H2 form a clamp that grasps the substrate in a region remote from the phosphorylated residue. A homozygous N423D variant, adjacent to H1, reducing substrate binding and dephosphorylation was discovered in a rare syndrome with microcephaly, developmental delay, and intellectual disability. These findings explain how R15B captures its 125 kDa substrate by binding the far end of the complex relative to the phosphosite to present it for dephosphorylation by PP1, a paradigm of broad relevance.

Keywords: PP1; PPP1R15B; intrinsically disordered proteins; mass spectrometry; missense variants; nuclear magnetic resonance spectroscopy; phosphatase; structural proteomics; syndrome.


Conflict of interest statement

Declaration of interests The authors declare no competing interests.

Figures

Graphical abstract
Graphical abstract
Figure 1
Figure 1. Reconstitution of a R15B-eIF2 complex with recombinant proteins
(A) Cartoon illustrating the regions of R15B binding to eIF2 and PP1. (B) FLAG-R15B constructs were transfected into HEK293T cells (input) and immunoprecipitated using anti-FLAG M2 magnetic beads (FLAG-IP). Samples were eluted from the beads by boiling in LDS buffer and eluates were separated on a 4%–12% Bis-Tris Plus gel. Proteins were detected by immunoblotting with FLAG (black arrows), eIF2α, PP1, and vinculin antibodies. Representative results of at least 3 experiments are shown. (C) Coomassie-stained gel of purified R15B fragments. Molecular weight markers are indicated in kilodaltons (kDa). (D) FLAG immunoprecipitations from yeast lysates with overexpressed human eIF2, harboring a FLAG on eIF2α, with or without the indicated recombinantly expressed and purified R15B protein revealed by immunoblotting. (E) Coomassie-stained gel of purified human eIF2 (α, β, and γ) and R15B414–613. (F) Size exclusion chromatography (SEC) of R15B414–613, trimeric human eIF2 complex, and both combined. Bottom panel: SDS-PAGE of the SEC fractions. (G) Fluorescent anisotropy measurements with 20 nM NT-495-labeled R15B414–613 and titration of eIF2. Graph shows one representative replicate. Kd calculated from three replicates is 5.8 ± 0.94 nM standard error of mean.
Figure 2
Figure 2. R15B binds to eIF2 in regions distant from the phosphorylation site
(A–C) Woods plots showing differences in deuterium uptake for eIF2 alone or in the presence of R15B414–613. Deprotected, protected, and non-significantly different peptides are in red, blue, and gray, respectively, plotted as Δ fraction exchanged (y-axis). Bar length corresponds to peptide length plotted against the sequence position (x-axis). Dashed and dotted lines indicate 98% and 99% confidence intervals applied to identify peptides with statistically significant deuteration differences. Regions with significant differences (see STAR Methods) are highlighted in blue (increased protection) and red (decreased protection) rectangles. Representative time points are shown. (A) eIF2α, 5 min, (B) eIF2β, 3 s, and (C) eIF2γ, 3 s. Error bars denote combined uncertainty of peptide deuteration calculated based on triplicate experiments. (D) Mapping of the protected regions on an AlphaFold model of human eIF2 upon binding to R15B414–613. Protected residues are shown as spheres. No protection was observed on eIF2β, which is only partly resolved. The phosphorylation site, S51, is shown in red.
Figure 3
Figure 3. R15B binds eIF2 via discrete regions
(A–D) Woods plots showing the difference indeuteration for a given R15B peptide at a given time point (A, 3 s; B, 30 s; C, 1 min; and D, 5 min) against the sequence position following addition of eIF2 complex. Deprotected, protected, and non-significantly different peptides are in red, blue, and gray, respectively, plotted as Δ fraction exchanged between the two states (y-axis). Bar length corresponds to peptide length plotted against the amino acid sequence (x-axis). Dashed and dotted lines indicate 98% and 99% confidence intervals applied to identify peptides with statistically significant deuteration differences. Regions with greatest differences are highlighted in blue. Error bars denote combined uncertainty of peptide deuteration calculated based on triplicate experiments. (E) Cartoon representation of the three short regions of R15B414–613 protected from deuteration upon binding to eIF2. Green depicts the substrate-recruitment module of R15B identified in Figure 1, and blue depicts the regions most protected upon binding to eIF2.
Figure 4
Figure 4. NMR reveals discrete helical elements of R15B that bind eIF2
(A) 1H,15N 2D HSQC of R15B414–613 with assignment of backbone amide resonances. The inset shows an expanded view of the central region. The narrow dispersion of 1H chemical shifts is a hallmark of intrinsically disordered proteins. (B) Secondary structure propensities of R15B414–613 characterized by the deviations of observed Cα chemical shifts from estimated random coil values (ΔSCS Cα). Negative values suggest a propensity for extended conformation, whereas positive deviations suggest increased likelihood of α-helical structure. Only consecutive stretches of residues with ΔSCS Cα values above or below 1 standard deviation are considered. (C) AlphaFold2 model of R15B414–613. The residue positions of predicted helices are 424–429 (H1), 472–482 (H2), and 549–560 (H3). The model is colored based on the predicted local distance difference tests (pLDDTs). Blue color in the model corresponds to a confident score (90 > pLDDT > 70), yellow to a low confidence score (70 > pLDDT > 50), and orange to a very low confidence score (pLDDT < 50). (D) Top panel: superposition of transverse relaxation R2 rates of R15B414–613 alone and in the presence of 10% eIF2. Bottom panel: observed transverse relaxation R2 rate differences. Significant changes above 1 standard deviation are highlighted in red.
Figure 5
Figure 5. Identification of a mutant of R15B defective in substrate binding
(A) Sequence conservation of R15B414–639. The residues are colored according to ConSurf conservation scores from cyan (variable) to burgundy (conserved). The consensus secondary structure, predicted using Jpred and PsiPred, is shown below the corresponding sequence. The secondary structural elements are denoted as follows: rectangle, helix; line, random coil. The substitutions of the residues targeted for mutagenesis are shown on the top with different mutants shown in different colors. (B and C) R15B411–613 (B) or full-length (C) wild-type (WT) or mutants were transfected into HEK 293T cells (input) and immunoprecipitated using anti-FLAG M2 magnetic beads (FLAG-IP). Immunoprecipitated complexes were eluted and analyzed on a 4%–12% bis Tris Plus gel. Proteins were detected by immunoblotting with FLAG, eIF2α, PP1, and vinculin antibodies. Representative results of at least 3 experiments are shown. (D) Activity of transfected R15B full-length WT or H1A assessed by decreased levels of P-eIF2α. Proteins were detected by immunoblotting with R15B (R15B-4D11), P-eIF2α, eIF2α, PP1, and vinculin antibodies. Representative results of at least 3 experiments are shown. (E) Quantifications of P-eIF2α from 3 experiments such as the one shown in (D). Data are mean ± SD. (n = 3). **p < 0.01, ***p < 0.001, ****p < 0.0001, as determined by one-way ANOVA.
Figure 6
Figure 6. A homozygous missense variant in the substrate recognition module of R15B causes microcephaly, developmental delay, and intellectual disability
(A) Magnetic resonance imaging (fluid-attenuated inversion recovery [FLAIR] sequence) of the brain of the R15BN423D boy showing periventricular white matter hyperintensities (white arrows). (B) A homozygous variant c.1267A>G in PPP1R15B translates in a N423D missense in R15B’s substrate recognition module in a boy with microcephaly. (C) Pedigree of the family with the c.1267A>G in PPP1R15B. Circles refer to females, squares refer to males. An enclosed dot represents heterozygosity and a solid fill represents homozygosity for the c.1267 A>G PPP1R15B variant. Wild type (WT); +: variant c.1267 A>G allele. (D) R15B411–613 (E) or R15B full-length (FL) wild-type (WT), N423D or H1A mutants were transfected into HEK293T cells (input) and immunoprecipitated using anti-FLAG M2 magnetic beads (FLAG-IP). Immunoprecipitated complexes were eluted and analyzed on a 4%–12% bis Tris Plus gel. Proteins were detected by immunoblotting with FLAG, eIF2α, PP1, and vinculin antibodies. Representative results of at least 3 experiments are shown. (F) Activity of transfected R15B FL WT, R15B FL N423D, and R15B FL H1A assessed by decreased levels of P-eIF2α. Proteins were detected by immunoblotting with R15B (R15B-4D11 in house), P-eIF2α, eIF2α, PP1, and vinculin antibodies. Representative results of at least 3 experiments are shown. (G) Quantifications of P-eIF2α from 3 experiments such as the one shown in (E). Data are mean ± SD. (n = 3). **p < 0.01, ****p < 0.0001, ns, not significant, as determined by one-way ANOVA.
Figure 7
Figure 7. Model of recruitment of trimeric eIF2 by R15B
(A) AlphaFold2 model of eIF2-R15B complex generated using the sequences of eIF2α and eIF2γ full-length, eIF2β167–333 and R15B414–500 as input. R15B501–613 and N and C termini of eIF2β were excluded from the model because of pLDDT scores <50. Residues on eIF2 that show significant change in deuterium uptake upon binding to R15B are shown as spheres. The phosphorylation site, S51 of eIF2α, is shown as a red sphere. (B) Composite model of (A) and an AlphaFold2 model of PP1-R15B637–713 with the N terminus of eIF2α. The sequence N-terminal to the R15B636–713 is shown with a dashed line. Metal ions (purple) were added to PP1 active site by using PDB: 3E7A as a template.

References

    1. Cohen P. The origins of protein phosphorylation. Nat Cell Biol. 2002;4:E127–E130. - PubMed
    1. Humphrey SJ, James DE, Mann M. Protein phosphorylation: A major switch mechanism for metabolic regulation. Trends Endocrinol Metab. 2015;26:676–687. - PubMed
    1. Chen MJ, Dixon JE, Manning G. Genomics and evolution of protein phosphatases. Sci Signal. 2017;10:eaag1796. - PubMed
    1. Shi Y. Serine/threonine phosphatases: mechanism through structure. Cell. 2009;139:468–484. - PubMed
    1. Brautigan DL. Protein Ser/Thr phosphatases - the ugly ducklings of cell signalling. FEBS Journal. 2013;280:324–345. - PubMed

Substances