. 2024 Jan 22;59(2):175-186.e8.
doi: 10.1016/j.devcel.2023.12.003. Epub 2023 Dec 29.

Spatiotemporal modulation of growth factors directs the generation of multilineage mouse embryonic stem cell-derived mammary organoids

Affiliations

Spatiotemporal modulation of growth factors directs the generation of multilineage mouse embryonic stem cell-derived mammary organoids

Sounak Sahu et al. Dev Cell. .

Abstract

Ectodermal appendages, such as the mammary gland (MG), are thought to have evolved from hair-associated apocrine glands to serve the function of milk secretion. Through the directed differentiation of mouse embryonic stem cells (mESCs), here, we report the generation of multilineage ESC-derived mammary organoids (MEMOs). We adapted the skin organoid model, inducing the dermal mesenchyme to transform into mammary-specific mesenchyme via the sequential activation of Bone Morphogenetic Protein 4 (BMP4) and Parathyroid Hormone-related Protein (PTHrP) and inhibition of hedgehog (HH) signaling. Using single-cell RNA sequencing, we identified gene expression profiles that demonstrate the presence of mammary-specific epithelial cells, fibroblasts, and adipocytes. MEMOs undergo ductal morphogenesis in Matrigel and can reconstitute the MG in vivo. Further, we demonstrate that the loss of function in placode regulators LEF1 and TBX3 in mESCs results in impaired skin and MEMO generation. In summary, our MEMO model is a robust tool for studying the development of ectodermal appendages, and it provides a foundation for regenerative medicine and disease modeling.

Keywords: ectodermal appendages; embryonic stem cell; mammary gland; organoid; single-cell transcriptomics.


Conflict of interest statement

Declaration of interests The authors declare no competing interests.

Figures

Figure 1:
Figure 1:. Self-organization of pluripotent stem cells to generate multilineage ESC-derived mammary organoids (MEMO).
(a) An overview on the development of different ectodermal appendages by the interaction of non-neural/surface ectoderm (SE) and the underlying mesenchyme (MES). (b) Schematic overview of the 30-day differentiation protocol to generate mammary lineage from ESC aggregates by modulating TGF-β/FGF/BMP/WNT/PTHrP/HH signaling (SB= TGF-β inhibitor, LDN-19389 = BMP4 inhibitor, PTHrP = Parathyroid hormone related protein, SANT-1 = Sonic Hedgehog (HH) inhibitor). (c) Representative images show the formation of neural ectoderm and non-neural ectoderm. Combinatorial treatment of BMP4 and SB leads to the formation of E-Cadherin+ epithelial layer expressing Transcription Factor AP2 α (TFAP2α). (d) The TFAP2α + SE express pre-placodal epithelial marker SIX1 when BMP4/SB treated cell aggregates were incubated in the presence of FGF2 and LDN (scale bar = 50 μm). (e) The pre-placodal epithelium under the action of WNT and FGF signaling growth factors gets modified to form placode-like structures at day 12 expressing LEF1, Ectodysplasin-A receptor (EDAR) and TBX3. (scale bar = 50 μm) (f) The placode structures commit to mammary lineage under the action of BMP4, PTHrP and SANT-1. In addition, maturation of these organoids in Epicult-B media from day 20-30 leads to the formation of mammary luminal epithelial cells (K8/18+), basal epithelium (K5+), distinct chondrocytes, adipocytes, and fibroblasts. (scale bar = 250 μm). Magnified image showing K5 and K8/18 mammary structures (scale bar = 50 μm) (See also Figure S1 and S6)
Figure 2:
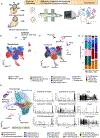
Figure 2:. Single cell transcriptomics identify dichotomy between mammary and skin lineage
(a) Schematic overview on scRNA-Sequencing on dissociated cells from 30-day old skin organoid and MEMO. (b) Uniform Manifold Approximation Projection (UMAP) plot showing integrated dataset of skin and MEMO. (n = 18831 cells from skin organoids and 20579 cells from MEMO pooled from two biological replicates). (c) UMAP showing the distribution of cell types in the integrated dataset. The cluster numbers are denoted in parenthesis and are color-coded according to the UMAP. (d) Barplot showing the proportion of cells present in individual clusters between the two replicates of MEMO and the skin scRNA-Seq datasets. (e) UMAP showing the presence of mammary mesenchyme, epithelial cells, and associated appendages. Violin plots showing the expression of cytokeratins and transcription factors that are known to be expressed in the mammary mesenchyme and in the epithelial cells. (See also Figure S2 and S3)
Figure 3:
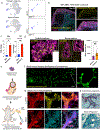
Figure 3:. Hormone responsive cells and xenografts demonstrate functionality of MEMO
(a) UMAP plots from MEMO scRNA-Seq show estrogen response genes in epithelial cells with apical junction hallmarks. A magnified view shows estrogen-related marker expression. (b) Immunostaining demonstrates the presence of progesterone receptor (PR) in MEMO cultured in the presence of WNT, BMP4, PTHrP and SANT-1. (scale bar = 100 μm) (c) Fold change in gene expression of estrogen receptor (Era) and Progesterone receptor (PR) in skin organoids versus MEMO at day 30. Data represented as mean ± SD. Each dot represents the fold change per experiment (n=2 biological replicate and each containing three technical replicates). p values are computed from unpaired, t-test. (d) Immunostaining using anti-milk proteins demonstrated mouse milk-specific proteins in lactogenic hormone-stimulated MEMO. Magnified image depicting milk secretion into the lumen. Milk proteins are not expressed in organoids cultured without lactogenic hormones expression (scale bar = 50 μm). Quantification showing the intensity of milk proteins across the K8/18+ luminal epithelial cells per organoids. Data represented as mean ± SD (n = 10-18 organoids per condition, Unpaired Students t-test, **p<0.001). (e) Schematic showing the transplantation of mT/mG expressing MEMO into 3 weeks-old athymic nude mice after endogenous mammary fat pad clearing. (f) Whole-gland microscopy showing endogenous membranous tdTomato expression (pseudocolored to green) from the reconstituted MG within the mammary fat pad (scale bar = 1mm). Magnified image showing branching of MG. (g) Immunostaining demonstrates the existence of K8/18+ luminal cells and K5+ basal mammary epithelial cells within tdTomato+ cells marked by dsRed antibody (scale bar = 50 μm). (h) Haematoxylin-Eosin staining showing the presence of epithelial structure with an inner lumen of the MG reconstituted after transplantation of mESC-derived MEMO into cleared mammary fat pads in mice (scale bar = 100 μm). (See also Figure S4)
Figure 4:
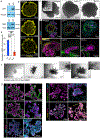
Figure 4:. Loss of LEF1 and TBX3 leads to disordered epithelial tissue organization and MEMO generation.
(a) Western blotting confirmation to generate a clonal population of Lef1−/− mESCs and Tbx3−/− mESCs. (b) Expression of TFAP2α+ surface ectoderm in wildtype, Lef1−/− and Tbx3−/− mESC derived organoid (scale bar = 100 μm). (c) Brightfield images of MEMO showing lack of mammary bud-like structures in Lef1−/− and Tbx3−/− as compared to wild type. (d) Percentage of mammary-bud-like structures were visually scored and quantified in wildtype, Lef1−/− and Tbx3−/− MEMO. Data represented as mean ± SEM. Each dot represents an independent experiment with >40 organoids per replicate (n =2 biological replicate), One-way ANOVA was used for statistical significance, **p<0.001, ***p<0.001 (e) Immunofluorescent imaging showing reduced development of basal K14 (yellow) and luminal K8/18+ (magenta) mammary epithelial cells in Lef1−/− and Tbx3−/− as compared to wild type MEMO. Nucleus is stained with DAPI (Cyan) (scale bar = 100 μm). (f) Brightfield images depicting the progression of mammary buds isolated from day 30 MEMOs following Matrigel embedding demonstrate the intricate process of branching morphogenesis over a time course of 60 days (scale bar = 1000 μm) (g) Immunofluorescent staining demonstrate the distribution of K8/18+ luminal cells (magenta) surrounded by K14+ and P63+ basal (yellow), and SMA+ (Cyan) myoepithelial cells. Mitotically active cells marked by H3P-Ser10 (yellow) were present at the tip of the branches and SOX9 (yellow) along the luminal cells (scale bar = 100 μm). (See also Figure S5).

Similar articles

Cited by

References

    1. Biggs LC, and Mikkola ML Early inductive events in ectodermal appendage morphogenesis. Seminars in cell & developmental biology 25–26, 11–21. 10.1016/j.semcdb.2014.01.007. - DOI - PubMed
    1. Widelitz RB, Veltmaat JM, Mayer JA, Foley J, and Chuong C-M (2007). Mammary glands and feathers: comparing two skin appendages which help define novel classes during vertebrate evolution. Seminars in cell & developmental biology 18, 255–266. 10.1016/j.semcdb.2007.02.005. - DOI - PMC - PubMed
    1. Oftedal OT (2002). evolutionary origin of mammary gland. Journal of Mammary Gland Biology and Neoplasia 7, 225–252. - PubMed
    1. Mikkola ML, and Millar SE (2006). The mammary bud as a skin appendage: unique and shared aspects of development. Journal of mammary gland biology and neoplasia 11, 187–203. 10.1007/s10911-006-9029-x. - DOI - PubMed
    1. Lee J, Büscke R, Tang PC, Hartman BH, Heller S, and Koehler KR (2018). Hair Follicle Development in Mouse Pluripotent Stem Cell-Derived Skin Organoids. Cell Reports 22, 242–254. 10.1016/j.celrep.2017.12.007. - DOI - PMC - PubMed

Publication types

Substances

LinkOut - more resources