. 2024 Jan 9;57(1):153-170.e6.
doi: 10.1016/j.immuni.2023.12.001. Epub 2023 Dec 29.

An exhausted-like microglial population accumulates in aged and APOE4 genotype Alzheimer's brains

Affiliations

An exhausted-like microglial population accumulates in aged and APOE4 genotype Alzheimer's brains

Alon Millet et al. Immunity. .

Abstract

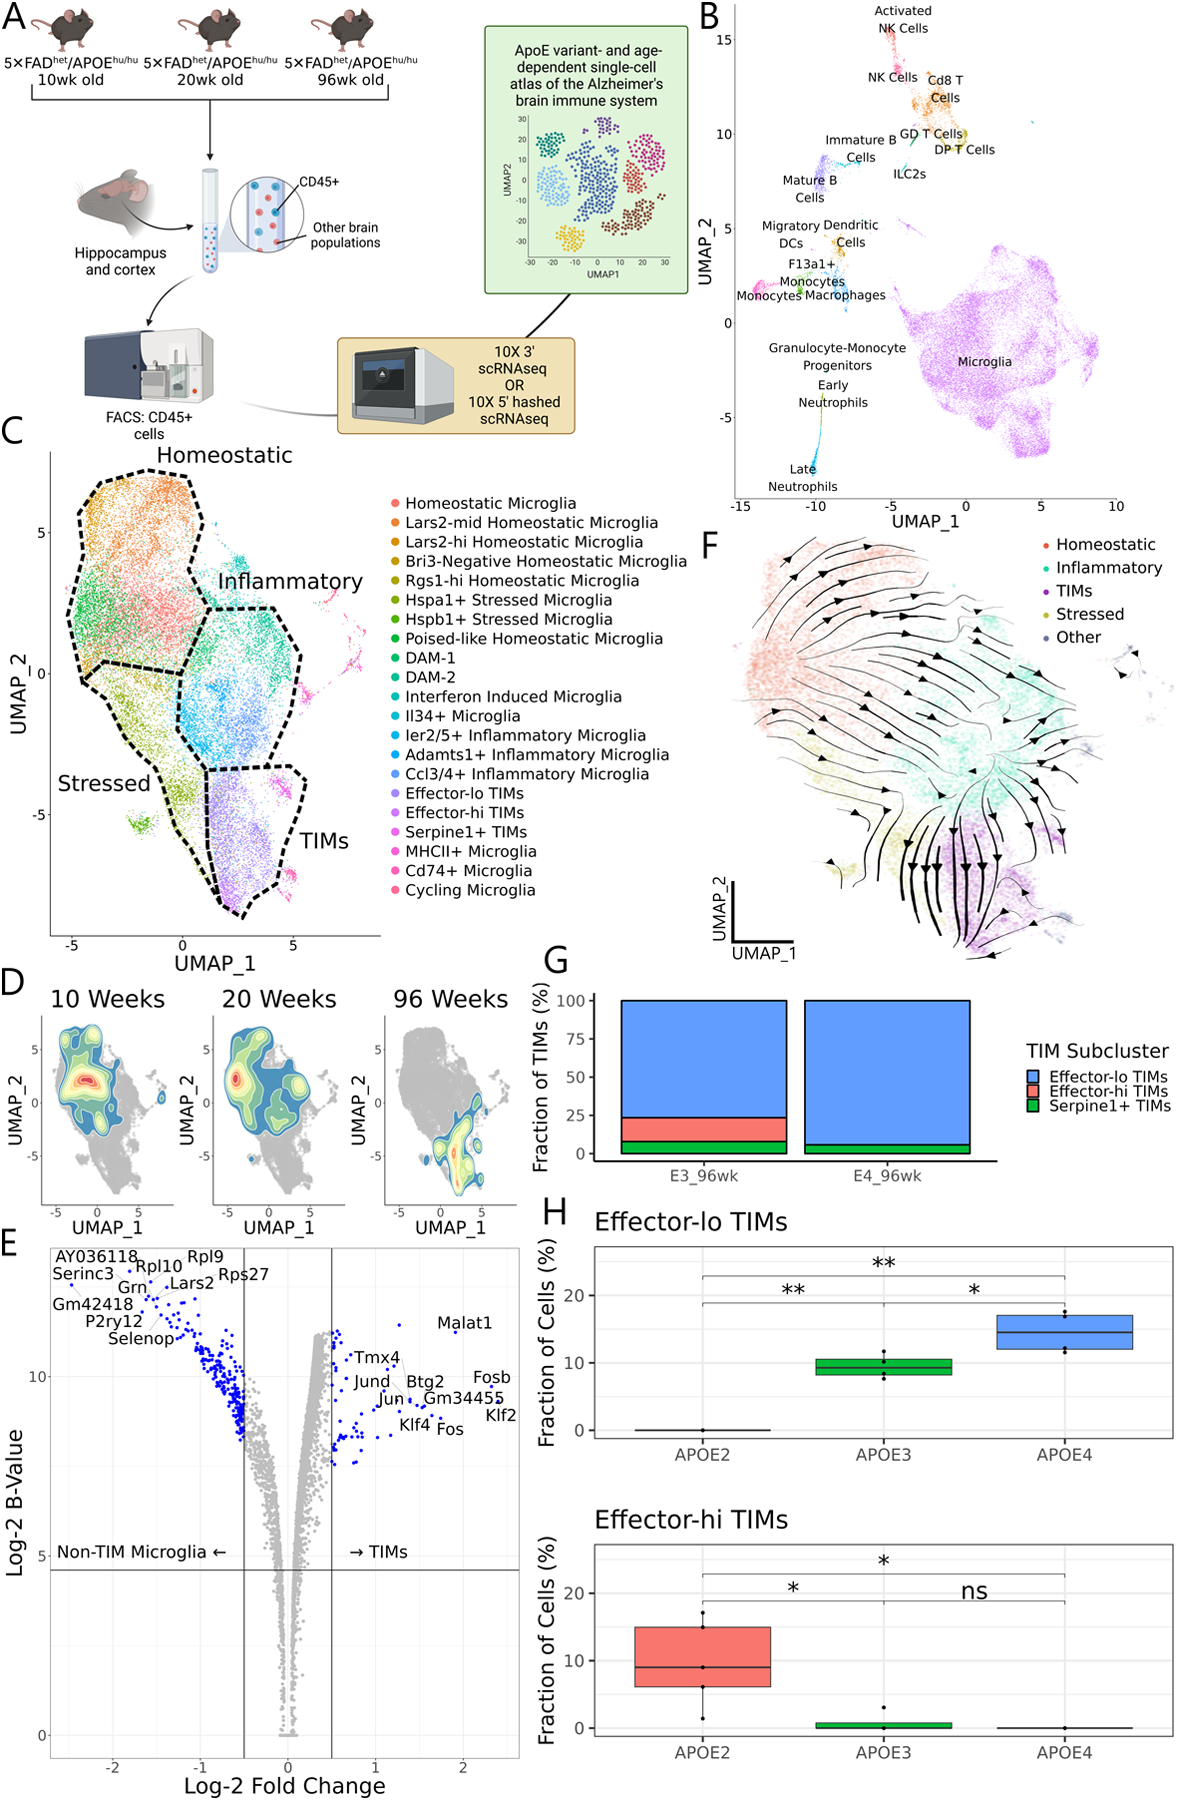
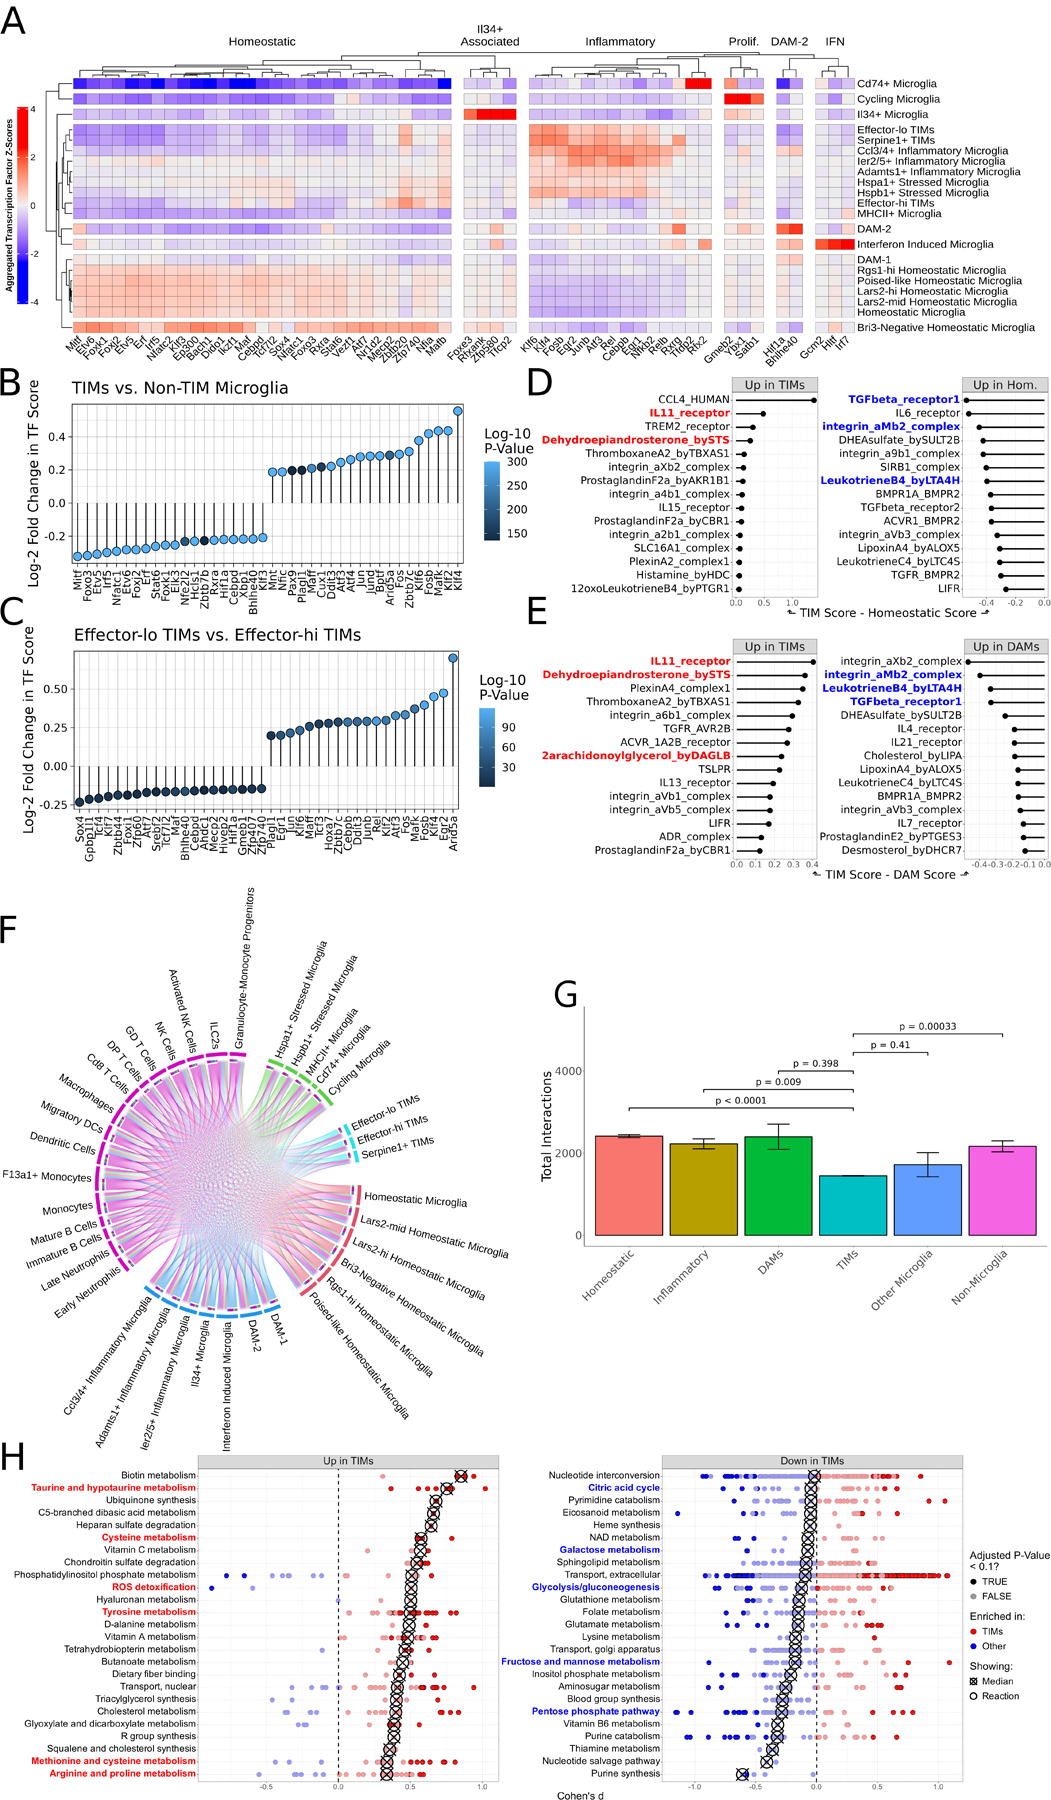
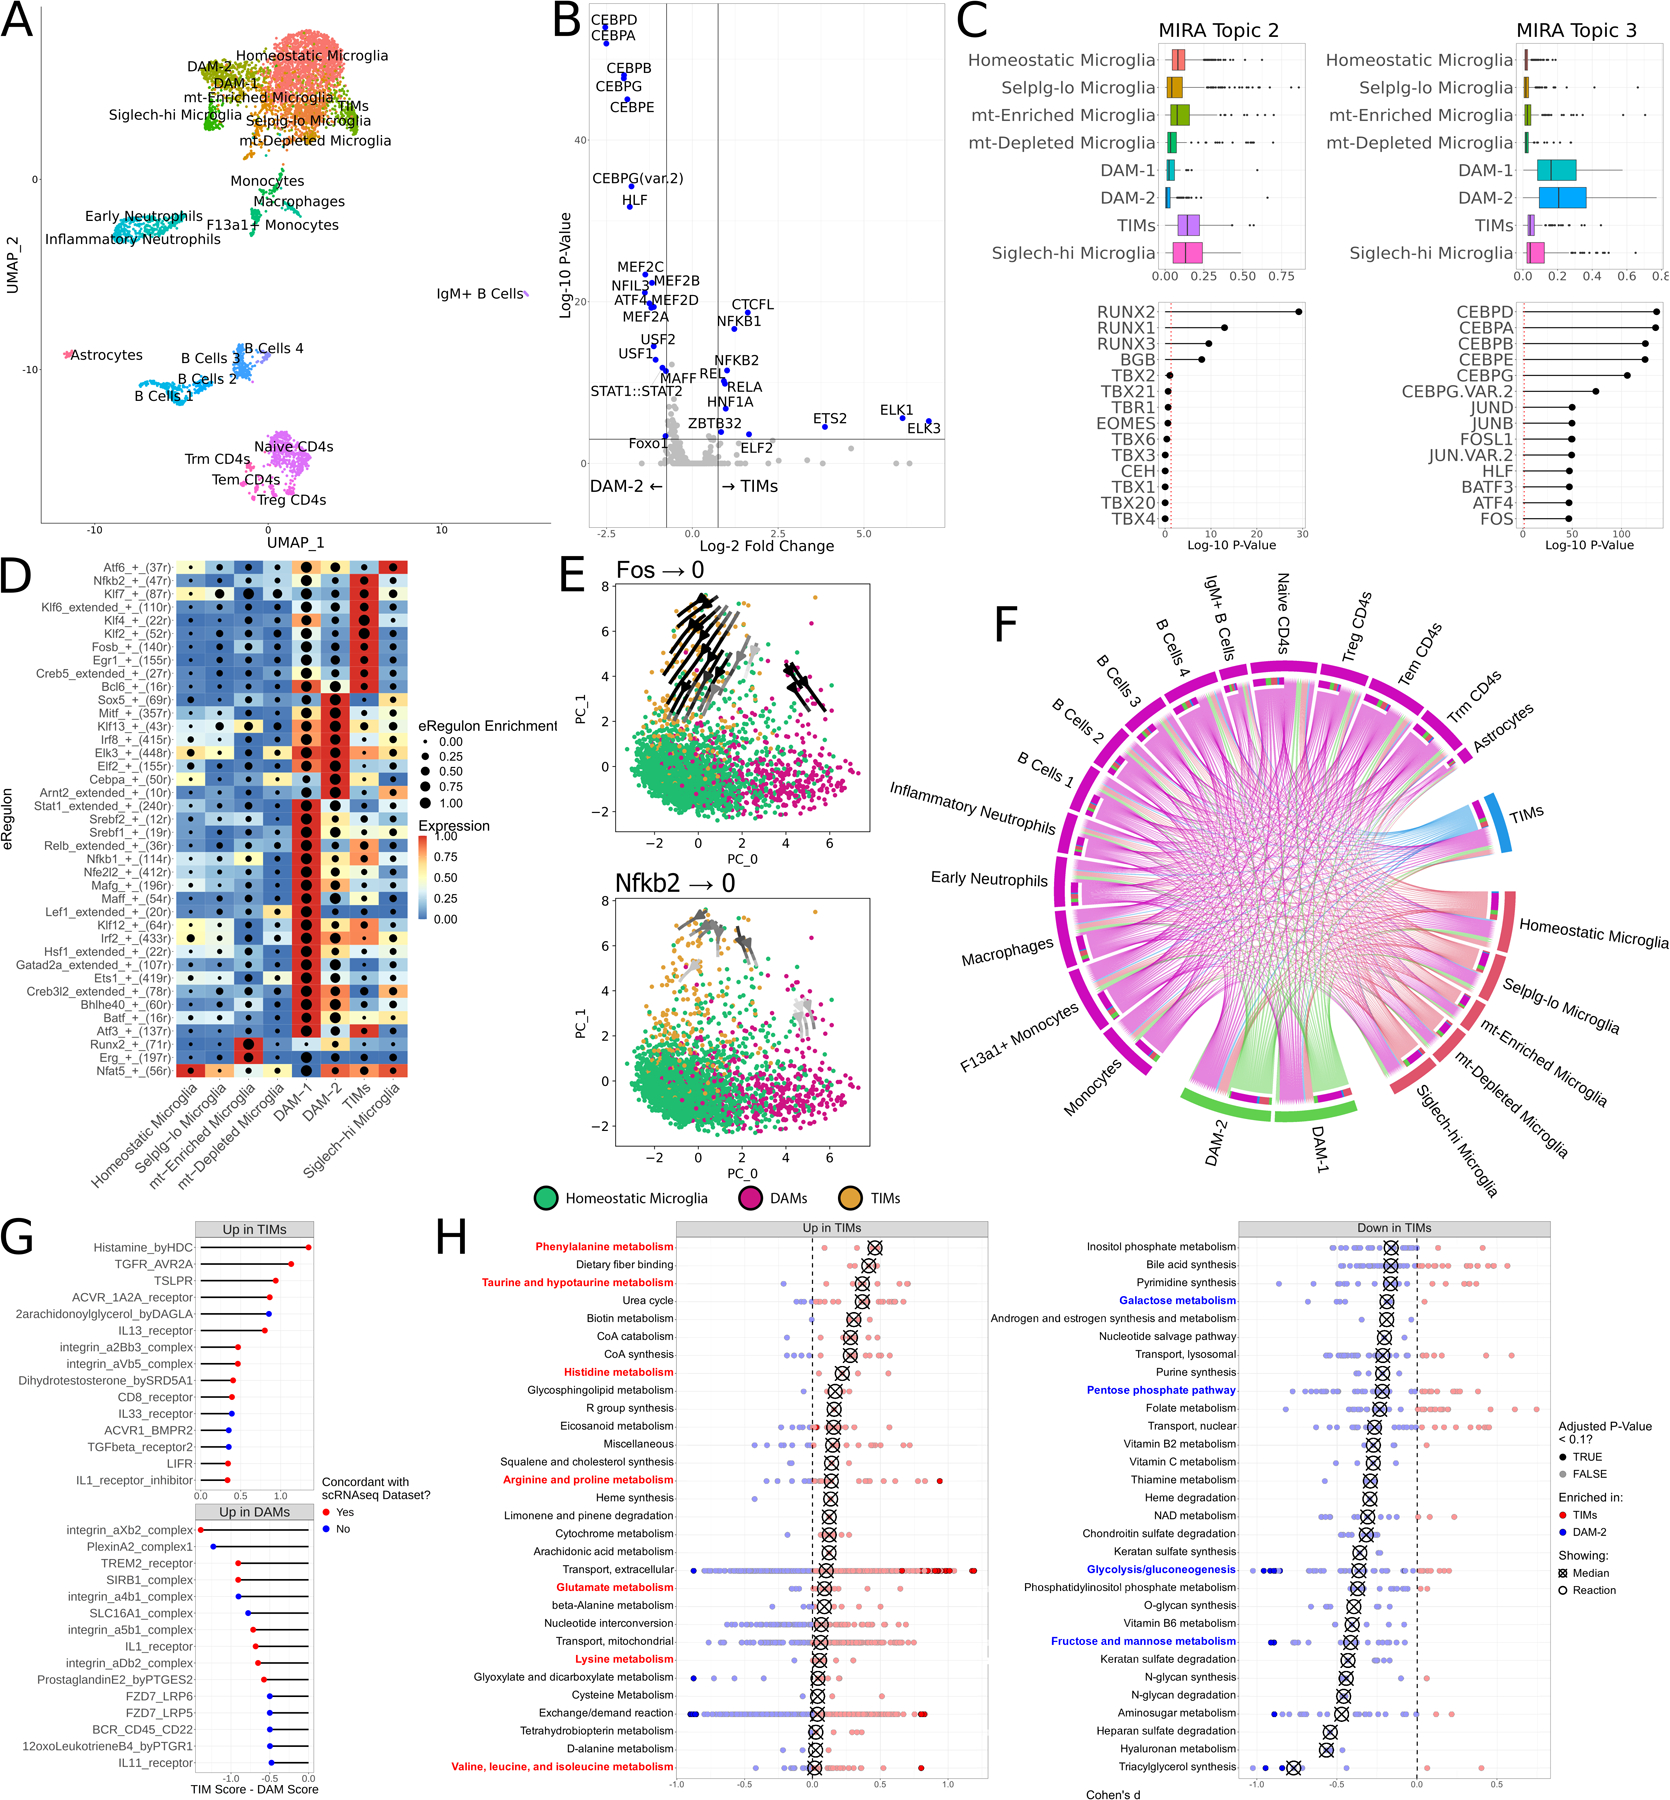
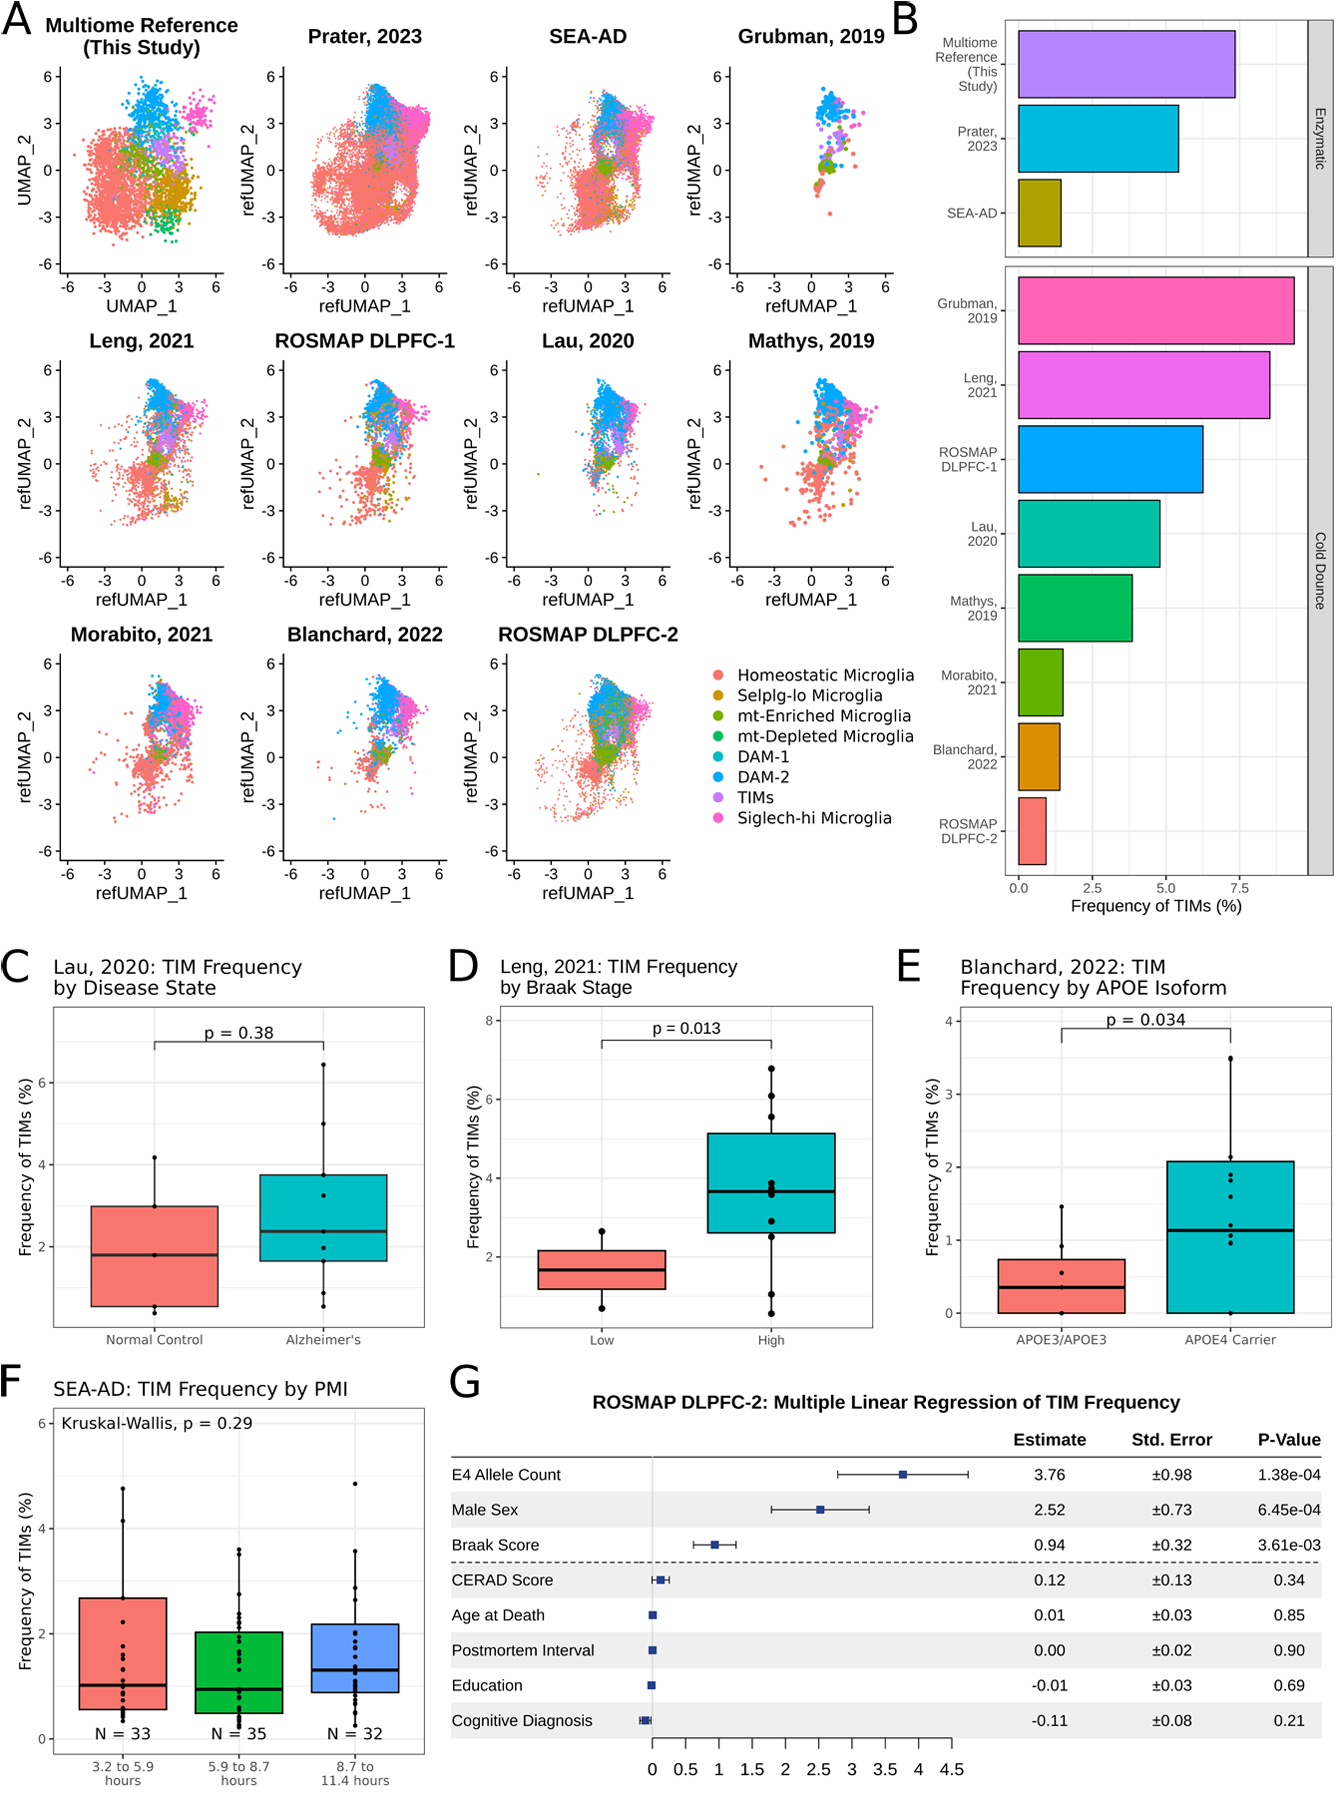
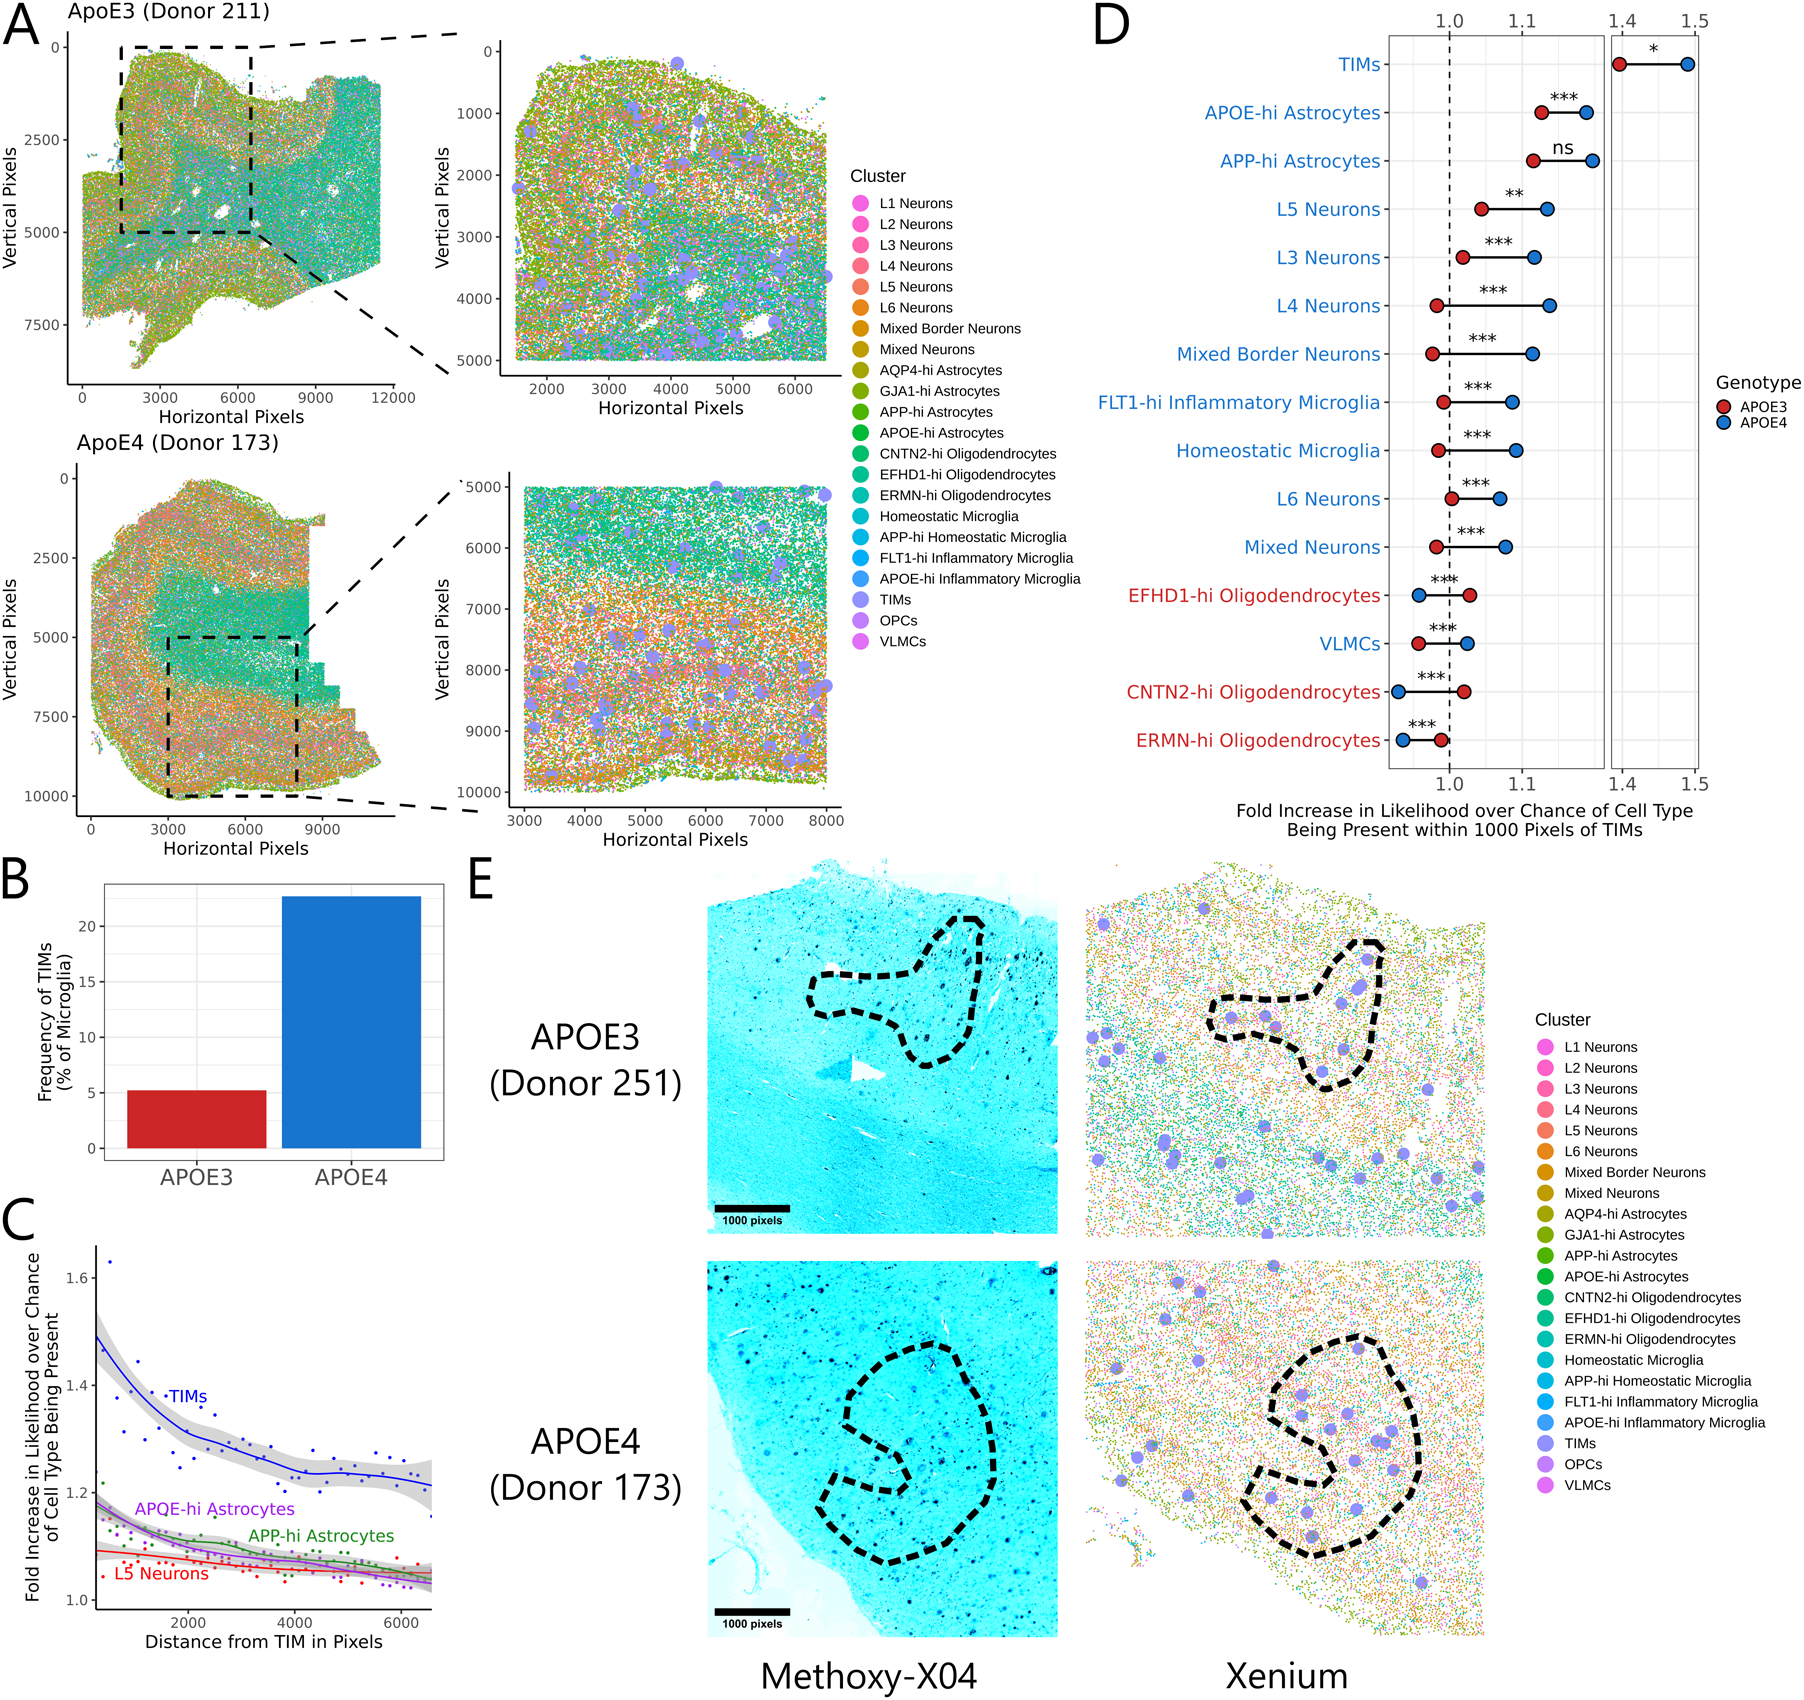
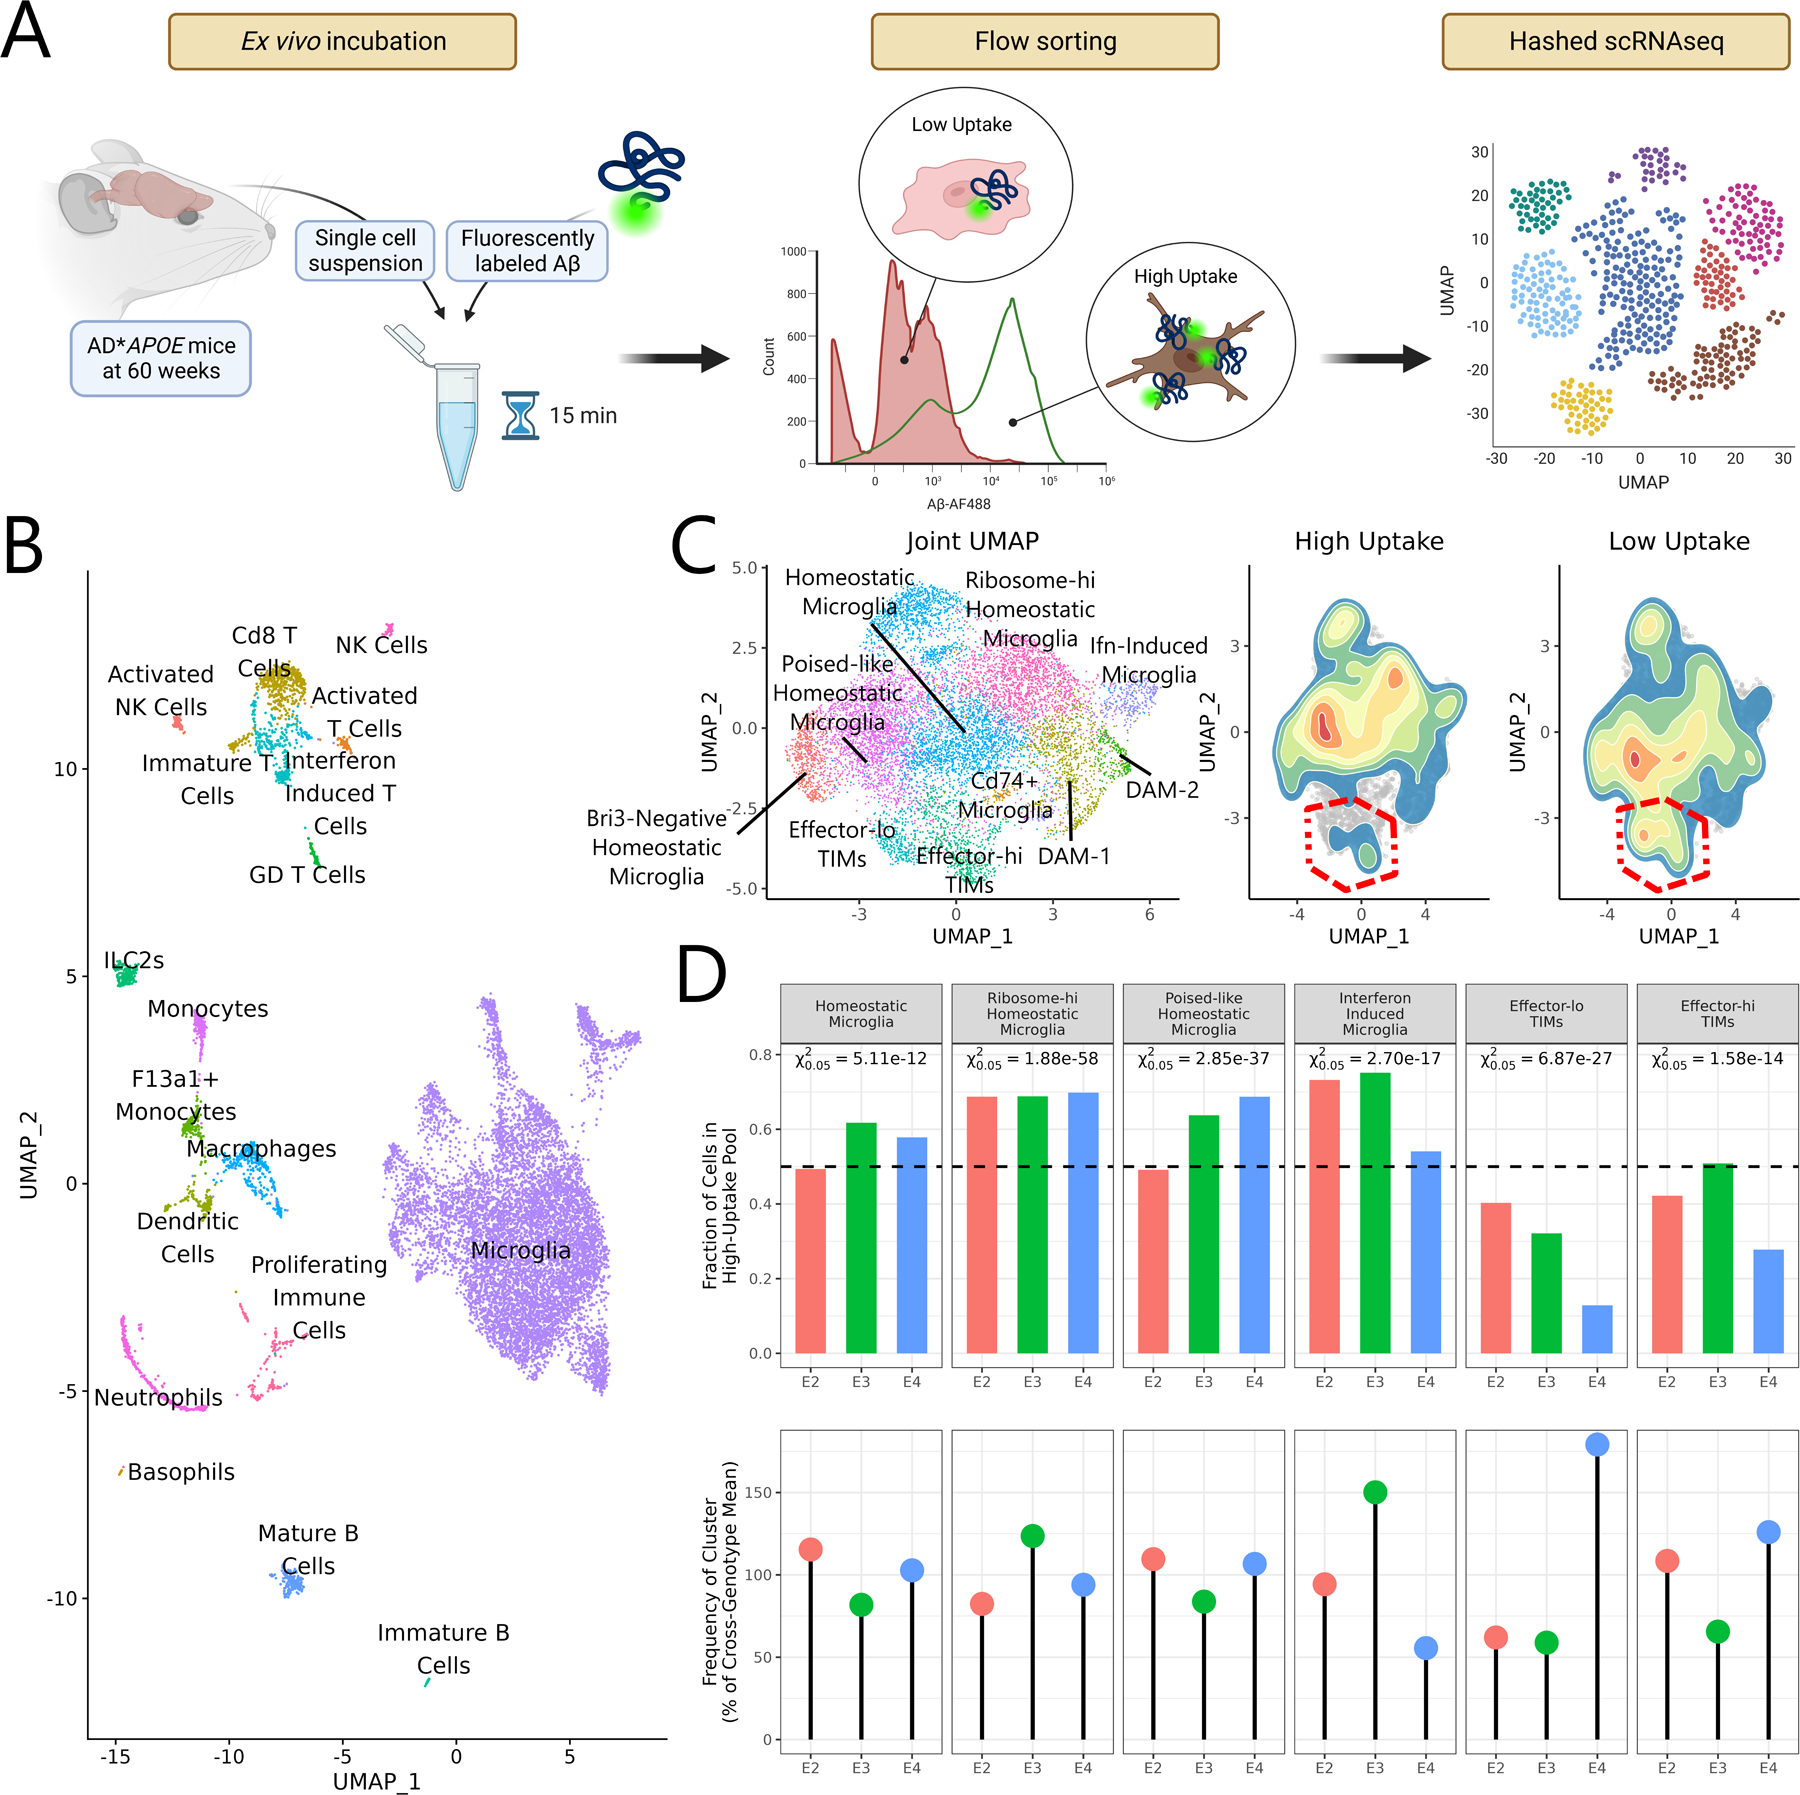
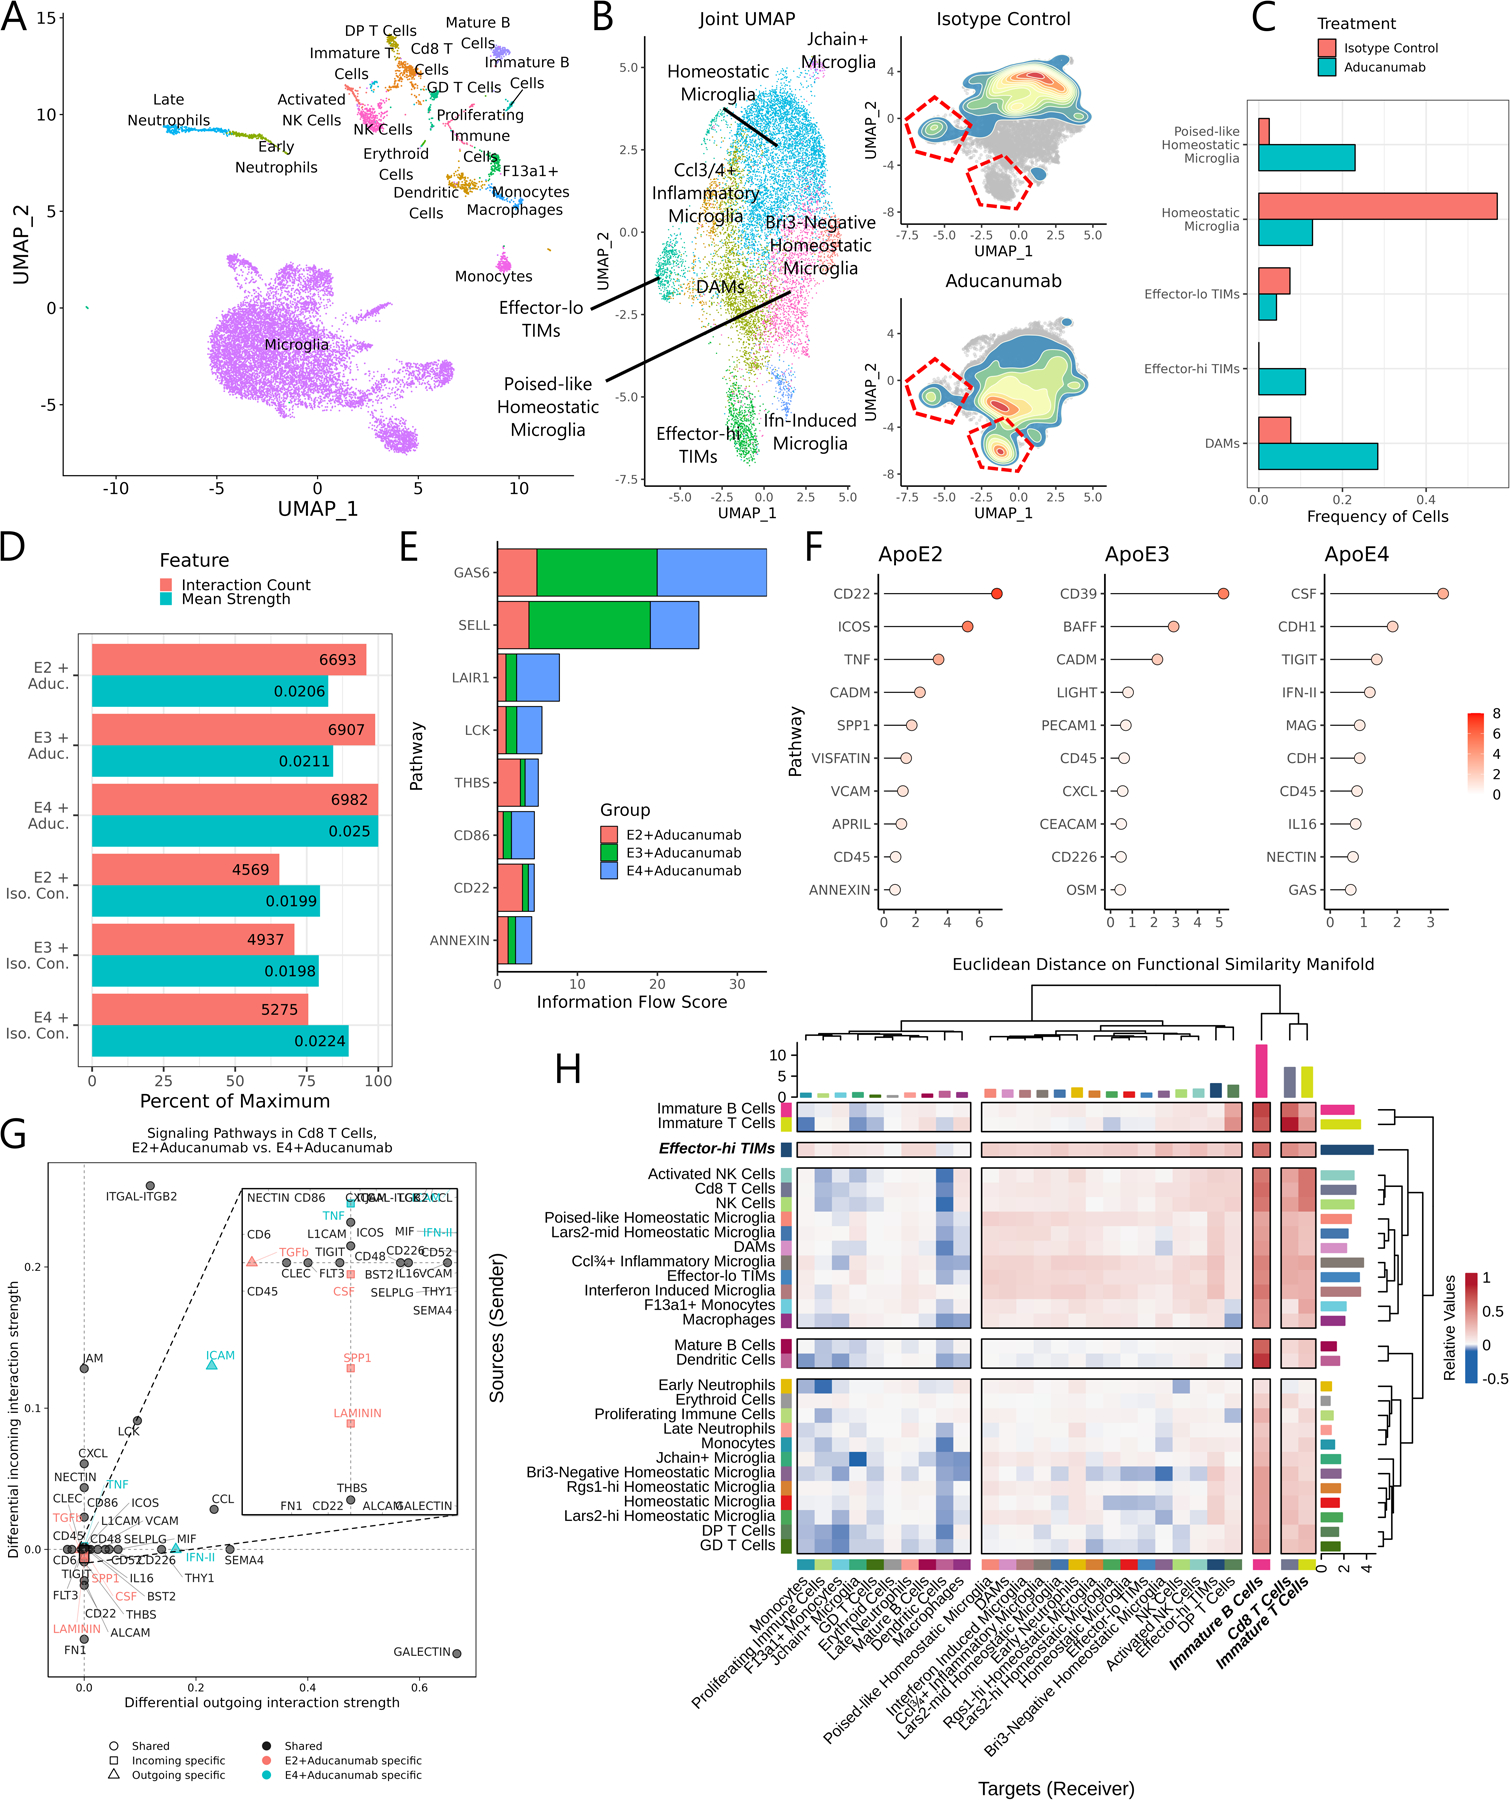
The dominant risk factors for late-onset Alzheimer's disease (AD) are advanced age and the APOE4 genetic variant. To examine how these factors alter neuroimmune function, we generated an integrative, longitudinal single-cell atlas of brain immune cells in AD model mice bearing the three common human APOE alleles. Transcriptomic and chromatin accessibility analyses identified a reactive microglial population defined by the concomitant expression of inflammatory signals and cell-intrinsic stress markers whose frequency increased with age and APOE4 burden. An analogous population was detectable in the brains of human AD patients, including in the cortical tissue, using multiplexed spatial transcriptomics. This population, which we designate as terminally inflammatory microglia (TIM), exhibited defects in amyloid-β clearance and altered cell-cell communication during aducanumab treatment. TIM may represent an exhausted-like state for inflammatory microglia in the AD milieu that contributes to AD risk and pathology in APOE4 carriers and the elderly, thus presenting a potential therapeutic target for AD.

Keywords: APOE; Alzheimer's disease; TIM; microglia; single cell.


Conflict of interest statement

Declaration of interests S.F.T. is a cofounder, shareholder, and member of the scientific advisory board of Inspirna.

Figures

Figure 1:
Figure 1:. The age- and APOE isoform-dependent AD neuroimmune atlas.
(A) Schematic of the workflow used to generate the atlas, generated from n = 3–6 animals per age and genotype. (B) UMAP of all cells in the atlas. (C) Subclustering and UMAP of microglia only. (D) 2D density plots overlaid on the microglial UMAP showing cell distributions at 10, 20, and 96 weeks of age. (E) Volcano plot of differentially expressed genes between TIMs and non-TIM microglia. The B-statistic is the log-odds that a gene is differentially expressed. Statistics were calculated using voom normalization and empirical Bayesian estimation through the limma package. (F) CellRank-calculated velocity streams on data from 20wk- and 96wk-year-old mice. Streams were estimated by a custom kernel based on splicing dynamics, connectivity, and CytoTRACE. Cells are embedded on the same UMAP manifold as in (C). (G) Stacked barplot of TIM subpopulations in the atlas from AD*APOE3 and AD*APOE4 animals at 96 weeks of age. (H) Boxplots of the proportion of effector-lo and effector-hi TIMs in bulk sequencing samples of 60-week-old AD*APOE animals, estimated by in silico decomposition with the atlas as a reference. Significance evaluated by Welch’s t-test.
Figure 2:
Figure 2:. TIMs are defined by a unique transcriptional program, interactome, and metabolic state.
(A) Heatmap of SCENIC-derived regulons per cluster, filtered to most highly variable transcription factors. (B) Lollipop plot of differentially enriched SCENIC-derived regulons between TIMs and all non-TIM microglia. Positive values indicate increased strength in TIMs. (C) Same as (B) but comparing effector-lo TIMs to effector-hi TIMs. Positive values indicate increased strength in effector-lo TIMs. (D) CellPhoneDB scores for ligand:receptor complexes, comparing TIMs and homeostatic microglia. (E) Same as (D) but comparing TIMs and DAMs. (F) Circos plot of the atlas interactome. Size of outermost bars represents number of interactions, divided into cluster-by-other and other-by-cluster. (G) Barplot showing the total number of interactions predicted to be made by each cluster. Superclusters follow the same division as in (F). Bars are means ± standard error, significance evaluated by Welch’s t-test. (H) Dot plot of the Cohen’s d of Compass scores for metabolic pathways, comparing TIMs to non-TIM microglia. Each point represents a reaction within the larger subsystem; subsystems are sorted by median enrichment value. Medians are indicated by crossed points.
Figure 3:
Figure 3:. Multiome sequencing of AD*APOE4 mice at 60 weeks of age nominates regulatory features of TIMs.
(A) Joint UMAP of RNA and ATAC features from the multiome library. (B) Volcano plot of chromVAR motif accessibility between TIMs and DAM-2 cells. (C) Scores for two topics derived from latent Dirichlet allocation of ATAC features and their associated transcription factors. (D) Heatmap of eRegulon enrichment and expression across microglial clusters. (E) Perturbation simulation plots ablating Fos and Nkfb2. Expression of the respective transcription factor was set to 0 and the gene regulatory networks were re-initialized to generate new expression profiles for each cell. Cells are projected in a PCA space defined by the gene regulatory net. Arrow shade indicates the magnitude of the transition flow. (F) Circos plot of the multiome dataset interactome. Size of outermost bars represents number of interactions, divided into cluster-by-other and other-by-cluster. (G) CellPhoneDB scores for ligand:receptor complexes, comparing TIMs and DAMs. Points are colored by whether the complex was also found to be differentially enriched in the atlas. (H) Dot plot of the Cohen’s d of Compass scores for metabolic pathways, comparing TIMs to DAM-2s. Each point represents a reaction within the larger subsystem; subsystems are sorted by median enrichment value. Medians are indicated by crossed points.
Figure 4:
Figure 4:. TIMs are detected in publicly available human snRNAseq datasets.
(A) UMAP projection of microglia from ten publicly available human snRNAseq datasets after anchor integration onto the data acquired in this study. (B) Barplot of TIM frequency in each dataset. (C) Boxplot of TIM frequency in data projected from Lau, 2020, grouped by disease state. Significance evaluated by Welch’s t-test. (D) Boxplot of TIM frequency in data projected from Leng, 2021, grouped by Braak stage, a measure of disease severity. Significance evaluated by Welch’s t-test. (E) Boxplot of TIM frequency in data projected from Blanchard, 2022, grouped by either amyloid-β burden or by presence of an APOE4 allele. Significance evaluated by Welch’s t-test. (F) Boxplot of TIM frequency in data projected from the Seattle AD Brain Atlas, grouped by post-mortem interval. Significance evaluated by Kruskal-Wallis test. (G) Multiple linear regression of TIM frequency by metadata provided in the second ROSMAP dorsolateral prefrontal cortex (n = 465).
Figure 5:
Figure 5:. TIMs are enriched in the cortical layers of human AD patients bearing ApoE4.
(A) Spatial scatter plot of cell annotations in two representative sections out of the six subjected to Xenium analysis. At left is the full section, at right is a zoomed inset of the indicated region. TIMs are marked by larger point sizes in the zoomed inset for clarity. (B) Barplot of the fraction of microglia from each genotype annotated as a TIM. (C) Smoothed trendlines of the increased likelihood of finding a given cell type within a circle of the indicated radius centered on a TIM compared to over base expectation. Only the top four most enriched clusters are shown. (D) Barbell plot showing the increased likelihood of finding a given cell type within a circle of the indicated radius centered on a TIM compared to base expectation, separated by genotype. Significance evaluated by Welch’s t-test. Clusters are colored by which genotype shows higher enrichment around TIMs. (E) Representative fluorescence micrographs of cortical tissue sections from APOE3 and APOE4 donors after post-Xenium staining with methoxy-X04 (a stain for Aβ) and accompanying annotations from Xenium data. TIMs are marked by larger point sizes in the Xenium annotations for clarity. Circled regions indicate areas of high overlap between TIMs and Aβ plaques.
Figure 6:
Figure 6:. TIMs are functionally impaired in capacity for amyloid-β clearance.
(A) Schematic of the experimental strategy to characterize microglial capacity for ex vivo Aβ uptake. (B) UMAP generated from all cells sequenced after the Aβ uptake experiment. (C) Joint subclustering UMAP of all microglial cells in the dataset and 2D density plots overlaid on the microglial UMAP showing cell distributions from the high uptake and low uptake populations. TIM clusters are outlined in red. Note that TIMs, and particularly effector-lo TIMs, are depleted in the high uptake fraction. (D) Barplot of the fraction of cells from each genotype and cluster in the high uptake pool and dotplot showing the fraction of cells from each genotype in the given cluster. Degree of over- or underrepresentation in the high uptake pool was evaluated using a chi-square test on the null expectation of an even split. P-values are reported at the α = 0.05 threshold.
Figure 7:
Figure 7:. Aducanumab treatment profoundly alters the landscape of immune cells in the AD milieu.
(A) UMAP of all cells from the unified aducanumab dataset. (B) Joint subclustering UMAP of all microglial cells in the dataset and 2D density plots overlaid on the microglial UMAP showing cell distributions from the aducanumab-treated and isotype control-treated populations. TIM clusters are outlined in red. (C) Barplot of the frequency of microglial clusters in aducanumab-treated and isotype control-treated populations. (D) Barplot of the number of predicted interactions and the mean predicted interaction strength from each of the six samples in the aducanumab dataset, as estimated by CellChat. (E) Stacked barplot showing the total information flow predicted by CellChat through each signaling pathway. (F) Lollipop plot showing pathways with highest differential regulation between aducanumab-treated and isotype control-treated samples in each genotype, quantified by Euclidean distance on the joint functional similarity manifold produced by CellChat embedding. (G) Dotplot of differentially enriched signaling pathways in Cd8 T cells between AD*APOE2 and AD*APOE4 aducanumab-treated animals by both incoming and outgoing signal strength. Pathways are color- and shape-coded by directionality and sample specificity. Positive numbers indicate a greater strength in AD*APOE4. (H) Heatmap showing the mean difference in incoming and outgoing signaling between aducanumab-treated and isotype control-treated animals. Positive numbers indicate a greater strength in aducanumab-treated animals. Note that the strongest increases in outgoing signaling are in inflammatory microglia and especially in effector-hi TIMs.

Comment in

Similar articles

Cited by

References

    1. Heneka MT, Carson MJ, Khoury JE, Landreth GE, Brosseron F, Feinstein DL, Jacobs AH, Wyss-Coray T, Vitorica J, Ransohoff RM, et al. (2015). Neuroinflammation in Alzheimer’s disease. Lancet Neurology 14, 388–405. 10.1016/s1474-4422(15)70016-5. - DOI - PMC - PubMed
    1. Long JM, and Holtzman DM (2019). Alzheimer Disease: An Update on Pathobiology and Treatment Strategies. Cell 179, 312–339. 10.1016/j.cell.2019.09.001. - DOI - PMC - PubMed
    1. Hansen DV, Hanson JE, and Sheng M (2018). Microglia in Alzheimer’s disease. J Cell Biol 217, 459–472. 10.1083/jcb.201709069. - DOI - PMC - PubMed
    1. Hammond TR, Dufort C, Dissing-Olesen L, Giera S, Young A, Wysoker A, Walker AJ, Gergits F, Segel M, Nemesh J, et al. (2018). Single-Cell RNA Sequencing of Microglia throughout the Mouse Lifespan and in the Injured Brain Reveals Complex Cell-State Changes. Immunity 50, 253–271.e6. 10.1016/j.immuni.2018.11.004. - DOI - PMC - PubMed
    1. Ginhoux F, Greter M, Leboeuf M, Nandi S, See P, Gokhan S, Mehler MF, Conway SJ, Ng LG, Stanley ER, et al. (2010). Fate mapping analysis reveals that adult microglia derive from primitive macrophages. Science (New York, N.Y.) 330, 841–845. 10.1126/science.1194637. - DOI - PMC - PubMed

Publication types