. 2024 Mar:507:34-43.
doi: 10.1016/j.ydbio.2023.12.010. Epub 2023 Dec 28.

Anp32e protects against accumulation of H2A.Z at Sox motif containing promoters during zebrafish gastrulation

Affiliations

Anp32e protects against accumulation of H2A.Z at Sox motif containing promoters during zebrafish gastrulation

Fabian N Halblander et al. Dev Biol. 2024 Mar.

Abstract

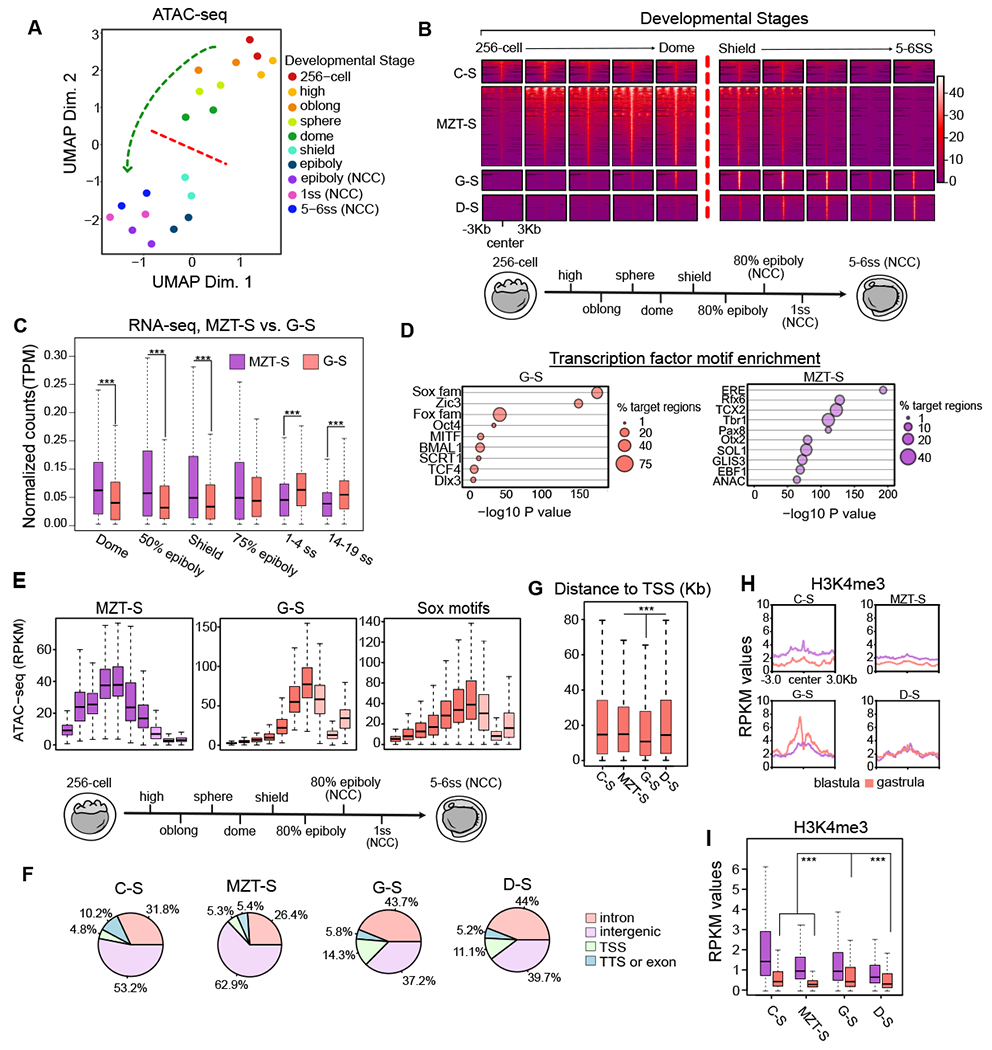
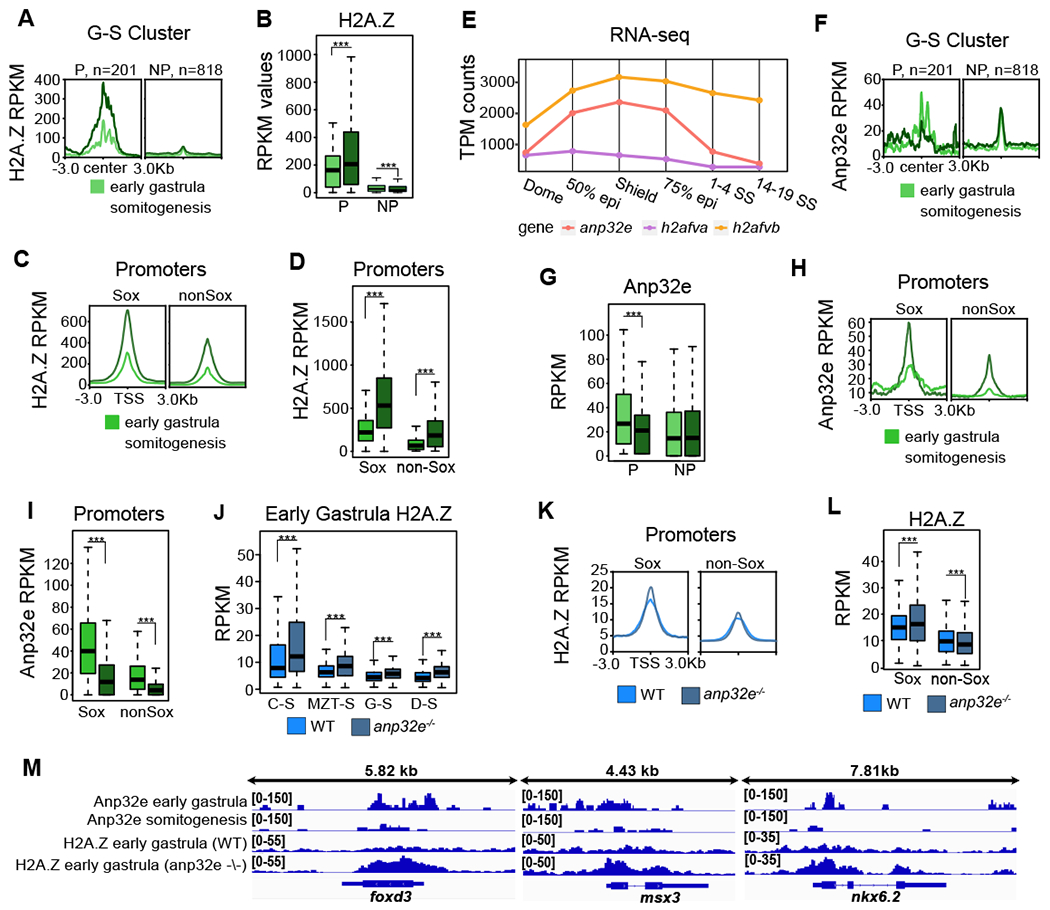
Epigenetic regulation of chromatin states is crucial for proper gene expression programs and progression during development, but precise mechanisms by which epigenetic factors influence differentiation remain poorly understood. Here we find that the histone variant H2A.Z accumulates at Sox motif-containing promoters during zebrafish gastrulation while neighboring genes become transcriptionally active. These changes coincide with reduced expression of anp32e, the H2A.Z histone removal chaperone, suggesting that loss of Anp32e may lead to increases in H2A.Z binding during differentiation. Remarkably, genetic removal of Anp32e in embryos leads to H2A.Z accumulation prior to gastrulation and developmental genes become precociously active. Accordingly, H2A.Z accumulation occurs most extensively at Sox motif-associated genes, including many which are normally activated following gastrulation. Altogether, our results provide compelling evidence for a mechanism in which Anp32e preferentially restricts H2A.Z accumulation at Sox motifs to regulate the initial phases of developmental differentiation in zebrafish.

Keywords: Anp32e; Chromatin accessibility; Embryonic development; H2A.Z; Neural crest; Sox.


Conflict of interest statement

Declarations of competing interest None.

Figures

Figure 1:
Figure 1:. H2A.Z accumulates at gastrulation-specific putative regulatory elements.
A. H3K4me1 and H3K4me3 peaks (ChIP-seq) are partitioned into stage-specific classes. Venn diagram depicts the number of peaks that are blastula-specific (purple), gastrula-specific (pink), or maintained in transition (blend of colors). B. Heatmaps H3K4me3 and H3K4me1 at blastula-specific, gastrula-specific, and shared peaks. In either H3K4me1 or H3K4me3, Blastula-specific regions decrease, gastrula-specific regions increase, and shared regions maintain. C. Genomic averages of H3K27ac (ChIP-seq), chromatin accessibility (ATAC-seq), and H2A.Z (CUT&Tag) at H3K4me1 gastrula-specific regions. D. Analogous to panel C at H3K4me3 gastrula-specific regions. E. Selection of transcription factor motifs enriched in gastrula-specific H3K4me1 and H3K4me3 regions. Enrichment is found for TCF, Twist, Dlx, Fox, and Sox factors between categories.
Figure 2:
Figure 2:. Changes of chromatin accessibility across developmental stages.
A. UMAP projection of a rank-normalized chromatin accessibility (ATAC-seq) profile recovers developmental stage of inputted samples. A genome-wide restructuring of chromatin state (motion of the green-arrow) distinguishes cleavage and blastula periods (above the red-line) from gastrulation and early differentiation periods (beneath the red-line). Datasets including and following epiboly are from purified Neural Crest Cell (NCC). Others are whole-embryo. B. Feature-to-feature visualization of read-count normalized accessibility data underlying UMAP analysis, classified by accessibility signature. Cleavage-Specific (C-S, n=1,105), MZT-Specific (MZT-S, n=3,873), Gastrulation Specific (G-S, n=969), and Differentiation-Specific (D-S, n=1,247) classes synchronize with different developmental periods. C. TPM-normalized gene-expression (RNA-seq) at genes nearest G-S and MZT-S loci. MZT-S-associated transcription is higher during MZT. G-S-associated gene transcription is increasing from shield stage (gastrulation) and overtakes MZT-S transcription by 1-4SS (neurula). (p< 0.001 for each). D. Transcription factor motif enrichment is displayed for G-S (left) and MZT-S (right). Motif and motif families are sorted by −log10 P-value measuring statistical significance. Motif% enrichment in target regions is visualized. E. Accessibility (ATAC-seq) patterns at Sox family motifs parallel patterns at G-S regions. This trend is contrasted by MZT-S regions. F. Breakdown of cluster gene annotation frequencies, where colors indicate annotation type. C-S and MZT-S regions are dominated by intergenic sequences. G-S and D-S regions are dominated by genic sequences. Of any class, G-S regions have the highest proportion of TSS. G. Absolute distance to TSS (base-pairs) for each cluster is also displayed. G-S regions are closest to TSS (p <0.001). H. Blastula and gastrula H3K4me3 enrichment in each accessibility class. Genomic averages suggest that H3K4me3 increases only at G-S regions. I. Boxplots analogous to profile plots in H. G-S regions have the highest H3K4me3 at gastrula.
Figure 3:
Figure 3:. Anp32e loss leads to H2A.Z accumulation at Sox motif containing promoters.
A. H2A.Z enrichment averages (CUT&Tag) for early (6hpf) and late (12hpf) gastrula stage embryos is displayed at G-S regions partitioned into promoters (P, n=201) and non-promoters (NP, n=818). B. Boxplots of H2A.Z levels in early and late stage gastrula embryos demonstrate increases at G-S promoters and decreases at G-S non-promoters during gastrulation (p<0.001). C. H2A.Z enrichment averages in early and late stage gastrula embryos at promoters containing Sox motifs (n=6,968, Sox) and promoters not containing Sox motifs (n=25,058, nonSox). D. Boxplots of H2A.Z levels in early and late gastrula embryos demonstrate that H2A.Z is more highly enriched at Sox promoters (p<0.001). E. Gene expression levels (RNA-seq) of anp32e, h2afva, and h2afvb from Dome (blastula) to 14-19SS (neurula). h2afva and h2afvb are increasing from dome (blastula) and are stably expressed after 75% epiboly (gastrulation). Expression of anp32e is reduced after 75% epiboly. F. ANP32E enrichment averages in early and late gastrula embryos at G-S regions partitioned into promoters (P) and non-promoters (NP). G. Boxplots of Anp32e levels in early and late gastrula embryos demonstrate decreases at G-S promoters (p<0.001). Anp32e stays the same at G-S non-promoters. H. Early and late gastrula average Anp32e enrichment at Sox and non-Sox promoters. I. Boxplots of early and late gastrula Anp32e levels show higher levels at Sox promoters than non-Sox promoters for each sample (p<0.001). J. Boxplots of H2A.Z levels in WT and anp32e−/− embryos at 6hpf (ChIP-seq). H2A.Z is measured at each of our previously identified accessibility clusters. H2A.Z increases at all regions in anp32e−/− embryos (p<0.001). K. Average enrichment of H2A.Z at Sox and non-Sox promoters in WT and anp32e−/−. L. Boxplots of H2A.Z levels at Sox and non-Sox promoters in WT and anp32e−/− embryos. Sox promoters increase in H2A.Z in KO embryos compared to WT at early gastrula. Non-Sox promoters decrease. M. Genome browser screenshots of Anp32e and H2A.Z enrichment in WT and anp32e−/− embryos at early gastrula. Sox promoter genes foxd3, msx3, and nkx6.2 are displayed. At these sites, Anp32e decreases over gastrulation, and excess H2A.Z accumulates in anp32e−/− embryos.
Figure 4:
Figure 4:. Anp32e loss leads to precocious developmental transcription of Sox-motif associated genes
A. PCA of a time course of rank normalized WT RNA-seq data for 1-cell, 256-cell, Shield, and 5-6SS, as well as anp32e−/− at shield stage (Shield anp32e−/− ). B. Heatmap of data underlying PCA analysis (k-means=10). Columns are grouped by sample. Rows are grouped by k-means clustering. Shield anp32e−/− for C1 and C6 show the clearest differences in expression. C. Boxplots of rank normalized RNA-seq of identified clusters. C6 Shield anp32e−/− increase slightly to approach the expression levels of 5-6SS embryos, and C1 Shield anp32e−/− decrease. One-tailed t-tests were used to establish that Shield anp32e−/− expression levels increase or decrease compared to Shield (p<0.001). D. RPKM of genes within C1 or C6. Trends identified in clusters are maintained in the absence of rank-normalization (p<0.001). E. A list of C6 GO terms. Redundant GO terms were removed and a cutoff of >=5 was set for −log10(p-value). F. Fraction of promoters containing one or more Sox motif in C6 versus all other genes. Fischer’s exact test and odds-ratio quantify difference of Sox and non-Sox fractions across gene set promoters. G. A selection of C6 genes. Fold-change of H2A.Z (12hpf/6hpf), Anp32e (12hpf/6hpf), and H2A.Z anp32e−/− /WT) are quantified at corresponding promoters. Promoters are marked for the presence of an embedded or adjacent Sox motif. H. A model for Sox-specific developmental regulation of H2A.Z by Anp32e is depicted. High Anp32e levels at the beginning of gastrulation prevent H2A.Z accumulation, thus maintaining transcriptional silencing at sox-motif-containing promoters, and developmental downregulation of Anp32e leads to H2A.Z accumulation, and neighboring gene upregulation.

Update of

Similar articles

Cited by

References

    1. Akdogan-Ozdilek B, Duval KL, Meng FW, Murphy PJ, Goll MG, 2022. Identification of chromatin states during zebrafish gastrulation using CUT&RUN and CUT&Tag. Developmental Dynamics 251, 729–742. 10.1002/dvdy.430 - DOI - PMC - PubMed
    1. Bannister AJ, Kouzarides T, 2011. Regulation of chromatin by histone modifications. Cell Res 21, 381–395. 10.1038/cr.2011.22 - DOI - PMC - PubMed
    1. Berta D, Kuisma H, Välimäki N, Räisänen M, Jäntti M, Pasanen A, Karhu A, Kaukomaa J, Taira A, Cajuso T, Nieminen S, Penttinen R-M, Ahonen S, Lehtonen R, Mehine M, Vahteristo P, Jalkanen J, Sahu B, Ravantti J, Mäkinen N, Rajamäki K, Palin K, Taipale J, Heikinheimo O, Butzow R, Kaasinen E, Aaltonen L, 2021. Deficient H2A.Z deposition is assoicated with genesis of uterine leiomyona. Nature 596, 398–403. - PubMed
    1. Bogdanovic O, Fernandez-Miñán A, Tena JJ, de la Calle-Mustienes E, Hidalgo C, van Kruysbergen I, van Heeringen SJ, Veenstra GJC, Gómez-Skarmeta JL, 2012. Dynamics of enhancer chromatin signatures mark the transition from pluripotency to cell specification during embryogenesis. Genome Res 22, 2043–2053. 10.1101/gr.134833.111 - DOI - PMC - PubMed
    1. Brunelle M, Nordell Markovits A, Rodrigue S, Lupien M, Jacques P-É, Gévry N, 2015. The histone variant H2A.Z is an important regulator of enhancer activity. Nucleic Acids Res 43, 9742–9756. 10.1093/nar/gkv825 - DOI - PMC - PubMed

Publication types