. 2024 Jan 1;9(1):2.
doi: 10.1038/s41392-023-01707-x.

EZH2 inhibitors promote β-like cell regeneration in young and adult type 1 diabetes donors

Affiliations

EZH2 inhibitors promote β-like cell regeneration in young and adult type 1 diabetes donors

Keith Al-Hasani et al. Signal Transduct Target Ther. .

Abstract

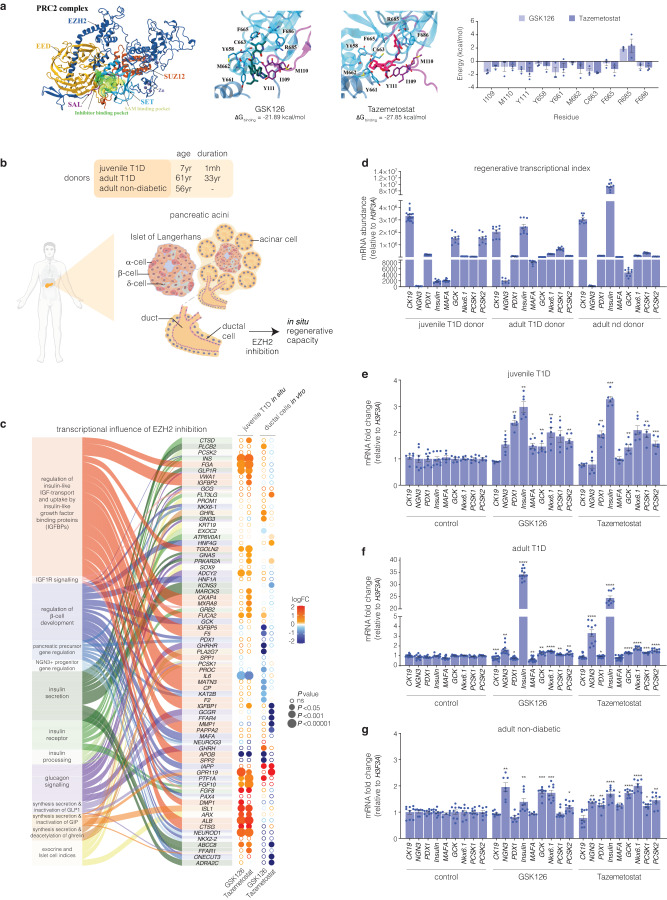
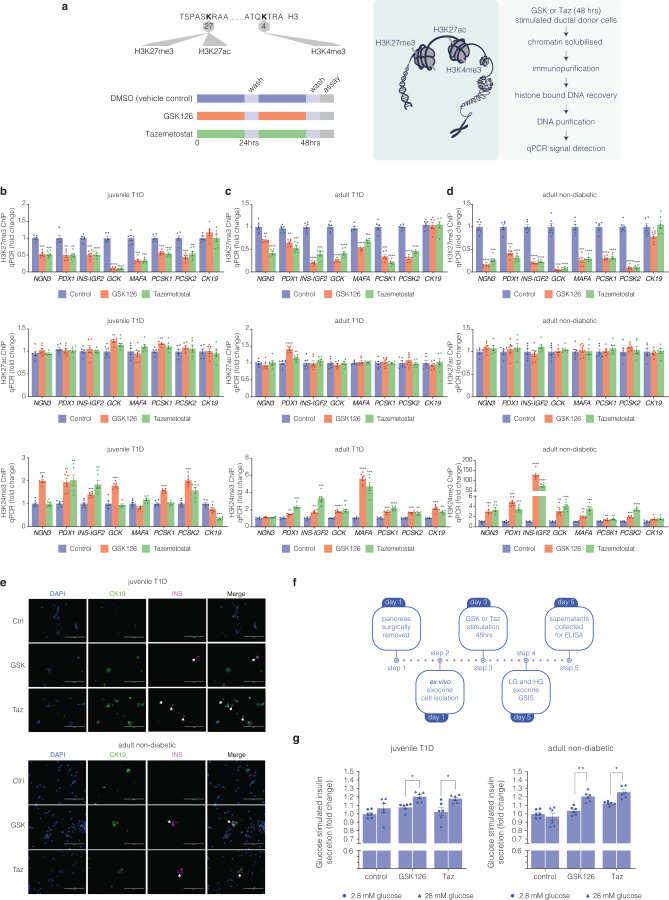
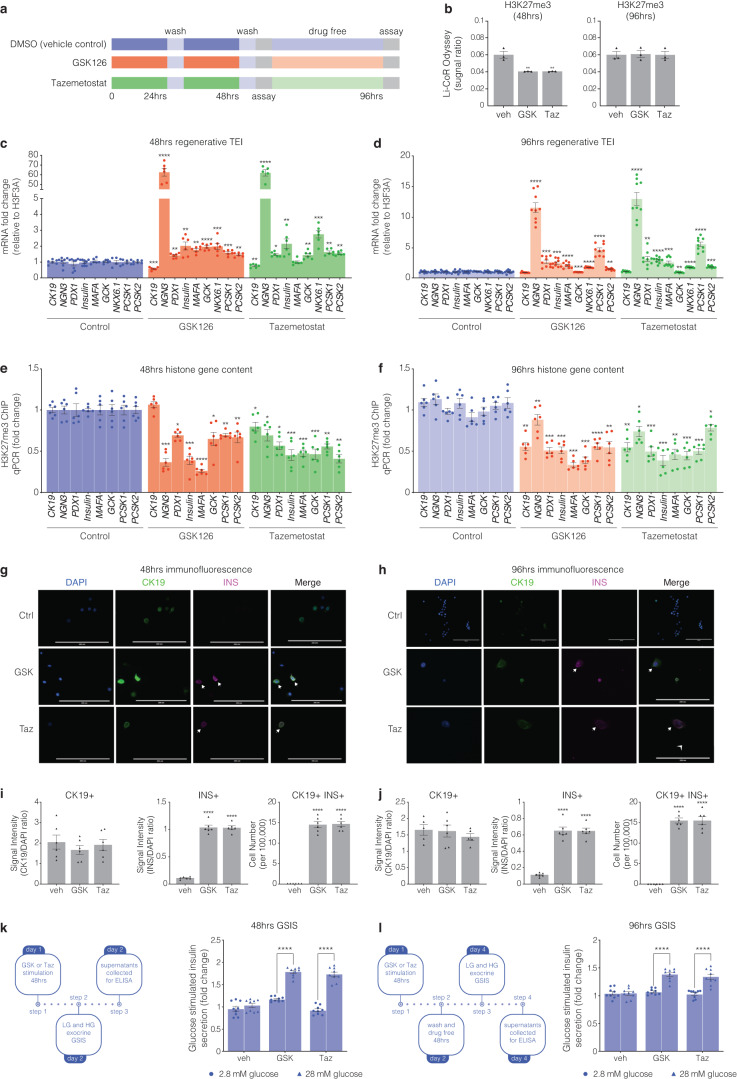
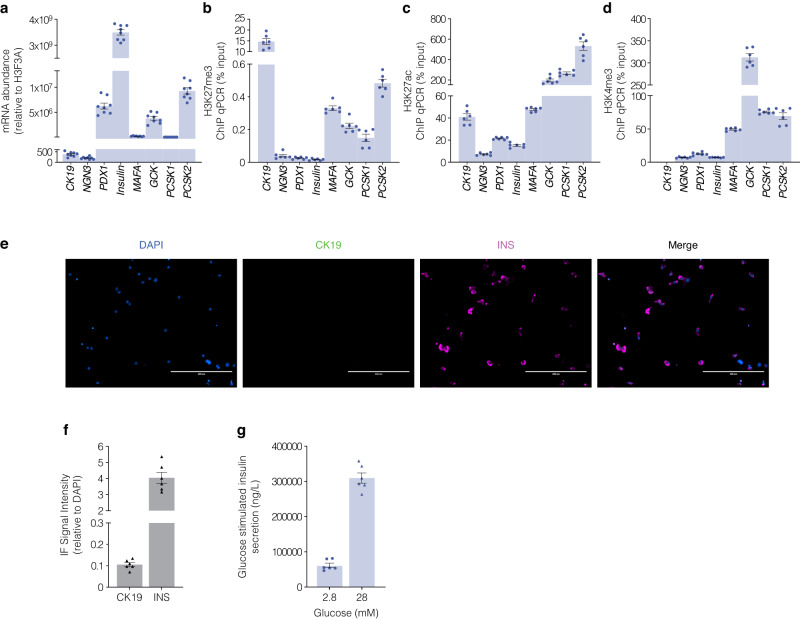
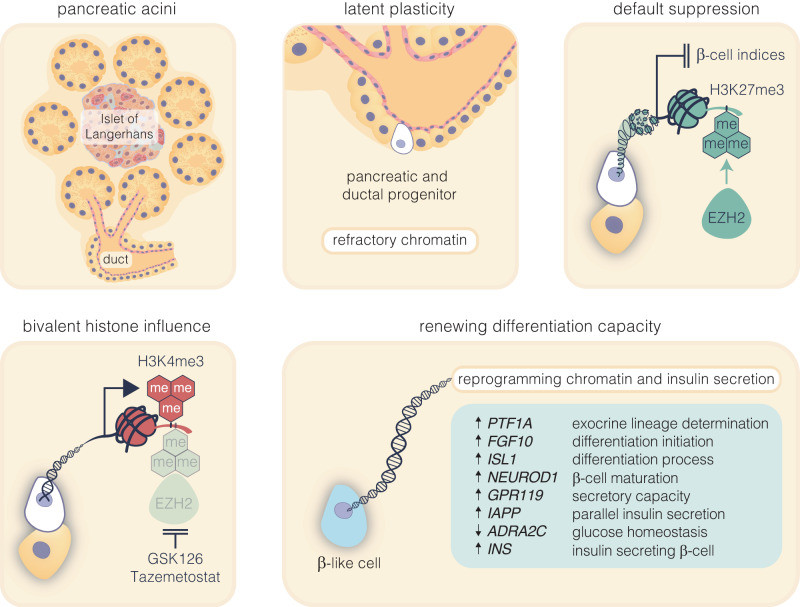
β-cells are a type of endocrine cell found in pancreatic islets that synthesize, store and release insulin. In type 1 diabetes (T1D), T-cells of the immune system selectively destroy the insulin-producing β-cells. Destruction of these cells leads to a lifelong dependence on exogenous insulin administration for survival. Consequently, there is an urgent need to identify novel therapies that stimulate β-cell growth and induce β-cell function. We and others have shown that pancreatic ductal progenitor cells are a promising source for regenerating β-cells for T1D owing to their inherent differentiation capacity. Default transcriptional suppression is refractory to exocrine reaction and tightly controls the regenerative potential by the EZH2 methyltransferase. In the present study, we show that transient stimulation of exocrine cells, derived from juvenile and adult T1D donors to the FDA-approved EZH2 inhibitors GSK126 and Tazemetostat (Taz) influence a phenotypic shift towards a β-like cell identity. The transition from repressed to permissive chromatin states are dependent on bivalent H3K27me3 and H3K4me3 chromatin modification. Targeting EZH2 is fundamental to β-cell regenerative potential. Reprogrammed pancreatic ductal cells exhibit insulin production and secretion in response to a physiological glucose challenge ex vivo. These pre-clinical studies underscore the potential of small molecule inhibitors as novel modulators of ductal progenitor differentiation and a promising new approach for the restoration of β-like cell function.


Conflict of interest statement

The authors declare no competing interests.

Figures

Fig. 1
Fig. 1
Inhibition of EZH2 by GSK126 and Tazemetostat reactivates the expression of endocrine markers in exocrine cells. a Structure of the human polycomb repressive 2 (PRC2) complex composed of EZH2 (dark blue), EED (light orange), and SUZ12 (dark orange) displayed in cartoon representation. The catalytic SET domain (cyan) and the SET activation loop (SAL, purple) of EZH2 are highlighted. The binding pocket for pyridine inhibitors partially overlaps with the SAM binding pocket, shown in surface representation. Binding free energies of GSK126 and Taz were calculated with MM-PBSA. Binding energy was decomposed on a per-residue basis, with energies for residues of the SET and SAL domains displayed as mean ± SEM. Structures of GSK126 (teal), Taz (magenta), and residues of the SET (cyan) and SAL (purple) domains are shown as sticks. b Schematic of human exocrine tissue isolation from Type 1 diabetic (T1D) and non-diabetic donors featuring the in vivo location of ductal cells stimulated by EZH2 inhibitors. c RNA-seq analysis showing differential expression of canonical β-cell and exocrine markers derived from Reactome database in T1D pancreatic tissue and human pancreatic ductal epithelial cells following EZH2 inhibition using GSK126 or Taz. The left panel illustrates the association of functional pathway descriptors with individual genes. The right panel displays differential gene expression by inhibitor group in circular format. Log2 fold change (logFC) is represented by a diverging red (increase) – blue (decrease) colour gradients. Expression significance (decreasing P-value) is illustrated by larger circular diameter. Hollow circles are non-significant change (ns = P > 0.05). d Comparison of mRNA expression levels of key regenerative genes that include CK19, NGN3, PDX1, INS, MAFA, GCK, NKX6.1, PCSK1 and PCSK2 relative to H3F3A in T1D and non-diabetic donors before EZH2 inhibitor stimulation. Insulin (INS) expression is barely detectable in juvenile T1D and significantly reduced in adult T1D donor when compared to the non-diabetic donor. Data are represented as mean of experiments performed using non-diabetic and T1D donors with 3 technical replicates, error bars are S.E.M. e Fold change in the transcriptional expression index of CK19, NGN3, PDX1, INS, MAFA, GCK, NKX6.1, PCSK1, and PCSK2 relative to H3F3A mRNA in juvenile T1D donor. Data are represented as mean of experiments conducted in non-diabetic and T1D donors. EZH2 inhibition studies were repeated 3 times with technical replicates. Statistical significance was calculated by comparing control vs inhibitor values using Student t-test, *P < 0.05, **P < 0.01, ***P < 0.001, error bars are S.E.M. f Fold change in the transcriptional expression index of CK19, NGN3, PDX1, INS, MAFA, GCK, NKX6.1, PCSK1 and PCSK2 in adult T1D donor, displayed as fold change relative to H3F3A mRNA levels. Data are represented as mean of experiments conducted in non-diabetic and T1D donors. EZH2 inhibition studies were repeated repeated 3 times with technical replicates. Statistical significance was calculated by comparing control vs inhibitor values using Student t-test, *P < 0.05, **P < 0.01, ***P < 0.001, ****P < 0.0001, error bars are S.E.M. g Fold change in the transcriptional expression index of CK19, NGN3, PDX1, INS, MAFA, GCK, NKX6.1, PCSK1 and PCSK2 in adult non-diabetic donor, shown as fold change relative to H3F3A mRNA levels. Data are represented as mean of experiments conducted in non-diabetic and T1D donors. EZH2 inhibition studies were repeated repeated 3 times with technical replicates. Statistical significance was calculated by comparing control vs inhibitor values using Student t-test, *P < 0.05, **P < 0.01, ***P < 0.001, ****P < 0.0001, error bars are S.E.M
Fig. 2
Fig. 2
Bivalent chromatin protects regenerative exocrine capacity and insulin expression from default transcriptional suppression. a Schematic of histone tail modification for H3K27me3, H3K27ac and H3K4me3 content. Also shown is the protocol used to stimulate CK19+ve ductal cells derived from juvenile and adult T1D donors with EZH2 inhibitors for 48 h and assessed for chromatin content, immunofluorescence and GSIS assays. b GSK126 and Taz influences bivalent chromatin domains in human exocrine CK19+ve cells derived from juvenile T1D donor. Quantitative PCR analyses of DNA in ChIP using anti-H3K27me3, anti-H3K27ac and anti-H3K4me3 antibodies for NGN3, PDX1, INS-IGF2, MAFA, GCK, PCSK1, PCSK2, and CK19 are displayed as fold change calculated and adjusted to control values. Data are represented as mean ± S.E.M. of percent input (EZH2 inhibition; n = 6). Vehicle control was DMSO. Statistical significance was calculated by comparing control vs GSK126 or Tazemetostat using Student t-test, *P < 0.05, **P < 0.01, ***P < 0.001, ****P < 0.0001. c GSK126 and Taz influences bivalent chromatin domains in human exocrine CK19+ve cells derived from adult T1D donor. Quantitative PCR analyses of DNA in ChIP using anti-H3K27me3, anti-H3K27ac and anti-H3K4me3 antibodies for NGN3, PDX1, INS-IGF2, MAFA, GCK, PCSK1, PCSK2, and CK19 are displayed as fold change calculated and adjusted to control values. Data are represented as mean ± S.E.M. of percent input (EZH2 inhibition; n = 6). Vehicle control was DMSO. Statistical significance was calculated by comparing control vs GSK126 or Tazemetostat using Student t-test, **P < 0.01, ***P < 0.001, ****P < 0.0001. d GSK126 and Taz influences bivalent chromatin domains in human exocrine CK19+ve cells derived from adult non-diabetic donor. Quantitative PCR analyses of DNA in ChIP using anti-H3K27me3, anti-H3K27ac and anti-H3K4me3 antibodies for NGN3, PDX1, INS-IGF2, MAFA, GCK, PCSK1, PCSK2, and CK19 are displayed as fold change calculated and adjusted to control values. Data are represented as mean ± S.E.M. of percent input (EZH2 inhibitor stimulation; n = 6). Statistical significance was calculated by comparing control vs GSK126 or Tazemetostat using Student t-test, *P < 0.05, **P < 0.01, ***P < 0.001, ****P < 0.0001. e GSK126 and Taz stimulate insulin protein expression in CK19+ve cells derived from juvenile T1D and adult non-diabetic donors. DAPI served as a control for nuclear staining. Images are representative of pharmacological EZH2 inhibition (n = 3). Scale bar represents 100 μm. White arrows point to CK19+INS+ cells. f Glucose responsiveness in exocrine tissue was assessed through a 5-step process: Day 1 pancreatic removal and isolation followed by 48-hour stimulation with GSK126 or Tazemetostat. The assay for glucose-stimulated insulin secretion was performed on Day 5, using low and high-glucose Kreb’s buffer. Insulin concentration was determined by ELISA. g Fold change of insulin release in low (2.8 mM) and high (28 mM) glucose conditions from GSK126 and Taz stimulated cells in juvenile T1D and adult non-diabetic donors. Data of two replicate experiments represented as mean ± S.E.M of fold change relative to control. Statistical significance was calculated by comparing 2.8 mM vs 28 mM glucose using Student t-test, *P < 0.05, **P < 0.01
Fig. 3
Fig. 3
Human pancreatic ductal epithelial cells express β-cell indices in response to pharmacological EZH2 inhibition. a Cells were stimulated with GSK126 or Tazemetostat over a 48-hour period. Assays were then performed at the 48-hour time point as well as 48 h following drug free conditions at the 96-hour time point. b Histones were prepared by acid extraction. Quantification of H3K27me3 levels were calculated and adjusted to overall histone H3 using Li-COR Odyssey. The signal ratio for H3K27me3/total H3 was calculated at 48 and 96 h. Vehicle control is DMSO. Data are presented as mean with error bars as S.E.M of 3 replicates of stimulation. Statistical significance was calculated by comparing control vs inhibitor values using Student t-test, **P < 0.01. c Regenerative TEI of CK19, NGN3, PDX1, INS, MAFA, GCK, NKX6.1, PCSK1, and PCSK2 in pancreatic ductal cells after 48 h stimulation with GSK126 or Tazemetostat assessed by qRT-PCR, normalised to H3F3A and adjusted to controls. Data are represented as mean of 3 replicates. Statistical significance was calculated by comparing control vs inhibitor values using Student t-test, *P < 0.05, **P < 0.01, ***P < 0.001, ****P < 0.0001, error bars are S.E.M. d Regenerative TEI of CK19, NGN3, PDX1, INS, MAFA, GCK, NKX6.1, PCSK1, and PCSK2 in pancreatic ductal cells after 48 h stimulation with GSK126 or Tazemetostat followed by 48 h drug free conditions (96 h) assessed by qRT-PCR, normalised to H3F3A and adjusted to controls. Data are represented as mean of 3 replicates. Statistical significance was calculated by comparing control vs inhibitor values using Student t-test, **P < 0.01, ***P < 0.001, ****P < 0.0001, error bars are S.E.M. e Chromatin immunoprecipitation of H3K27me3 content for regenerative genes include CK19, NGN3, PDX1, INS-IGF2, MAFA, GCK, PCSK1, and PCSK2 in pancreatic ductal cells following 48 h of GSK126 or Taz stimulation assessed by qPCR and represented as fold change, normalised and adjusted to controls. Data are represented as mean ± S.E.M. of percent input (GSK126 or Taz stimulation; n = 3). Statistical significance was calculated by comparing control vs GSK126 or Taz using Student t-test, *P < 0.05, **P < 0.01, ***P < 0.001, ****P < 0.0001. f Chromatin immunoprecipitation of H3K27me3 content for regenerative genes include CK19, NGN3, PDX1, INS-IGF2, MAFA, GCK, PCSK1, and PCSK2 in pancreatic ductal cells after 48 h stimulation with GSK126 or Taz followed by 48 h drug free conditions (96 h) assessed by qPCR and represented as fold change, normalised and adjusted to controls. Data are represented as mean ± S.E.M. of percent input (GSK126 or Taz stimulation; n = 3). Statistical significance was calculated by comparing control vs GSK126 or Taz using Student t-test, *P < 0.05, **P < 0.01, ***P < 0.001, ****P < 0.0001. g Immunofluorescence staining of human pancreatic ductal cells stimulated after 48 h stimulation with GSK126 or Taz. Cells were stained for DAPI, CK19, and INS. Images across three replicates of stimulation were captured at 20x magnification using ThermoFisher EVOS and processed with ImageJ. Scale bar represents 200 μm. Arrows point to CK19+INS+ cells. h Immunofluorescence staining of human pancreatic ductal cells stimulated after 48 h stimulation with GSK126 or Taz followed by 48 h drug free conditions (96 h). Cells were stained for DAPI, CK19, and INS. Images across three replicates of stimulation were captured at 20x magnification using ThermoFisher EVOS and processed with ImageJ. Scale bar represents 200 μm. Arrows point to CK19+INS+ cells. i Quantifiction of immunofluorescence staining of human pancreatic ductal cells stimulated after 48 h stimulation with GSK126 or Taz. Protein expression was quantified by normalizing the CK19+, INS+ and CK19+/INS+ signals relative to the nuclear DAPI signal. Insulin expressing cells were scored across a total of 1 × 105 cells seeded on coverslips. Data are represented as mean ± S.E.M. of 6 replicates. Statistical significance was calculated by comparing control vs GSK126 or Taz using Student t-test, ****P < 0.0001. j Quantifiction of immunofluorescence staining of human pancreatic ductal cells stimulated after 48 h stimulation with GSK126 or Taz followed by 48 h drug free conditions (96 h). Protein expression was quantified by normalizing the CK19+, INS+ and CK19+/INS+ signals relative to the nuclear DAPI signal. Insulin expressing cells were scored across a total of 1 × 105 cells seeded on coverslips. Data are represented as mean ± S.E.M. of 6 replicates. Statistical significance was calculated by comparing control vs GSK126 or Taz using Student t-test, ****P < 0.0001. k Glucose-stimulated insulin secretion assay assessed the regenerative capacity in human pancreatic ductal cells after 48-hour stimulation with GSK126 or Taz. Cells were exposed to low (2.8 mM) and high (28 mM) glucose conditions. Insulin secretion was quantified by ELISA. Fold changes in insulin release are shown for both glucose conditions. Data are of three replicate experiments represented as mean ± S.E.M of fold change relative to control. Statistical significance was calculated by comparing 2.8 mM vs 28 mM glucose using Student t-test, ****P < 0.0001. l Glucose-stimulated insulin secretion assay assessed the regenerative capacity in human pancreatic ductal cells after 48-hour stimulation with GSK126 or Taz followed by 48 h drug free conditions (96 h). Cells were exposed to low (2.8 mM) and high (28 mM) glucose conditions. Insulin secretion was quantified by ELISA. Fold changes in insulin release are shown for both glucose conditions. Data are of three replicate experiments represented as mean ± S.E.M of fold change relative to control. Statistical significance was calculated by comparing 2.8 mM vs 28 mM glucose using Student t-test, ****P < 0.0001
Fig. 4
Fig. 4
Characteristic transcriptional indices of β-cells show robust insulin signal underscored by reduced H3K27me3 gene content. a The expression of mRNA transcripts for CK19, NGN3, PDX1, INS, MAFA, GCK, PCSK1 and PCSK2 genes from mature EndoC-βH5 cells relative to H3F3A are displayed. Data are represented as mean of 3 replicates, error bars are S.E.M. b Chromatin immunoprecipitation for suppressive H3K27me3 chromatin content for CK19, NGN3, PDX1, INS-IGF2, MAFA, GCK, PCSK1 and PCSK2 genes derived from EndoC-βH5 cells. Data are represented as mean ± S.E.M. of percent input (n = 3). c Chromatin immunoprecipitation for permissive H3K27ac chromatin content for CK19, NGN3, PDX1, INS-IGF2, MAFA, GCK, PCSK1 and PCSK2 genes derived from EndoC-βH5 cells. Data are represented as mean ± S.E.M. of percent input (n = 3). d Chromatin immunoprecipitation for permissive H3K4me3 chromatin content for CK19, NGN3, PDX1, INS-IGF2, MAFA, GCK, PCSK1 and PCSK2 genes derived from EndoC-βH5 cells. Data are represented as mean ± S.E.M. of percent input (n = 3). e Immunofluorescence staining confirms functionally mature EndoC-βH5 cells. Staining was performed for DAPI, CK19, and INS. Images across three replicates of stimulation were captured at 20x magnification using ThermoFisher EVOS and processed with ImageJ. Scale bar represents 200 μm. White arrows point to CK19+INS+ cells. f Protein signal of immunofluorescence staining positive for INS in the absence of CK19 in EndoC-βH5 cells. Staining was assessed by adjusting the CK19 or INS signals to the nuclear DAPI signal. Data are represented as mean ± S.E.M. g Glucose stimulated insulin assays assessed in EndoC-βH5 cells. Fold change of insulin release in low (2.8 mM) and high (28 mM) glucose conditions. Data are of three replicate experiments represented as mean ± S.E.M of insulin concentration
Fig. 5
Fig. 5
Pharmacological inhibition of EZH2 catalyses pancreatic progenitor activation and β-cell maturation. The schematic outlines the progression from pancreatic multipotent progenitors to mature insulin-secreting β-cells, highlighting the regulatory target of EZH2 inhibitors, GSK126 and Tazemetostat. These progenitors, originating in the Islets of Langerhans’ pancreatic ducts, are maintained in a multipotent state post-development associated with EZH2-mediated suppression with H3K27me3 content enriched on endocrine genes. Reducing H3K27me3 levels shifts bivalent H3K4me3 mark on these progenitors towards the endocrine lineage, marked by PTF1A activation and primes these cells for β-cell differentiation. While FGF10 signalling stabilises this progenitor state, ISL1 and NEUROD1 influence endocrine commitment that support β-cell maturation. Upregulation of GPR119 and IAPP, along with the downregulation of ADRA2C, weakens inhibitory signals, facilitating glucose-stimulated insulin secretion

Similar articles

Cited by

References

    1. Gruessner RWG. The current state of clinical islet transplantation. Lancet Diabetes Endocrinol. 2022;10:476–478. doi: 10.1016/S2213-8587(22)00138-3. - DOI - PubMed
    1. Shapiro AM, Pokrywczynska M, Ricordi C. Clinical pancreatic islet transplantation. Nat. Rev. Endocrinol. 2017;13:268–277. doi: 10.1038/nrendo.2016.178. - DOI - PubMed
    1. Vantyghem MC, de Koning EJP, Pattou F, Rickels MR. Advances in β-cell replacement therapy for the treatment of type 1 diabetes. Lancet. 2019;394:1274–1285. doi: 10.1016/S0140-6736(19)31334-0. - DOI - PMC - PubMed
    1. Bonner-Weir S, Baxter LA, Schuppin GT, Smith FE. A second pathway for regeneration of adult exocrine and endocrine pancreas: a possible recapitulation of embryonic development. Diabetes. 1993;42:1715–1720. doi: 10.2337/diab.42.12.1715. - DOI - PubMed
    1. Bonner‐Weir S, et al. The pancreatic ductal epithelium serves as a potential pool of progenitor cells. Pediatr. Diabetes. 2004;5:16–22. doi: 10.1111/j.1399-543X.2004.00075.x. - DOI - PubMed

MeSH terms