. 2024 Mar;11(11):e2305885.
doi: 10.1002/advs.202305885. Epub 2023 Dec 31.

Phosphoproteomic Characterization and Kinase Signature Predict Response to Venetoclax Plus 3+7 Chemotherapy in Acute Myeloid Leukemia

Affiliations

Phosphoproteomic Characterization and Kinase Signature Predict Response to Venetoclax Plus 3+7 Chemotherapy in Acute Myeloid Leukemia

Jie Jin et al. Adv Sci (Weinh). 2024 Mar.

Abstract

Resistance to chemotherapy remains a formidable obstacle in acute myeloid leukemia (AML) therapeutic management, necessitating the exploration of optimal strategies to maximize therapeutic benefits. Venetoclax with 3+7 daunorubicin and cytarabine (DAV regimen) in young adult de novo AML patients is evaluated. 90% of treated patients achieved complete remission, underscoring the potential of this regimen as a compelling therapeutic intervention. To elucidate underlying mechanisms governing response to DAV in AML, quantitative phosphoproteomics to discern distinct molecular signatures characterizing a subset of DAV-sensitive patients is used. Cluster analysis reveals an enrichment of phosphoproteins implicated in chromatin organization and RNA processing within DAV-susceptible and DA-resistant AML patients. Furthermore, kinase activity profiling identifies AURKB as a candidate indicator of DAV regimen efficacy in DA-resistant AML due to AURKB activation. Intriguingly, AML cells overexpressing AURKB exhibit attenuated MCL-1 expression, rendering them receptive to DAV treatment and maintaining them resistant to DA treatment. Moreover, the dataset delineates a shared kinase, AKT1, associated with DAV response. Notably, AKT1 inhibition augments the antileukemic efficacy of DAV treatment in AML. Overall, this phosphoproteomic study identifies the role of AURKB as a predictive biomarker for DA, but not DAV, resistance and proposes a promising strategy to counteract therapy resistance in AML.

Keywords: AKT1; AURKB; acute myeloid leukemia; drug resistance; venetoclax.


Conflict of interest statement

The authors declare no conflict of interest.

Figures
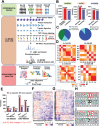
Figure 1
Figure 1
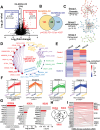
Quantitative phosphoproteomics profiling reveals a conserved signature linked to DAV regimen response in AML. A) Experimental design and phosphoproteomics workflow used to investigate the sensitivity and resistance to DAV in AML. Patients were categorized into complete remission (CR) and non‐response (NR). B) Number of phosphoproteins, phospho‐sites, and phosphopeptides identified and quantified in this study. C) Distribution of phosphopeptides with one, two, or more phosphorylated sites. Distribution of phosphorylated serine (S), threonine (T), and tyrosine (Y) sites in bone marrow cells from 33 patients with AML. D) Heatmap showing Pearson's correlation coefficients (R2) of phospho‐proteome data, indicating reproducibility among individual BM cells from patients with AML among CR or NR groups. E) Summary of differential phosphoproteins identified in comparisons of DA‐NR versus CR and DAV‐NR versus CR groups. The criteria for differential phosphoproteins were a fold change (NR/CR) of >1.3 or <0.67 and p<0.05. The selection of differential proteins was made from a pool of 3804 phosphoproteins that were both identified and quantified in all four patient groups. F, G) Heatmaps showing the normalized abundance of differential phosphoproteins through unsupervised hierarchical clustering in 33 individual samples. Most specimens exhibited distinct unsupervised hierarchical clustering in 33 individual samples. H, I) Motif analysis of the phospho‐sites, with top phosphorylation motif of S, T enriched in total identified phosphorylated proteins (H), and differential phosphoproteins in DAV‐NR/CR (I). The numbers displayed under each motif indicate the positions upstream and downstream relative to the central phosphorylation site.
Figure 2
Figure 2
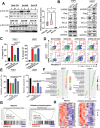
Kinase signature associated with treatment response to DA and DAV regimen pinpoint AURKB activation. A) Volcano plot illustrating the distribution of phosphorylated proteins with their relative protein abundance in the DA‐NR and DA‐CR groups. Phosphoproteins with a fold change (DA‐NR/CR) of >1.5 or <0.67 and a significance level (p‐value) of <0.05 are depicted in red (increased) or blue (decreased). B) Venn diagram comparing the differential phosphoprotein datasets between the DA‐NR/DA‐CR and DA‐NR/DAV‐CR groups. C) Functional protein‐protein interaction (PPI) network of enriched phosphoproteins associated with DAV regimen susceptibility. The network was generated using stringAPP and clusters using MCL clustering. An analysis of Gene Ontology enrichment was conducted, yielding four distinct groupings. D) PPI network and significant models constructed by Metascape analysis. E) Hierarchical clustering of 164 significantly regulated proteins potentially involved in DAV sensitivity according to their respective expression level across the DA‐CR, DA‐NR, and DAV‐CR groups. F) Protein expression profiles for each cluster were shown on the left, with the most enriched gene ontology term shown at the bottom of each profile. G) Significantly activated kinases associated with the susceptibility of DAV regimens based on ROKAI, KSE1A, and KEA3 analyses. Gary bars represent the enriched analysis, whereas blue bars indicate high confidence and consistent kinases, highlighted by three analysis tools. H) Venn diagram showing the top 10 significant kinases enriched by ROKIA, KSEA, or KEA3 analyses, respectively. I) Sankey diagram displaying the top 10 enriched phosphoproteins (substrates) of the DAV‐sensitivity signature and their corresponding kinases, as determined by KSEA analysis (kinase‐substrate link).
Figure 3
Figure 3
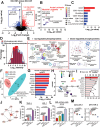
DAV regimen restores the sensitivity of DA resistance caused by AURKB activation in AML. A) Immunoblot analysis of lysates from newly diagnosed AML specimens, showing the levels of phosphorylated Histone 3 at S10 (p‐H3S10) and total Histone 3. DAV‐CR (n = 5); DA‐NR (n = 6); and DA‐CR (n = 5). Protein expression was quantified using the ImageJ software. B) THP1 and U937 cells were transfected with a Flag‐tagged AURKB expression plasmid to ectopically overexpress AURKB. The lysates were immunoblotted for the indicated antibodies. C, D) THP1 or U937 cells with mock or AURKB overexpression were treated with DMSO, DA(D+A), or DAV(D+A+V) [Daunorubicin D): 5 nm, Cytarabine (A): 100 nm, and Venetoclax (V): 50 nM] for 48 h. Cell apoptosis was indicated by Annexin V and DAPI staining (n = 3 replicates per sample). E) The cell viability of mock and AURKB‐overexpressing THP‐1 or U937 cells was analyzed after treatment with the indicated drugs for 48 h (n = 3 replicates per sample). F) Scattergrams of top hallmark gene sets based on enrichment analyses of expressed genes in U937 (AURKB‐OE versus mock) and THP1 (AURKB‐OE vs mock) The color indicates the false discovery rate q values. NES, normalized enrichment score. G) Gene set enrichment analysis (GSEA) plots of hypoxia that were up‐regulated and oxidative phosphorylation was down‐regulated upon AURKB overexpression in U937 cells. H) The HALLMARK_OXIDATIVE_PHOSPHORYLATION gene set was down‐regulated in the AURKB_OE group of the U937 cell line. The heat map shows the scaled expression of the CORE ENRICHMENT genes of this gene set in both groups. Error bars represent the SEM.
Figure 4
Figure 4
AKT1 activation is a specific marker of AML resistance to DAV treatment. Volcano plot displaying the distribution of phosphorylated proteins with relative protein abundance in DAV‐NR versus DAV‐CR (FC>1.3 or <0.77 and p<0.05). B, C) Enrichment analysis of disease (B) and cell type (C) based on differential phosphoproteins in DAV‐NR/CR, according to piNET analysis (a versatile web platform for downstream analysis and visualization of proteomic datasets). D) iBAQ analysis of all identified proteins and differentially expressed phosphoproteins in the DAV‐NR and DAV‐CR groups. E) Functional STRING network of significantly regulated phosphoproteins in patients with DAV‐NR, generated by string APP. Clusters were generated using MCL clusters. F) PCA of differential phosphoproteins between the C (DAV‐CR) and D (DAV‐NR) groups. Different colors indicate different groups (red, DAV‐CR; cyan, DAV‐NR). The ellipse represents an “error ellipse” with a confidence level of 0.95. G) Kinase co‐expression analysis of differentially phosphorylated proteins according to the piNET analysis. H) Predicted top ten enriched kinases based on KSEA analysis of differentially phosphorylated proteins. I, J) Predicted top ten enriched kinases (I) and kinase‐kinase networks (J) based on KEA3 analysis of differentially phosphorylated proteins. K) Apoptosis analysis after 48 h of combination treatment with a‐674563 (AKT1 inhibitor) and/or DAV of THP1 or KG‐1 cells (for both cells: Daunorubicin (D): 5 nm, Cytarabine (A): 100 nm, and Venetoclax (V): 50 nm; a‐674563: THP1 (1 µM) KG‐1 (0.5 µm)) (n = 3 replicates per sample). L) Apoptosis analysis after 48 h of combination treatment with a‐674563 (1 µm) and/or DAV (D: 5 nm, A: 100 nm, and V: 50 nm) in AML specimens (n = 4). The percentage of apoptotic cells was determined by annexin V staining. M) Cell viability analysis after 48 h of combination treatment with a‐674563 and/or DAV in two AML specimens exhibiting clinical resistance to DAV treatment (n = 3 replicates per sample). Error bars represent the SEM.

References

    1. Estey E., N. Engl. J. Med. 2016, 375, 2094. - PubMed
    1. Dombret H., Gardin C., Blood 2016, 127, 53. - PMC - PubMed
    1. Jaramillo S., Schlenk R. F., Haematologica 2023, 108, 342. - PMC - PubMed
    1. Burnett A. K., Russell N. H., Hills R. K., Kell J., Cavenagh J., Kjeldsen L., Mcmullin M.‐F., Cahalin P., Dennis M., Friis L., Thomas I. F., Milligan D., Clark R. E., Blood 2015, 125, 3878. - PMC - PubMed
    1. Norsworthy K. J., Luo L., Hsu V., Gudi R., Dorff S. E., Przepiorka D., Deisseroth A., Shen Y.‐L., Sheth C. M., Charlab R., Williams G. M., Goldberg K. B., Farrell A. T., Pazdur R., Clin. Cancer Res. 2019, 25, 3205. - PubMed

MeSH terms