Single-cell RNA landscape of osteoimmune microenvironment in osteoporotic vertebral compression fracture and Kümmell's disease
- PMID: 38161331
- PMCID: PMC10755405
- DOI: 10.3389/fcell.2023.1276098
Single-cell RNA landscape of osteoimmune microenvironment in osteoporotic vertebral compression fracture and Kümmell's disease
Abstract
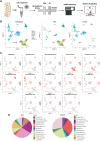
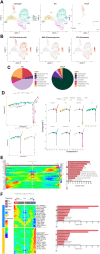
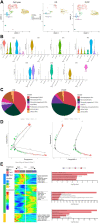
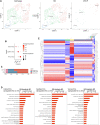
Background: Single-cell RNA sequencing (scRNA-seq) enables specific analysis of cell populations at single-cell resolution; however, there is still a lack of single-cell-level studies to characterize the dynamic and complex interactions between osteoporotic vertebral compression fractures (OVCFs) and Kümmell's disease (KD) in the osteoimmune microenvironment. In this study, we used scRNA-seq analysis to investigate the osteoimmune microenvironment and cellular composition in OVCFs and KD. Methods: ScRNA-seq was used to perform analysis of fractured vertebral bone tissues from one OVCF and one KD patients, and a total of 8,741 single cells were captured for single-cell transcriptomic analysis. The cellularity of human vertebral bone tissue was further analyzed using uniform manifold approximation and projection. Pseudo-time analysis and gene enrichment analysis revealed the biological function of cell fate and its counterparts. CellphoneDB was used to identify the interactions between bone cells and immune cells in the osteoimmune microenvironment of human vertebral bone tissue and their potential functions. Results: A cellular profile of the osteoimmune microenvironment of human vertebral bone tissue was established, including mesenchymal stem cells (MSCs), pericytes, myofibroblasts, fibroblasts, chondrocytes, endothelial cells (ECs), granulocytes, monocytes, T cells, B cells, plasma cells, mast cells, and early erythrocytes. MSCs play an immunoregulatory function and mediate osteogenic differentiation and cell proliferation. The differentiation trajectory of osteoclasts in human vertebral bone tissue was also revealed. In addition, ECs actively participate in inflammatory infiltration and coupling with bone cells. T and B cells actively participate in regulating bone homeostasis. Finally, by identifying the interaction of ligand-receptor pairs, we found that immune cells and osteoclasts have bidirectional regulatory characteristics, have the effects of regulating bone resorption by osteoclasts and promoting bone formation, and are essential for bone homeostasis. It is also highlighted that CD8-TEM cells and osteoclasts might crosstalk via CD160-TNFRSF14 ligand-receptor interaction. Conclusion: Our analysis reveals a differential landscape of molecular pathways, population composition, and cell-cell interactions during OVCF development into KD. OVCFs exhibit a higher osteogenic differentiation capacity, owing to abundant immune cells. Conversely, KD results in greater bone resorption than bone formation due to depletion of MSCs and a relatively suppressed immune system, and this immune imbalance eventually leads to vertebral avascular necrosis. The site of action between immune cells and osteoclasts is expected to be a new therapeutic target, and these results may accelerate mechanistic and functional studies of osteoimmune cell types and specific gene action in vertebral avascular necrosis and pathological bone loss diseases, paving the way for drug discovery.
Keywords: Kümmell’s disease; osteoimmunology; osteoporosis; osteoporotic vertebral compression fracture; single-cell RNA sequencing.
Copyright © 2023 Xu, Huang, Li, Dai, Wu, Wang, Yao, Luo, Liu, Yang, Feng, Miao, Xu and Ye.
Conflict of interest statement
The authors declare that the research was conducted in the absence of any commercial or financial relationships that could be construed as a potential conflict of interest. The handling editor XF declared a shared affiliation with the author JX at the time of review. The authors declare that they were editorial board members of Frontiers, at the time of submission. This had no impact on the peer review process and the final decision.
Figures
Similar articles
-
Expression and significance of cytokines in peripheral blood and bone microenvironment in Kummell's disease, osteoporotic vertebral compression fractures and nonosteoporotic patients.BMC Musculoskelet Disord. 2025 Mar 10;26(1):232. doi: 10.1186/s12891-025-08472-8. BMC Musculoskelet Disord. 2025. PMID: 40065254 Free PMC article.
-
Single-cell RNA landscape of the osteoimmunology microenvironment in periodontitis.Theranostics. 2022 Jan 1;12(3):1074-1096. doi: 10.7150/thno.65694. eCollection 2022. Theranostics. 2022. PMID: 35154475 Free PMC article.
-
Pathogenesis of the intravertebral vacuum of Kümmell's disease.Exp Ther Med. 2016 Aug;12(2):879-882. doi: 10.3892/etm.2016.3369. Epub 2016 May 19. Exp Ther Med. 2016. PMID: 27446290 Free PMC article.
-
Kummell's Disease is Becoming Increasingly Important in an Aging Society: A Review.Korean J Neurotrauma. 2023 Mar 22;19(1):32-41. doi: 10.13004/kjnt.2023.19.e13. eCollection 2023 Mar. Korean J Neurotrauma. 2023. PMID: 37051029 Free PMC article. Review.
-
Delayed post-traumatic osteonecrosis of a vertebral body (Kummell's disease).Acta Orthop Belg. 2002 Feb;68(1):13-9. Acta Orthop Belg. 2002. PMID: 11915453 Review.
Cited by
-
Multi-omics in exploring the pathophysiology of diabetic retinopathy.Front Cell Dev Biol. 2024 Dec 11;12:1500474. doi: 10.3389/fcell.2024.1500474. eCollection 2024. Front Cell Dev Biol. 2024. PMID: 39723239 Free PMC article. Review.
-
Single-cell transcriptomic landscape reveals the role of intermediate monocytes in aneurysmal subarachnoid hemorrhage.Front Cell Dev Biol. 2024 Sep 10;12:1401573. doi: 10.3389/fcell.2024.1401573. eCollection 2024. Front Cell Dev Biol. 2024. PMID: 39318997 Free PMC article.
-
Exploring the Association Between Immune Cell Phenotypes and Osteoporosis Mediated by Inflammatory Cytokines: Insights from GWAS and Single-Cell Transcriptomics.Immunotargets Ther. 2025 Mar 17;14:227-246. doi: 10.2147/ITT.S510102. eCollection 2025. Immunotargets Ther. 2025. PMID: 40125424 Free PMC article.
-
Predictive factors associated with the onset of Kummell's disease.Eur Spine J. 2025 May 1. doi: 10.1007/s00586-025-08833-w. Online ahead of print. Eur Spine J. 2025. PMID: 40312461
-
From Genomics to Metabolomics: Molecular Insights into Osteoporosis for Enhanced Diagnostic and Therapeutic Approaches.Biomedicines. 2024 Oct 18;12(10):2389. doi: 10.3390/biomedicines12102389. Biomedicines. 2024. PMID: 39457701 Free PMC article. Review.
References
-
- Adamska O., Modzelewski K., Stolarczyk A., Kseniuk J. (2021). Is kummell's disease a misdiagnosed and/or an underreported complication of osteoporotic vertebral compression fractures? A pattern of the condition and available treatment modalities. J. Clin. Med. 10 (12), 2584. 10.3390/jcm10122584 - DOI - PMC - PubMed
LinkOut - more resources
Full Text Sources
Molecular Biology Databases
Research Materials

