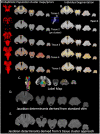
Mapping internal brainstem structures using T1 and T2 weighted 3T images
- PMID: 38161488
- PMCID: PMC10755028
- DOI: 10.3389/fnimg.2023.1324107
Mapping internal brainstem structures using T1 and T2 weighted 3T images
Abstract
Background: Many neurodegenerative diseases affect the brainstem and often do so in an early stage. The overall goal of this project was (a) to develop a method to segment internal brainstem structures from T1 and T2 weighted sequences by taking advantage of the superior myelin contrast of the T1/T2 ratio image (RATIO) and (b) to test if this approach provides biological meaningful information by investigating the effects of aging on different brainstem gray matter structures.
Methods: 675 T1 and T2 weighted images were obtained from the Human Connectome Project Aging. The intensities of the T1 and T2 images were re-scaled and RATIO images calculated. The brainstem was isolated and k-means clustering used to identify five intensity clusters. Non-linear diffeomorphic mapping was used to warp the five intensity clusters in subject space into a common space to generate probabilistic group averages/priors that were used to inform the final probabilistic segmentations at the single subject level. The five clusters corresponded to five brainstem tissue types (two gray matters, two mixed gray/white, and 1 csf/tissue partial volume).
Results: These cluster maps were used to calculate Jacobian determinant maps and the mean Jacobians of 48 brainstem gray matter structures extracted. Significant linear or quadratic age effects were found for all but five structures.
Conclusions: These findings suggest that it is possible to obtain a biologically meaningful segmentation of internal brainstem structures from T1 and T2 weighted sequences using a fully automated segmentation procedure.
Keywords: T1; T2; aging; brainstem; internal structures; segmentation.
Copyright © 2023 Mueller.
Conflict of interest statement
The author declares that the research was conducted in the absence of any commercial or financial relationships that could be construed as a potential conflict of interest.
Figures


Similar articles
-
Mapping internal brainstem structures using MP2RAGE derived T1 weighted and T1 relaxation images at 3 and 7 T.Hum Brain Mapp. 2020 Jun 1;41(8):2173-2186. doi: 10.1002/hbm.24938. Epub 2020 Jan 23. Hum Brain Mapp. 2020. PMID: 31971322 Free PMC article.
-
A reliable spatially normalized template of the human spinal cord--Applications to automated white matter/gray matter segmentation and tensor-based morphometry (TBM) mapping of gray matter alterations occurring with age.Neuroimage. 2015 Aug 15;117:20-8. doi: 10.1016/j.neuroimage.2015.05.034. Epub 2015 May 21. Neuroimage. 2015. PMID: 26003856
-
Human brain atlas for automated region of interest selection in quantitative susceptibility mapping: application to determine iron content in deep gray matter structures.Neuroimage. 2013 Nov 15;82:449-69. doi: 10.1016/j.neuroimage.2013.05.127. Epub 2013 Jun 12. Neuroimage. 2013. PMID: 23769915 Free PMC article.
-
Evaluation of multimodal segmentation based on 3D T1-, T2- and FLAIR-weighted images - the difficulty of choosing.Neuroimage. 2018 Apr 15;170:210-221. doi: 10.1016/j.neuroimage.2017.02.016. Epub 2017 Feb 7. Neuroimage. 2018. PMID: 28188918
-
Magnetic resonance imaging of thymic epithelial tumors.Crit Rev Diagn Imaging. 1996 Aug;37(3):191-259. Crit Rev Diagn Imaging. 1996. PMID: 8872410 Review.
Cited by
-
The imprint of dissociative seizures on the brain.Neuroimage Clin. 2024;43:103664. doi: 10.1016/j.nicl.2024.103664. Epub 2024 Aug 29. Neuroimage Clin. 2024. PMID: 39226702 Free PMC article.

