Review
. 2023 Dec 5:23:100894.
doi: 10.1016/j.mtbio.2023.100894. eCollection 2023 Dec.

Melanin/melanin-like nanoparticles: As a naturally active platform for imaging-guided disease therapy

Affiliations
Review

Melanin/melanin-like nanoparticles: As a naturally active platform for imaging-guided disease therapy

Jinghua Sun et al. Mater Today Bio. .

Abstract

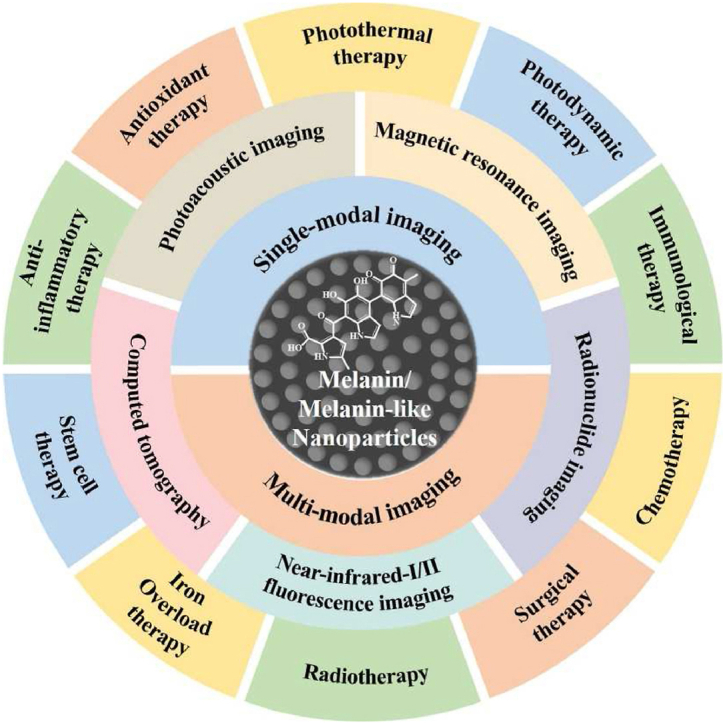
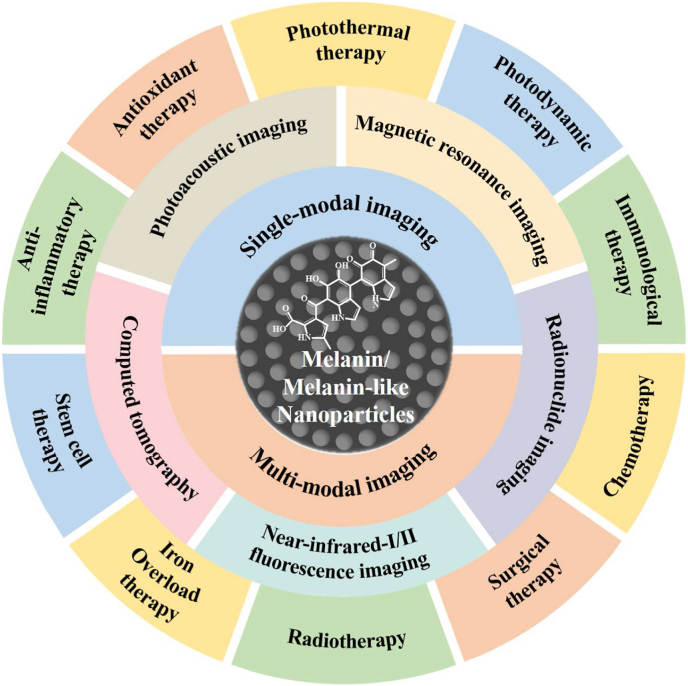
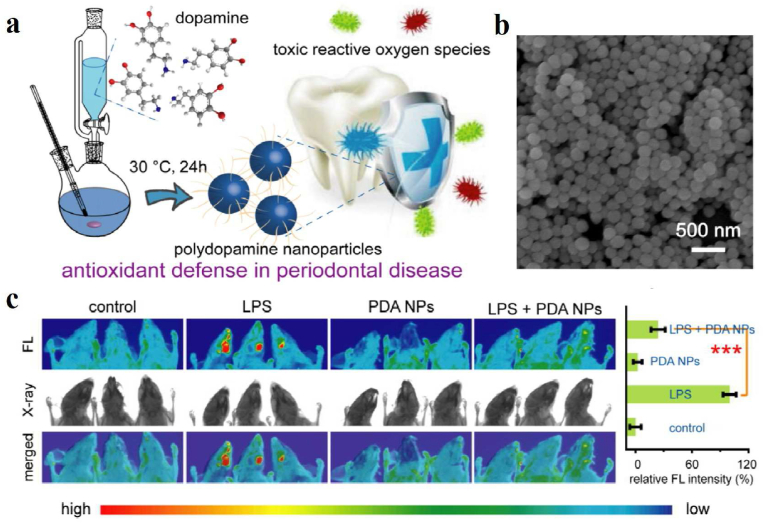
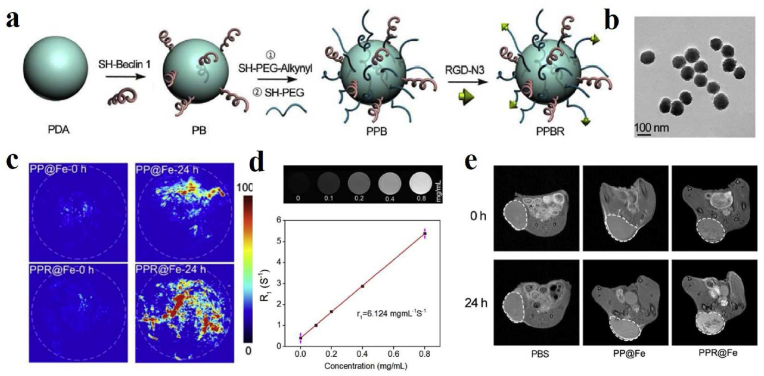
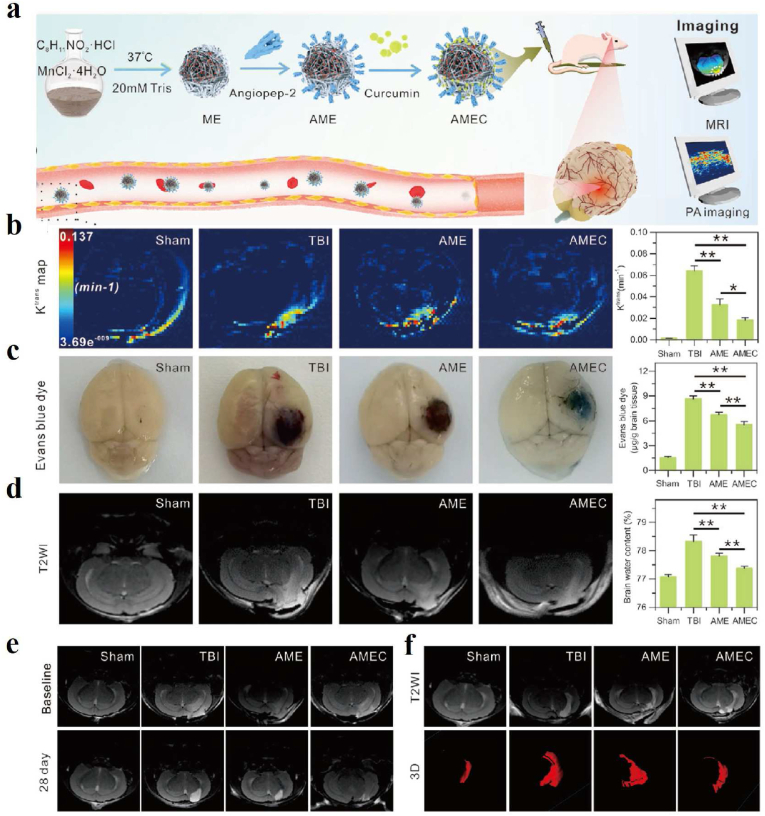
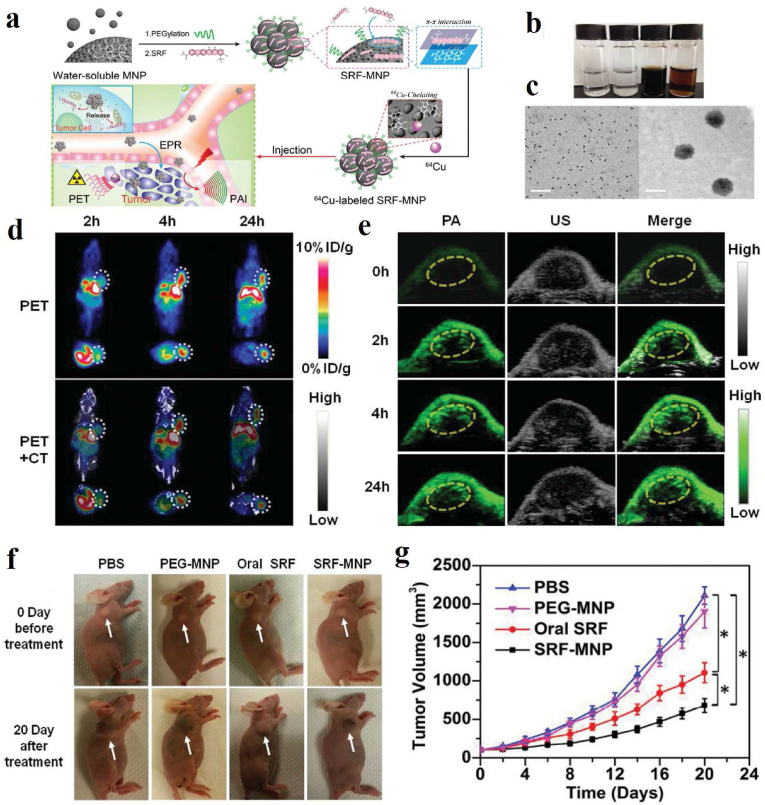
The development of biocompatible and efficient nanoplatforms that combine diagnostic and therapeutic functions is of great importance for precise disease treatment. Melanin, an endogenous biopolymer present in living organisms, has attracted increasing attention as a versatile bioinspired functional platform owing to its unique physicochemical properties (e.g., high biocompatibility, strong chelation of metal ions, broadband light absorption, high drug binding properties) and inherent antioxidant, photoprotective, anti-inflammatory, and anti-tumor effects. In this review, the fundamental physicochemical properties and preparation methods of natural melanin and melanin-like nanoparticles were outlined. A systematical description of the recent progress of melanin and melanin-like nanoparticles in single, dual-, and tri-multimodal imaging-guided the visual administration and treatment of osteoarthritis, acute liver injury, acute kidney injury, acute lung injury, brain injury, periodontitis, iron overload, etc. Was then given. Finally, it concluded with a reasoned discussion of current challenges toward clinical translation and future striving directions. Therefore, this comprehensive review provides insight into the current status of melanin and melanin-like nanoparticles research and is expected to optimize the design of novel melanin-based therapeutic platforms and further clinical translation.

Keywords: Imaging-guided; Melanin-like nanoparticles; Therapeutic platform; melanin nanoparticles.


Conflict of interest statement

We declare that we do not have any commercial or associative interest that represents a conflict of interest in connection with the work submitted.

Figures

Image 1
Graphical abstract
Fig. 1
Fig. 1
Schematic illustration of the main imaging-guided disease therapy based on melanin/melanin-like nanoparticles.
Fig. 2
Fig. 2
Case 1: (a) Schematic illustration of the hierarchical micro-/nanostructures from human hair. (b) Transmission electron microscopy (TEM) and scanning electron microscopy (SEM) images of HMP and HNP derived from hair [60]. Reproduced with permission. Copyright 2018, Wiley-VCH. Case 2: (c) Schematic of a microneedle patch loaded with melanin nanoparticles for the treatment of subcutaneous wounds after melanoma surgery. (d) Schematic synthesis process of CINP@SiO2. TEM images of CINP, CINP@SiO2, and magnified TEM image of the white dotted box in CINP@SiO2 [63]. Copyright 2022, Wiley-VCH.
Fig. 3
Fig. 3
(a) Schematic illustration of erythrocyte-cancer cell hybrid membrane-melanin (Melanin@RBC-M) nanoparticles with long circulation and homotypic targeting for efficient PTT in tumors. (b) PA images of tumor regions at different time points before (Pre) and after intravenous injection of 0.1 mg of Melanin@RBC-M in MCF-7 tumor-bearing mice. Blue dashed lines point out the tumor regions. Tumor growth curves (c) and excised tumor photos (d) of MCF-7 tumor-bearing mice after PTT treatment at 4 h after intravenous injection of Melanin@RBC-M with different membrane protein weight ratios of RBC to MCF-7 (1:0, 2:1, 1:1, 1:2, 0:1, and 0:0) [97]. Copyright 2019, Elsevier. (For interpretation of the references to color in this figure legend, the reader is referred to the Web version of this article.)
Fig. 4
Fig. 4
(a) Schematic illustration of Dex-pPADN for treatment of osteoarthritis. (b) TEM image and hydrodynamic diameter distribution of Dex-pPADN at the pPAD/Dex ratio of 10:1. (c) PA signal intensity and images of Dex-pPADN after incubation with different concentrations of ONOO (G1: 0 mM, G2: 5 mM, G3: 10 mM, G4: 20 mM, G5: 40 mM). (d) Representative PA images of a healthy articular cavity or an arthritic articular cavity with different treatments at 0, 1, and 2 h. (e) PA signal intensity of Dex-pPADN at various time points in different groups. (f) PA signal intensity of Dex-pPADN at 2 h in different groups. (g) PA spectra of Dex-pPADN at 2 h in different groups [106]. Copyright 2021, Wiley-VCH.
Fig. 5
Fig. 5
(a) Schematic of GMP nanoparticle preparation and its PAI-guided antioxidant, anti-apoptotic and anti-inflammatory synergistic treatment of rhabdomyolysis-induced AKI. (b) PA images of AKI mice at different time points after intravenous injection of GMP. (c) Distribution of SaO2 and HbT in normal, AKI and GMP-treated groups [108]. Copyright 2022, Elsevier.
Fig. 6
Fig. 6
(a) Schematic illustration of manganese-eumelanin nanocomposites preparation by one-pot method and their T1-T2 bimodal MRI and PAI-guided tumor PTT. (b) PA images of MnEMNPs with different concentrations under 800 nm and their signal intensities as a function of concentration. (c) T1WI and T2WI MR images of MnEMNPs at different Mn ion concentrations and different field strengths. (d) Linear relationship between Mn ion concentrations and r1 relaxation rate in MnEMNPs at different field strengths. (e) Linear relationship between Mn ion concentration and r2 relaxation rate in MnEMNPs at different field strengths [138]. Copyright 2018, Wiley-VCH.
Fig. 7
Fig. 7
(a) Schematic representation of Fe-PDA-mPEG NPs synthesis, MRI-mediated enhanced tumor PTT, and triggered anti-tumor immune activation in vivo. (b) T1WI images of Fe-PDA in water with different iron ion contents. (c) Linear relationship between Fe ion concentrations and r1 relaxation rate. (d) T1WI images of tumor-bearing mice in vivo before and 6 h after intravenous injection of Fe-PDAmPEG NPs [114]. Copyright 2022, American Chemical Society.
Fig. 8
Fig. 8
(a) Schematic illustration of the synthesis of PDA NPs and their application to alleviate periodontal disease by scavenging toxic reactive oxygen radicals. (b) SEM image of synthesized PDA NPs. (c) In vivo fluorescence imaging was utilized to examine the ability of PDA NPs to scavenge ROS in terms of relative quantitative fluorescence intensity in normal mice and LPS-induced periodontal disease mice after 3 d of different treatments [144]. Copyright 2018, American Chemical Society.
Fig. 9
Fig. 9
(a) Schematic of the synthesis of PPBR nanoparticles. (b) TEM image of PPBR with the size of about 100 nm. (c) PA images of tumors before and 24 h after intravenous injection of PP@Fe and PPR@Fe. The white dashed circle represents the tumor region. (d) MRI images of different concentrations of PP@Fe in deionized water, relaxation rate R1 as a function of the concentration of iron ions in PP@Fe. The relaxation value r1 is derived from the slope of the curve. (e) T1WI images of tumors before and 24 h after intravenous injection of PBS, PP@Fe, and PPR@Fe. White dashed circle outlines the tumor sites [151]. Copyright 2019, Elsevier.
Fig. 10
Fig. 10
(a) Schematic of the synthesis process of AMEC with T1-T2 MR and PA imaging capabilities and its use as a potential tool for TBI treatment. (b) Representative Ktrans map derived from DCE-MR imaging and quantitative analysis of the brain one day after treatment. (c) Representative EB-staining images and quantitative analysis in the brain one day after treatment. (d) Representative T2WI MR images and quantitative analysis of brain edema one day after treatment. (e) Representative T2WI images of the lesion volumes before and 28 days after treatment. (f) Representative T2WI images of ventricular volumes before and 28 days post-treatment [154]. Copyright 2022, Wiley-VCH.
Fig. 11
Fig. 11
(a) Schematic illustration of the preparation of 64Cu-labeled SRF-MNP nanoparticles and PET and PAI dual-modal imaging-guided therapy of HepG2 tumor in vivo. (b) photographs of PBS, SRF precipitated in PBS, PEG-MNP dispersed in PBS, and SRF-MNP dispersed in PBS. (c) TEM images of PEG-MNP (left) and SRF-MNP (right), scale bar = 50 nm. (d) PET and PET/CT images after tail vein injection of 64Cu-labled SRF-MNP nanoparticles at 2 h, 4 h and 24 h. White dotted line outlines the tumor sites. (e) PA images of tumor-bearing mice before and after tail vein injection of SRF-MNP nanoparticles at 2 h, 4 h and 24 h. Yellow dotted line envelops the tumor region. (f) Representative photographs of HepG2 tumor mice after 20 days of different treatments. (g) Tumor growth curves of HepG2 tumor mice after 20 days of different treatments [28]. Copyright 2015, Wiley-VCH. (For interpretation of the references to color in this figure legend, the reader is referred to the Web version of this article.)
Fig. 12
Fig. 12
(a) MMPP nanoparticle preparation and its application in PET/MR dual-modality imaging-guide antioxidant treatment of AKI. (b) T1 relaxation rate curves at 4.7 T of different concentrations of MMPP and Gd-BOPTA. (c) Coronal and axial MRI images of MMPP nanoparticles in AKI mice before and after injection at different time points. Kidneys are circled in yellow dashed lines. (d) PET images of AKI mice injected with 89Zr-MMPP at different time points. (e) Distribution of 89Zr-MMPP uptake in blood, liver, spleen, kidney and muscle of AKI mice at different time points after injection [158]. Copyright 2019, Wiley-VCH. (For interpretation of the references to color in this figure legend, the reader is referred to the Web version of this article.)
Fig. 13
Fig. 13
CH-4T/SLB-MSN-Mdot/64Cu2+ nanoprobe construction and its tumor detection by PET imaging and NIR-II fluorescence imaging-guided surgery [159]. Copyright 2019, Wiley-VCH.
Fig. 14
Fig. 14
(a) Preparation of CaCO3-PDA-PEG hollow nanoparticles. (b) TEM images of nanoparticles prepared with different feed ratios of dopamine and CaCl2. (c) TEM image of CaCO3-PDA hollow nanoparticles prepared with 2:150 feed ratio of dopamine and CaCl2. (d) EDS image of CaCO3-PDA hollow nanoparticles showing distribution of N, O and Ca. (e) EDX spectra of CaCO3-PDA hollow nanoparticles. (f) T1WI MR images of 4T1 tumor before and 24 h after CaCO3-PDA(Mn)-PEG injection and intensity analysis of tumor site. (g) PA images of 4T1 tumors before and 24 h after CaCO3-PDA-PEG injection and intensity analysis of tumor areas. (h) In vivo fluorescence imaging of 4T1 tumor-bearing mice injected intravenously with Ce6@CaCO3-PDA-PEG. (i) Circulatory half-life after intravenous injection of Ce6@CaCO3-PDA-PEG. (j) Biodistribution of Ce6@CaCO3-PDA-PEG in 4T1 tumor-bearing mice at different time intervals (12, 24, and 48 h) after intravenous injection of Ce6@CaCO3-PDA-PEG [173]. Copyright 2018, American Chemical Society.
Fig. 15
Fig. 15
(a) Schematic illustration of PMNs–II–813 nanoprobe for PET/MRI/PAI tri-modal imaging-guided RIT and PTT of prostate cancer. (b) PA images of LNCaP and PC-3 tumor after tail vein injection of Mn-PMNs-II for 2 h, 24 h, and 48 h. (c) Small animal PET/CT images of LNCaP tumors in coronal and axial positions obtained 2 h, 6 h, 24 h, and 48 h after tail vein injection of PMNs–II–813. (d) The radioactivity distribution of PET/CT images was assessed by the T/B, T/M, and T/L ratios. (e) PET/MRI images of LNCaP tumors before and after tail vein injection of PMNs–II–813 at 4 h [174]. Copyright 2021, Wiley-VCH.

Similar articles

Cited by

References

    1. Chen Q., et al. Recent advances in different modal imaging-guided photothermal therapy. Biomaterials. 2016;106:144–166. - PubMed
    1. Chetrit M., et al. Imaging-guided therapies for pericardial diseases. JACC Cardiovasc Imaging. 2020;13(6):1422–1437. - PubMed
    1. Xie B., et al. Supramolecular biomaterials for bio-imaging and imaging-guided therapy. Eur. J. Nucl. Med. Mol. Imag. 2022;49(4):1200–1210. - PubMed
    1. Lim E.K., et al. Nanomaterials for theranostics: recent advances and future challenges. Chem Rev. 2015;115(1):327–394. - PubMed
    1. Chen G., et al. Nanochemistry and nanomedicine for nanoparticle-based diagnostics and therapy. Chem Rev. 2016;116(5):2826–2885. - PubMed