

Development of artificial bone graft via in vitro endochondral ossification (ECO) strategy for bone repair
- PMID: 38161510
- PMCID: PMC10755541
- DOI: 10.1016/j.mtbio.2023.100893
Development of artificial bone graft via in vitro endochondral ossification (ECO) strategy for bone repair
Abstract
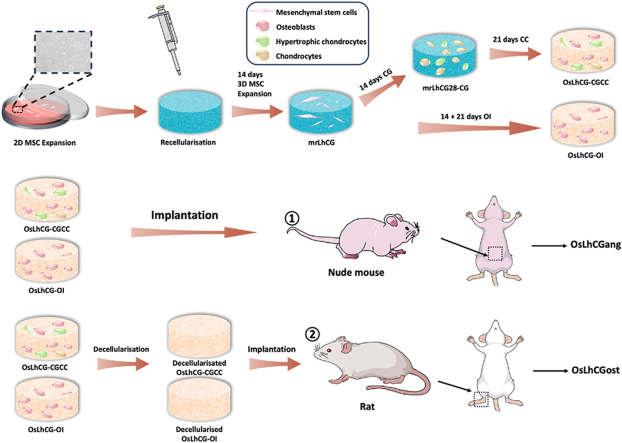
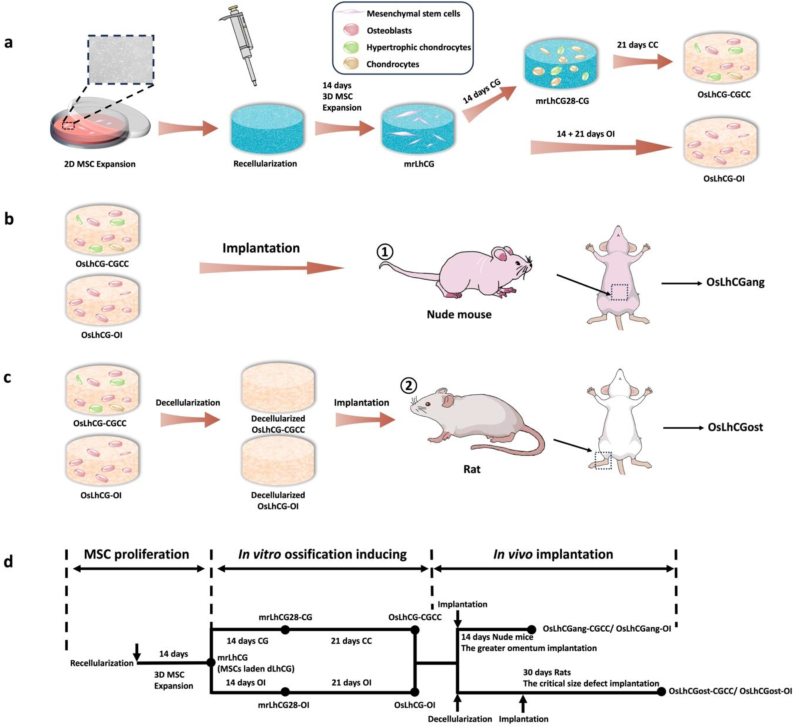
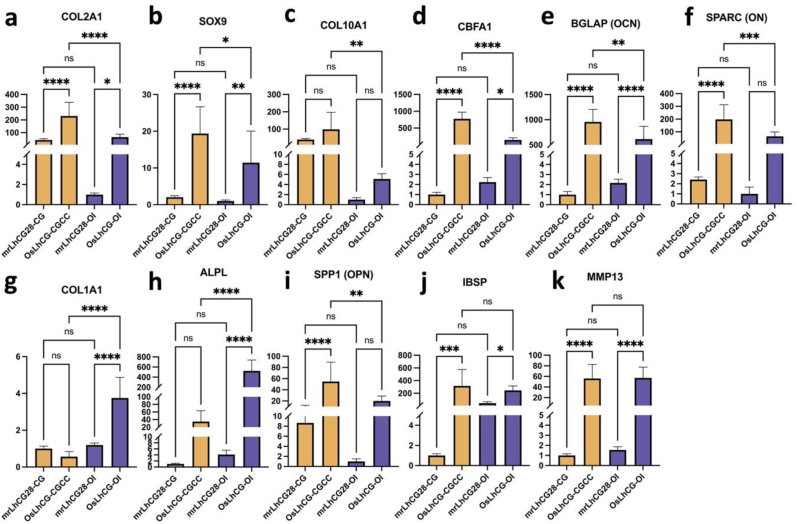
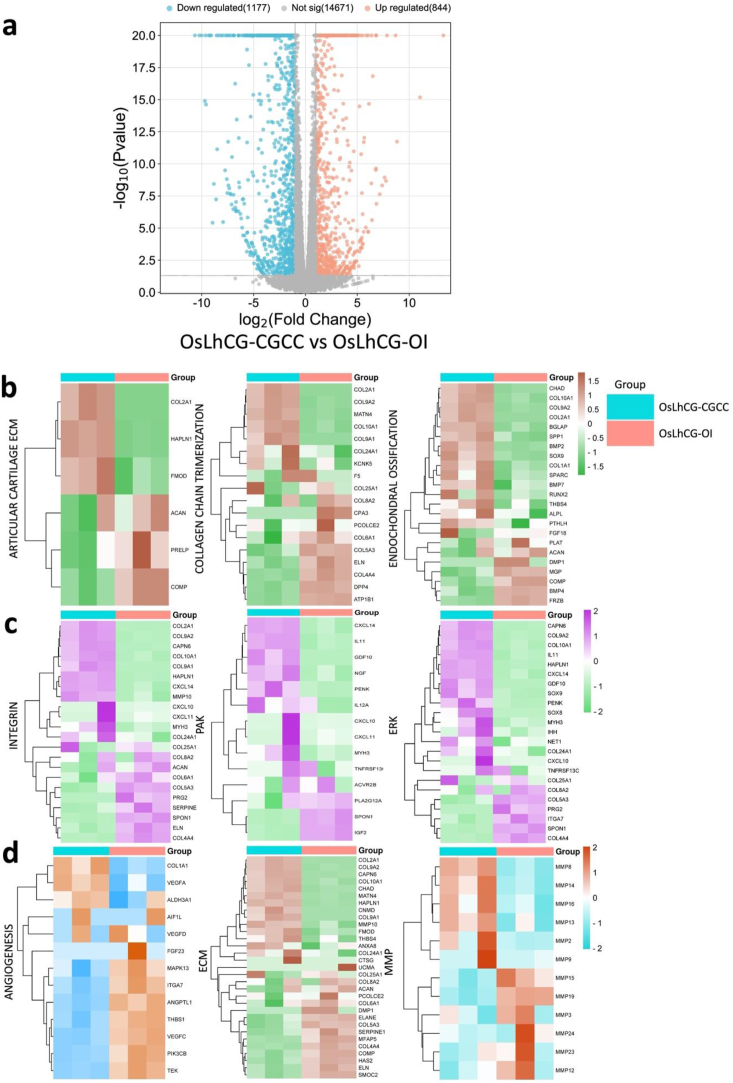
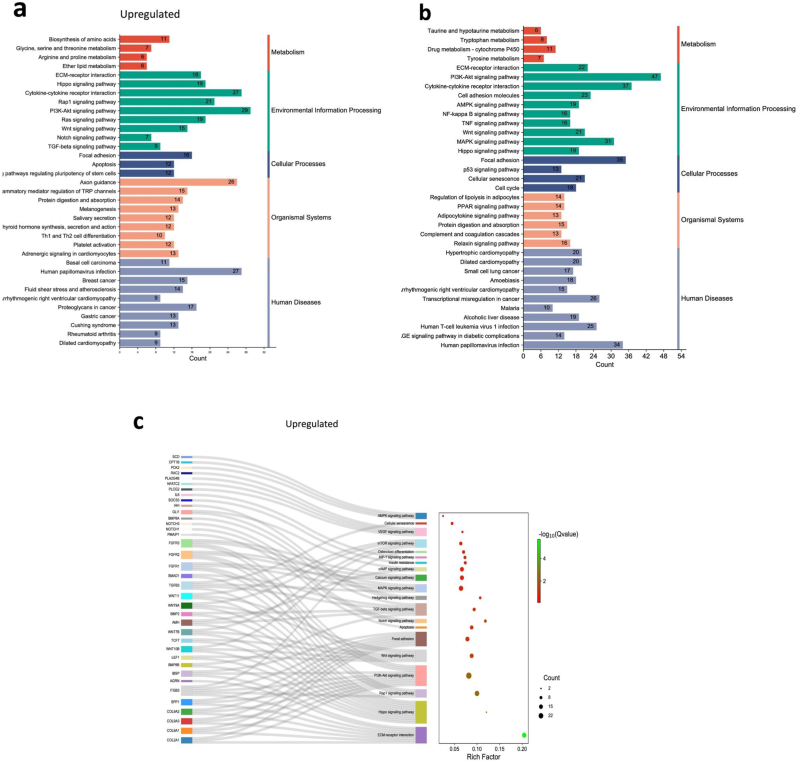
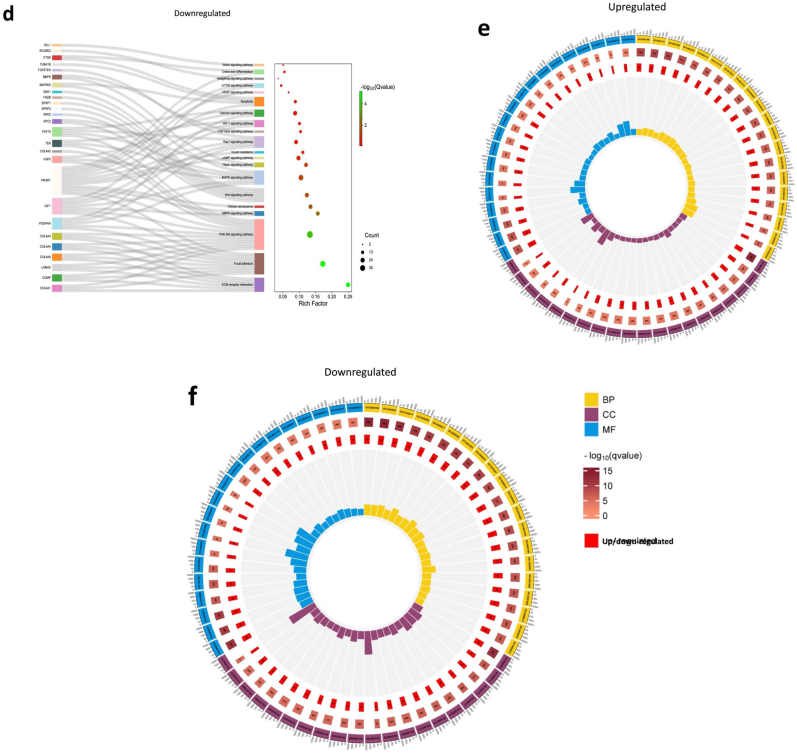
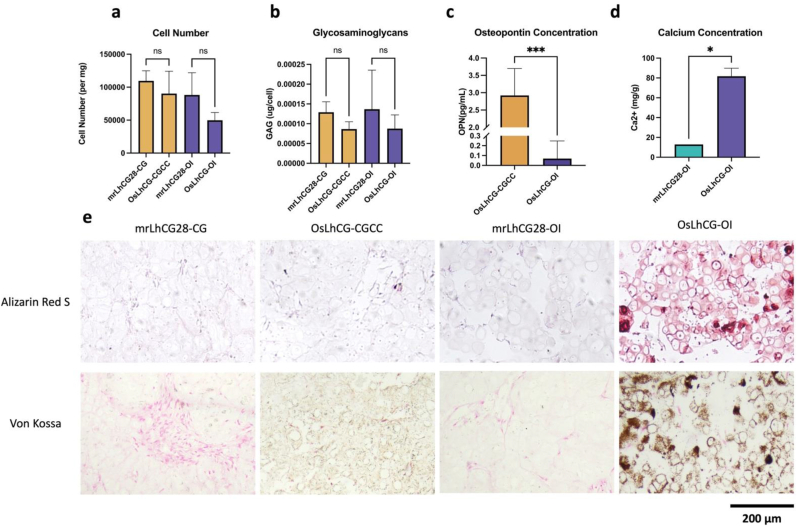
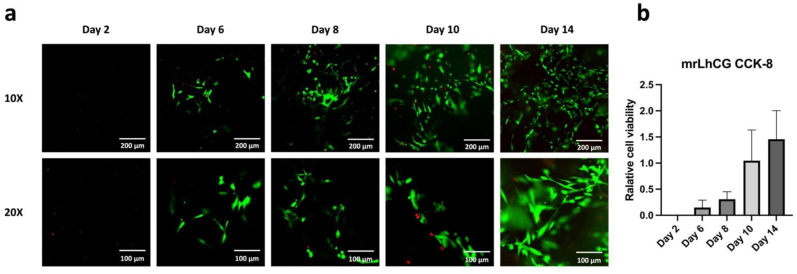
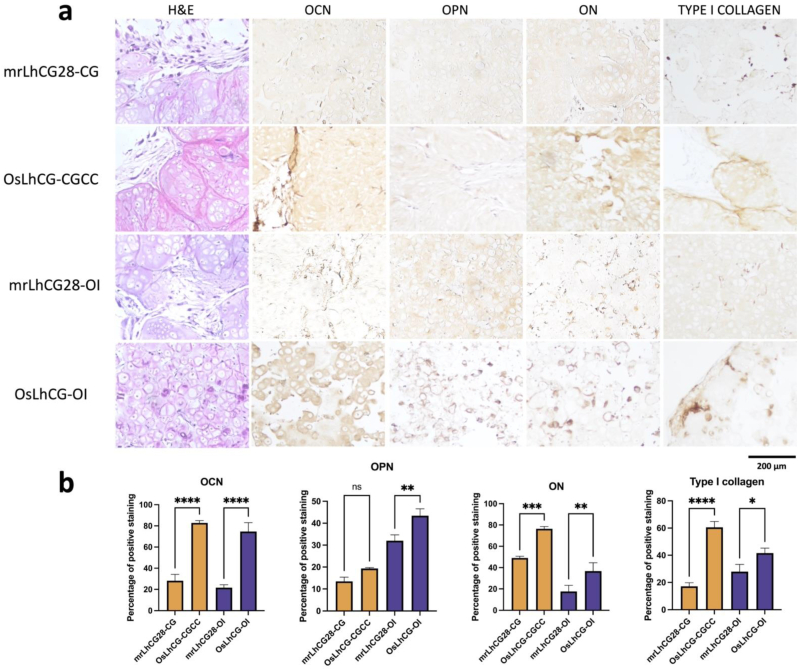
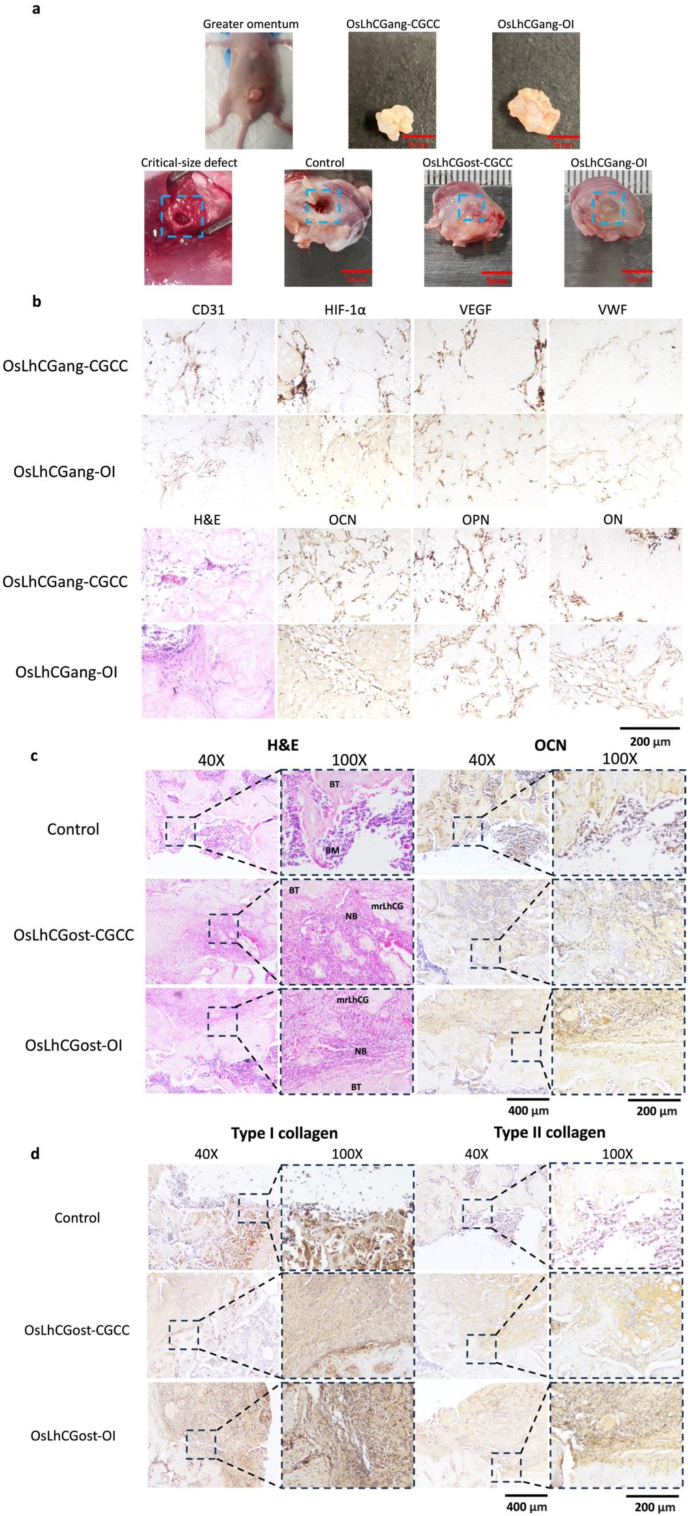
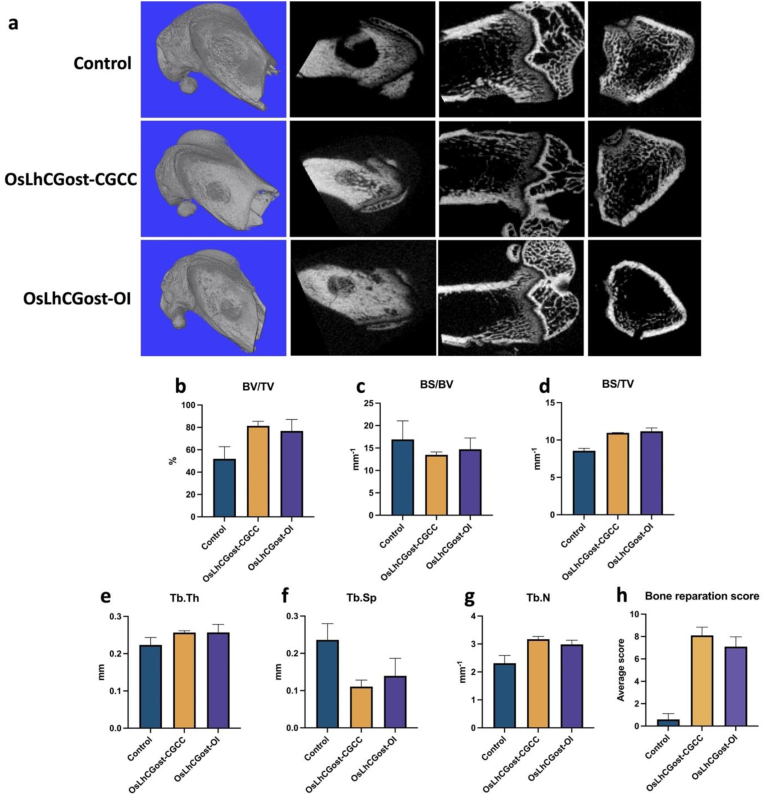
Endochondral ossification (ECO) is a form of bone formation whereby the newly deposited bone replaces the cartilage template. A decellularized artificial cartilage graft (dLhCG), which is composed of hyaline cartilage matrixes, has been developed in our previous study. Herein, the osteogenesis of bone marrow-derived MSCs in the dLhCG through chondrogenic differentiation, chondrocyte hypertrophy, and subsequent transdifferentiation induction has been investigated by simulating the physiological processes of ECO for repairing critical-sized bone defects. The MSCs were recellularized into dLhCGs and subsequently allowed to undergo a 14-day proliferation period (mrLhCG). Following this, the mrLhCG constructs were subjected to two distinct differentiation induction protocols to achieve osteogenic differentiation: chondrogenic medium followed by chondrocytes culture medium with a high concentration of fetal bovine serum (CGCC group) and canonical osteogenesis inducing medium (OI group). The formation of a newly developed artificial bone graft, ossified dLhCG (OsLhCG), as well as its capability of aiding bone defect reconstruction were characterized by in vitro and in vivo trials, such as mRNA sequencing, quantitative real-time PCR (qPCR), immunohistochemistry, the greater omentum implantation in nude mice, and repair for the critical-sized femoral defects in rats. The results reveal that the differentiation induction of MSCs in the CGCC group can realize in vitro ECO through chondrogenic differentiation, hypertrophy, and transdifferentiation, while the MSCs in the OI group, as expected, realize ossification through direct osteogenic differentiation. The angiogenesis and osteogenesis of OsLhCG were proved by being implanted into the greater omentum of nude mice. Besides, the OsLhCG exhibits the capability to achieve the repair of critical-size femoral defects.
Keywords: Biomaterials; Endochondral ossification; Hypertrophic chondrocytes; Regeneration medicine; Scaffold; Tissue engineering; Transdifferentiation.
© 2023 The Author(s).
Conflict of interest statement
The authors declare that they have no known competing financial interests or personal relationships that could have appeared to influence the work reported in this paper.
Figures
Similar articles
-
An Endochondral Ossification-Based Approach to Bone Repair: Chondrogenically Primed Mesenchymal Stem Cell-Laden Scaffolds Support Greater Repair of Critical-Sized Cranial Defects Than Osteogenically Stimulated Constructs In Vivo.Tissue Eng Part A. 2016 Mar;22(5-6):556-67. doi: 10.1089/ten.TEA.2015.0457. Tissue Eng Part A. 2016. PMID: 26896424
-
Suppressing mesenchymal stem cell hypertrophy and endochondral ossification in 3D cartilage regeneration with nanofibrous poly(l-lactic acid) scaffold and matrilin-3.Acta Biomater. 2018 Aug;76:29-38. doi: 10.1016/j.actbio.2018.06.027. Epub 2018 Jun 22. Acta Biomater. 2018. PMID: 29940371 Free PMC article.
-
Fractionated human adipose tissue as a native biomaterial for the generation of a bone organ by endochondral ossification.Acta Biomater. 2018 Sep 1;77:142-154. doi: 10.1016/j.actbio.2018.07.004. Epub 2018 Jul 4. Acta Biomater. 2018. PMID: 30126590
-
Recapitulating endochondral ossification: a promising route to in vivo bone regeneration.J Tissue Eng Regen Med. 2015 Aug;9(8):889-902. doi: 10.1002/term.1918. Epub 2014 Jun 11. J Tissue Eng Regen Med. 2015. PMID: 24916192 Review.
-
Bone defect reconstruction via endochondral ossification: A developmental engineering strategy.J Tissue Eng. 2021 Mar 30;12:20417314211004211. doi: 10.1177/20417314211004211. eCollection 2021 Jan-Dec. J Tissue Eng. 2021. PMID: 33868628 Free PMC article. Review.
Cited by
-
Spatial transcriptomics in bone mechanomics: Exploring the mechanoregulation of fracture healing in the era of spatial omics.Sci Adv. 2025 Jan 3;11(1):eadp8496. doi: 10.1126/sciadv.adp8496. Epub 2025 Jan 1. Sci Adv. 2025. PMID: 39742473 Free PMC article.
-
Lithium-doped calcium silicate cement regulates the immune microenvironment and promotes M2 macrophage polarization for enhancing bone regeneration.J Biol Eng. 2025 Jan 6;19(1):3. doi: 10.1186/s13036-024-00467-8. J Biol Eng. 2025. PMID: 39762916 Free PMC article.
-
In situ implantation of type II collagen-based double-layer scaffolds for Articular Osteochondral Regeneration comprising hyaline cartilage and vascularized subchondral bones.Bioact Mater. 2025 Apr 22;50:364-381. doi: 10.1016/j.bioactmat.2025.04.013. eCollection 2025 Aug. Bioact Mater. 2025. PMID: 40589547 Free PMC article.
References
-
- Ebraheim N.A., Elgafy H., Xu R. Bone-graft harvesting from iliac and fibular donor sites: techniques and complications. JAAOS-J. Am. Acad. Orthopaedic Surgeons. 2001;9(3):210–218. - PubMed
-
- St John T.A., et al. Physical and monetary costs associated with autogenous bone graft harvesting. Am. J. Orthoped. 2003;32(1):18–23. - PubMed
-
- Kronenberg H.M. Developmental regulation of the growth plate. Nature. 2003;423(6937):332–336. - PubMed
-
- Mackie E., et al. Endochondral ossification: how cartilage is converted into bone in the developing skeleton. Int. J. Biochem. Cell Biol. 2008;40(1):46–62. - PubMed
LinkOut - more resources
Full Text Sources
