. 2023 Nov 21;26(12):108498.
doi: 10.1016/j.isci.2023.108498. eCollection 2023 Dec 15.

Simulated vestibular spatial disorientation mouse model under coupled rotation revealing potential involvement of Slc17a6

Affiliations

Simulated vestibular spatial disorientation mouse model under coupled rotation revealing potential involvement of Slc17a6

Tong Chang et al. iScience. .

Abstract

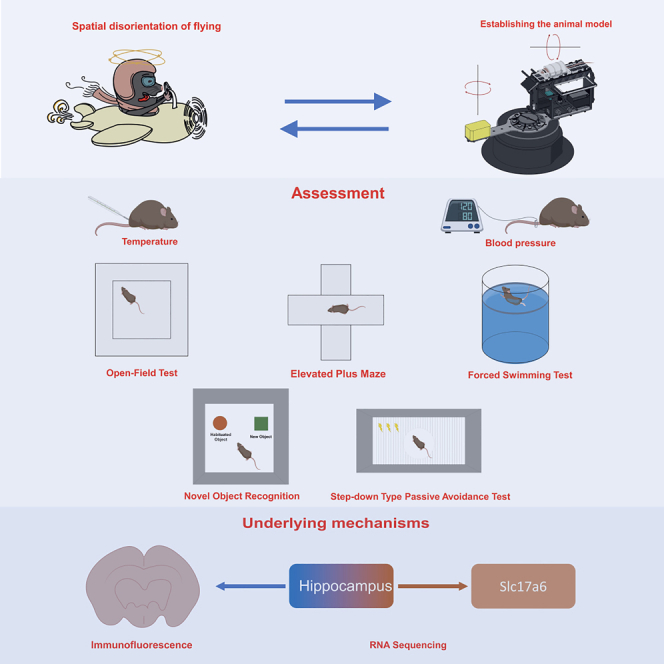
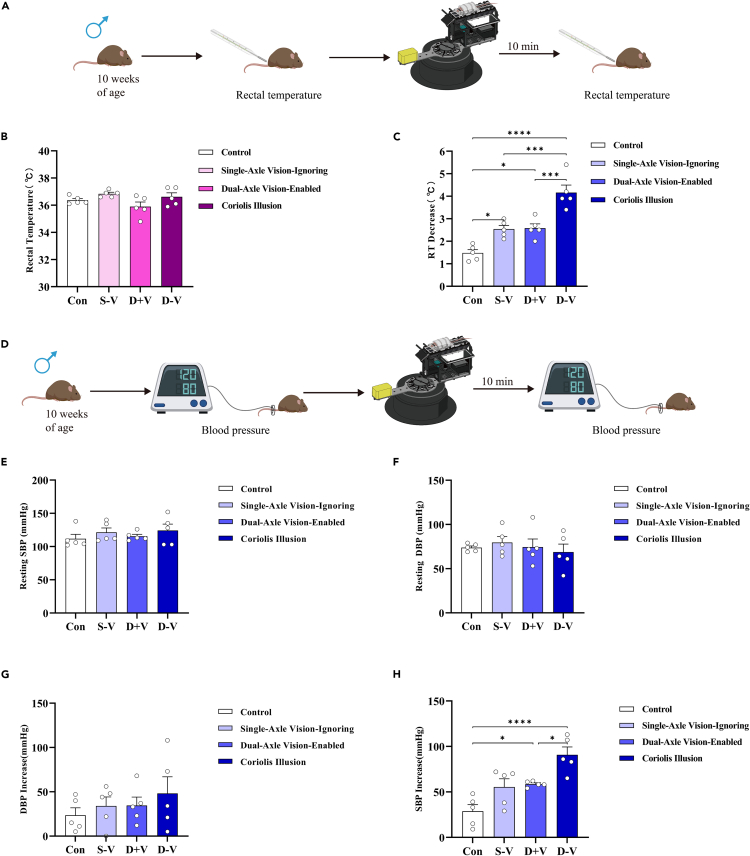
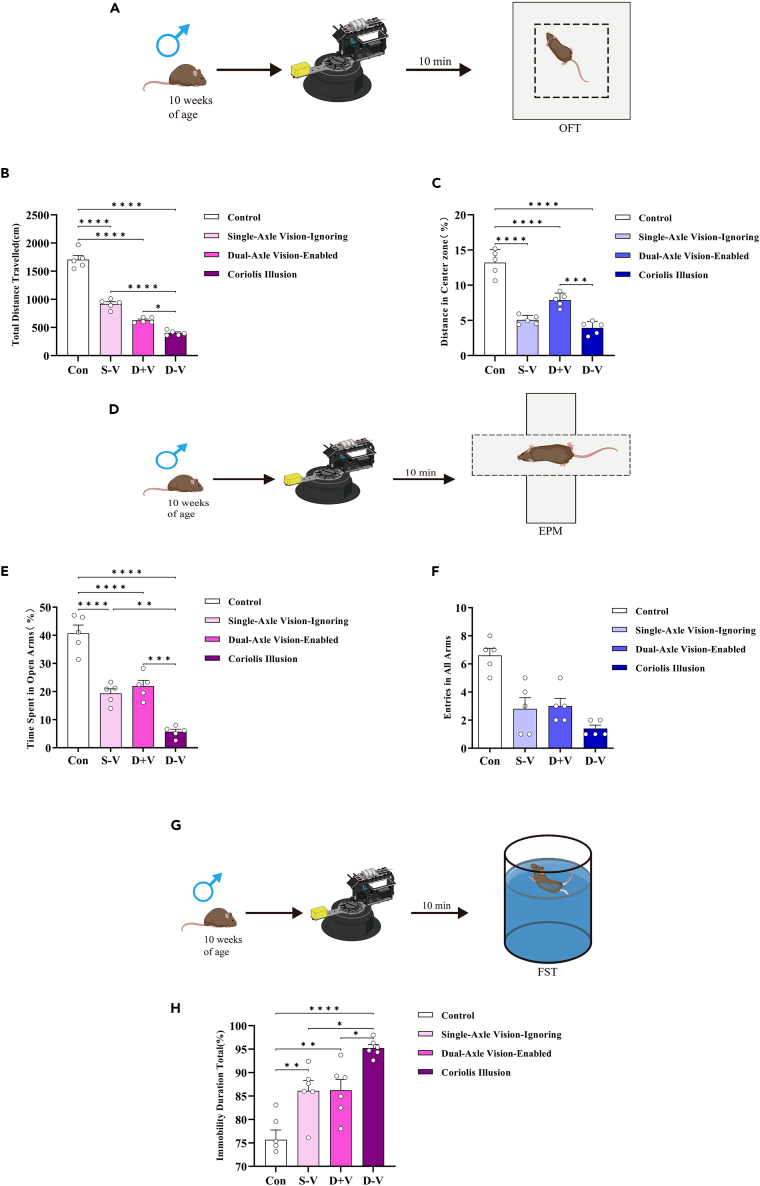
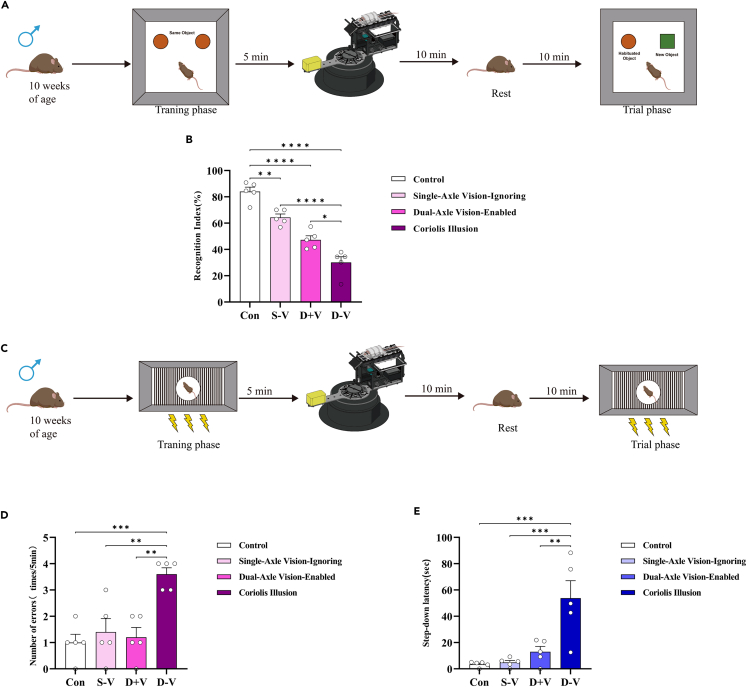
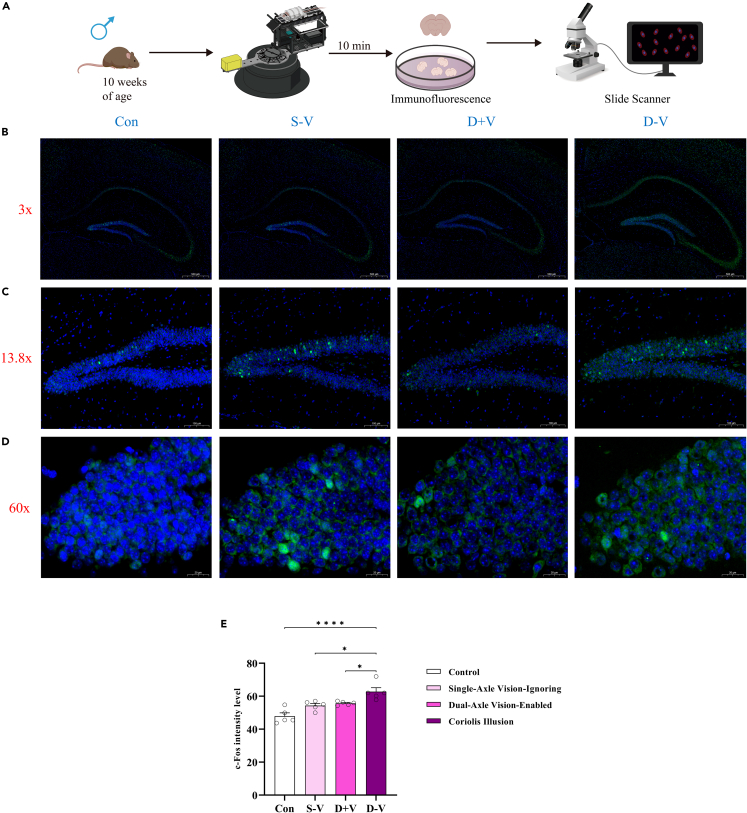
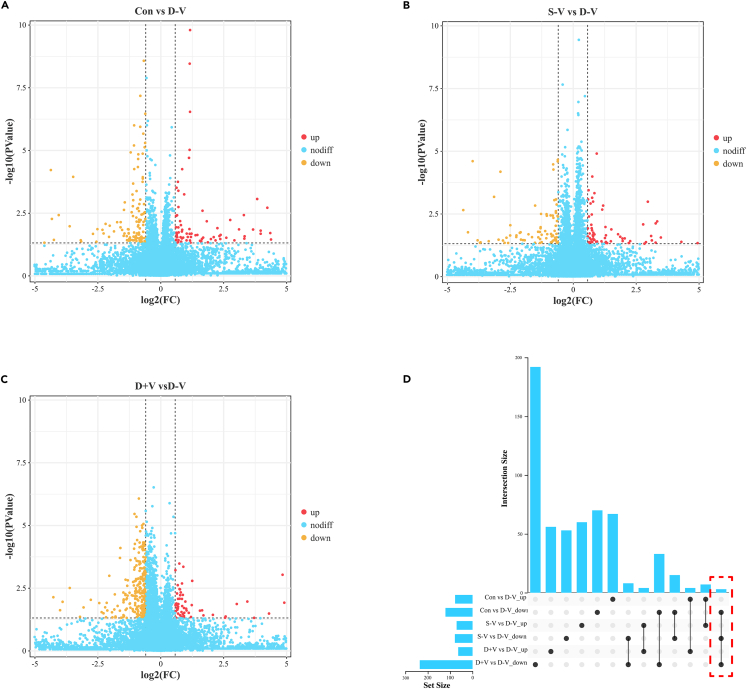
Spatial disorientation (SD) is the main contributor to flight safety risks, but research progress in animals has been limited, impeding a deeper understanding of the underlying mechanisms of SD. This study proposed a method for constructing and evaluating a vestibular SD mouse model, which adopted coupled rotational stimulation with visual occlusion. Physiological parameters were measured alongside behavioral indices to assess the model, and neuronal changes were observed through immunofluorescent staining. The evaluation of the model involved observing decreased colonic temperature and increased arterial blood pressure in mice exposed to SD, along with notable impairments in motor and cognitive function. Our investigation unveiled that vestibular SD stimulation elicited neuronal activation in spatially associated cerebral areas, such as the hippocampus. Furthermore, transcriptomic sequencing and bioinformatics analysis revealed the potential involvement of Slc17a6 in the mechanism of SD. These findings lay a foundation for further investigation into the molecular mechanisms underlying SD.

Keywords: Biological sciences; Natural sciences; Neuroscience; Physiology.


Conflict of interest statement

The authors declare no competing interests.

Figures

None
Graphical abstract
Figure 1
Figure 1
The effect of spatial disorientation on the physiological parameters in mice (A) Experimental procedure. (B) Before the stimulation, there was no significant difference in rectal temperature among the groups. (C) Compared to the control group, the rectal temperature of the mice in each rotating group significantly decreased, with the Coriolis illusion group showing the most significant decrease. (D) Experimental procedure. (E) The baseline resting diastolic blood pressure of the mice before stimulation. (F) The baseline resting systolic blood pressure of the mice before stimulation. (G) The mouse groups did not show a significant difference in diastolic blood pressure changes following stimulation. (H) The systolic blood pressure of two groups of mice subjected to biaxial rotation was significantly elevated compared to that of the control group, with a more pronounced increase in the Coriolis illusion group (n = 5 mice per group). Error bars represent ±standard error of the mean. ∗p < 0.05, ∗∗∗p < 0.001, ∗∗∗∗p < 0.0001. RT, rectal temperature.
Figure 2
Figure 2
Spatial disorientation induces anxiety and depressive-like behaviors in mice (A) Experimental procedure. (B and C) The total distance of activity in the OFT and the proportion of activity in the center area significantly decreased in all rotational groups. The reduction was more significant in the Coriolis illusion group. (D) Experimental procedure. (E) The proportion of open-arm activity in each rotation group was significantly reduced, with the Coriolis illusion group showing a more significant reduction. (F) The groups showed no significant difference in the number of entries into all arms. (G) Experimental procedure. (H) The immobility time increased in all rotational groups, with the Coriolis illusion group showing the most significant increase (n = 5 mice per group). Error bars represent ±standard error of the mean. ∗p < 0.05, ∗∗p < 0.01, ∗∗∗p < 0.001, ∗∗∗∗p < 0.0001. OFT, open-field test; EPM, elevated plus maze; FST, forced swimming test.
Figure 3
Figure 3
Spatial disorientation impairs cognitive and memory abilities in mice (A) Experimental procedure. (B) The RI of all rotation groups decreased significantly compared with the control group, while the Coriolis illusion group showed a significant decrease compared with the other rotation groups. (C) Experimental procedure. (D and E) The number of errors and latency period in the Coriolis illusion group significantly increased compared to the other groups (n = 5 mice per group). Error bars represent ±SEM. ∗p < 0.05, ∗∗p < 0.01, ∗∗∗p < 0.001, ∗∗∗∗p < 0.0001. RI, Recognition Index.
Figure 4
Figure 4
Immunofluorescence staining of a mouse brain section after stimulation (A) Experimental procedure. (B) The image from left to right displays the immunofluorescence staining results of the hippocampal-activated neurons in mice exposed to various stimuli across different groups, as observed under a 3-fold magnification. (C) As observed under a 13.8-fold magnification. (D) As observed under a 60-fold magnification. (E) c-Fos intensities in the hippocampus in mice exposed to various stimuli across different groups. The data are presented as individual data points, representing the average of three consecutive fields under a 60-fold magnification (n = 5 mice per group). Error bars represent ±standard error of the mean. ∗p < 0.05, ∗∗∗∗p < 0.0001.
Figure 5
Figure 5
The variation in mRNA expression in the hippocampus of different groups of mice (A) The volcano plot shows the differential gene expression between the Con group and the D-V group. (B) The volcano plot shows the differential gene expression between the S-V group and the D-V group. (C) The volcano plot shows the differential gene expression between the Con, D + V, and the D-V groups. (D) The UpSet Venn diagram showcases the differential mRNA expression between the D-V group and the remaining groups. The red boxes indicate that all three genes exhibit downregulation in the D-V group when compared to the other groups (n = 5 mice per stimulus group, n = 3 mice in the blank control group). Con, control group; S-V, Single-Axle Vision-Ignoring group; D + V, Dual-Axle Vision-Enabled group; D-V, Coriolis Illusion group.
Figure 6
Figure 6
The target gene was identified through screening, and its relative expression level was subsequently validated (A) The heatmaps depict the expression levels of the three downregulated genes throughout the transcriptome sequencing samples. Red indicates high gene expression levels, while blue indicates low gene expression levels. (B) The gene ontology (GO) enrichment bubble plot for the three downregulated genes. The GO functions associated with the target gene are highlighted within the red box. (C) The relative expression levels of the target gene Slc17a6 across different groups (n = 3 mice per group). Error bars represent ±standard error of the mean. ∗∗p < 0.01, ∗∗∗∗p < 0.0001.

Similar articles

References

    1. Lessard C.S. Spatial disorientation: dealing with aeronautical illusions. IEEE Eng. Med. Biol. Mag. 2000;19:25–27. - PubMed
    1. Meeks R.K., Anderson J., Bell P.M. 2023. Physiology of Spatial Orientation. - PubMed
    1. Gibb R., Ercoline B., Scharff L. Spatial disorientation: Decades of pilot fatalities. Aviat Space Environ. Med. 2011;82:717–724. - PubMed
    1. Newman R.L., Rupert A.H. The Magnitude of the Spatial Disorientation Problem in Transport Airplanes. Aerosp. Med. Hum. Perform. 2020;91:65–70. - PubMed
    1. Pennings H.J.M., Oprins E.A.P.B., Wittenberg H., Houben M.M.J., Groen E.L. Spatial Disorientation Survey Among Military Pilots. Aerosp. Med. Hum. Perform. 2020;91:4–10. - PubMed