. 2023 Nov 23;26(12):108574.
doi: 10.1016/j.isci.2023.108574. eCollection 2023 Dec 15.

Global blood miRNA profiling unravels early signatures of immunogenicity of Ebola vaccine rVSVΔG-ZEBOV-GP

Collaborators, Affiliations

Global blood miRNA profiling unravels early signatures of immunogenicity of Ebola vaccine rVSVΔG-ZEBOV-GP

Eleonora Vianello et al. iScience. .

Abstract

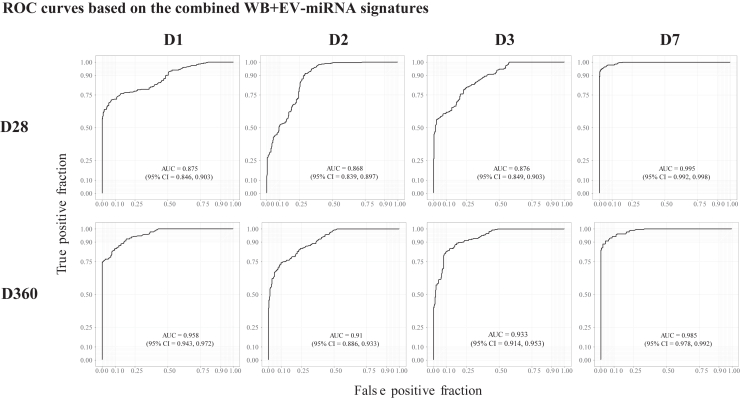
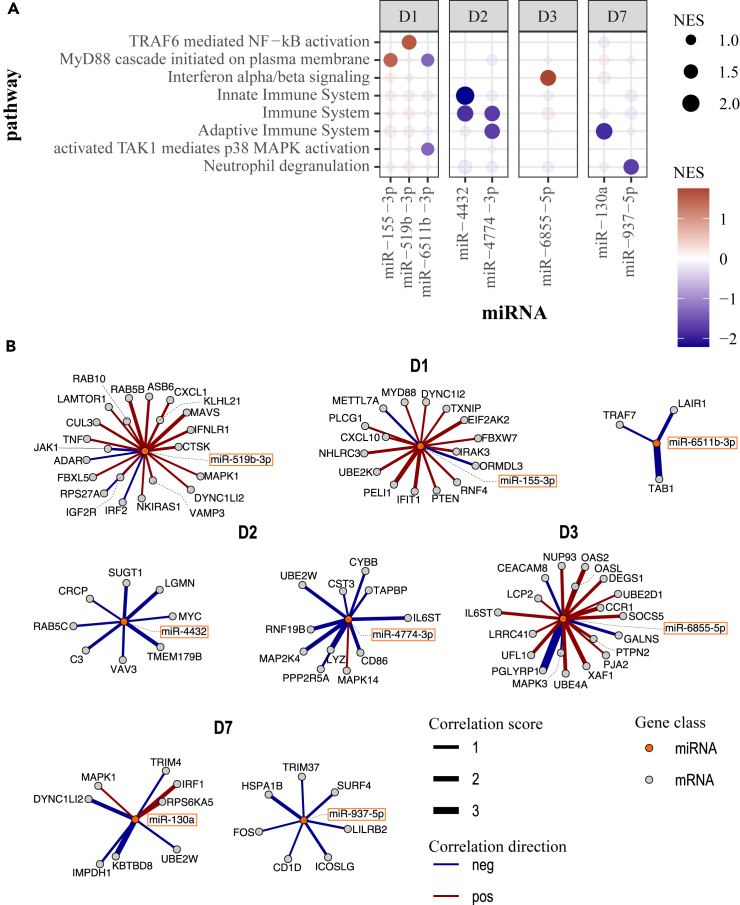
The vectored Ebola vaccine rVSVΔG-ZEBOV-GP elicits protection against Ebola Virus Disease (EVD). In a study of forty-eight healthy adult volunteers who received either the rVSVΔG-ZEBOV-GP vaccine or placebo, we profiled intracellular microRNAs (miRNAs) from whole blood cells (WB) and circulating miRNAs from serum-derived extracellular vesicles (EV) at baseline and longitudinally following vaccination. Further, we identified early miRNA signatures associated with ZEBOV-specific IgG antibody responses at baseline and up to one year post-vaccination, and pinpointed target mRNA transcripts and pathways correlated to miRNAs whose expression was altered after vaccination by using systems biology approaches. Several miRNAs were differentially expressed (DE) and miRNA signatures predicted high or low IgG ZEBOV-specific antibody levels with high classification performance. The top miRNA discriminators were WB-miR-6810, EV-miR-7151-3p, and EV-miR-4426. An eight-miRNA antibody predictive signature was associated with immune-related target mRNAs and pathways. These findings provide valuable insights into early blood biomarkers associated with rVSVΔG-ZEBOV-GP vaccine-induced IgG antibody responses.

Keywords: Health sciences; Immunology; Molecular biology; Virology.


Conflict of interest statement

The authors declare no competing interests.

Figures

None
Graphical abstract
Figure 1
Figure 1
Data overview of the WB-miRNA and the EV-miRNA profile during the first week after rVSVΔG-ZEBOV-GP vaccination Blood samples were retrieved from individuals that received either the rVSVΔG-ZEBOV-GP Ebola vaccine or placebo and processed for miRNomic profiling. The normalized and baseline-adjusted Log2-transformed sequencing data were modeled in two-dimensional OPLS-DA plots, a statistical multivariate data analysis technique. The horizontal direction of the plots displays the inter-group variation, while the intra-group variation can be seen in the vertical direction of the plots. (A) Score plots of OPLS-DA analysis of the WB-miRNA profile identified (1 + 1+0) components at day (D) 1, D2, D3, and D7. The models explained 16–21% (R2X WB-miRNA) of the inter-group variance and 81–89% (R2Y WB-miRNA) of the of the intra-group variation. (B) Score plots of OPLS-DA analysis of the EV-miRNA profile identified (1 + 1+0) components at D1, D2, D3, D4, and D7. The models explained 9–36% (R2X EV-miRNA) of the inter-group variance and 85–92% (R2Y EV-miRNAs) of the of the intra-group variation.
Figure 2
Figure 2
Differential expression of WB-miRNAs and EV-miRNAs early after rVSVΔG-ZEBOV-GP vaccination Normalized and baseline-adjusted Log2-transformed read counts were used to construct volcano plots displaying the differential miRNA expression in individuals given the rVSVΔG-ZEBOV-GP vaccine in comparison with the placebo group. The analyses were performed with Mann-Whitney test. Each data point represents one miRNA. Significant (p < 0.01) miRNAs with a higher or lower expression level are highlighted in red or blue, respectively. The p values are shown on a -Log10 scale for better visualization. Each dotted, horizontal line indicates the significance threshold (p < 0.01) and each dotted, vertical line indicates the border between lower (negative Log2 fold change value) or higher (positive Log2 fold change value). (A) Volcano plots for WB-miRNA at day (D) 1, D2, D3, and D7. (B) Volcano plots for EV-miRNA at D1, D2, D3, D4, and D7.
Figure 3
Figure 3
Shared significantly differentially expressed miRNAs at sampling time points post-vaccination The data over differential miRNA expression, in individuals given the rVSVΔG-ZEBOV-GP vaccine in comparison with the placebo group, were derived according to Figure 2 and used to create Venn diagrams. (A) The number of significantly (p < 0.01) differentially expressed miRNAs in WB at day (D) 1, D2, D3, and D7 after vaccination. (B) The number of significantly (p < 0.01) differentially expressed EV-derived miRNAs at D1, D2, D3, D4, and D7 after vaccination.
Figure 4
Figure 4
Correlation between post-vaccination miRNA profile and antibody responses Immunogenicity data were used to analyze the relation between miRNA expression in vaccinees and vaccine-induced ZEBOV-GP-specific antibodies. Specifically, Pearson correlation regressions were performed between day (D) 28 and D360 antibody titers (EU/mL) and normalized and baseline-adjusted Log2-transformed miRNA values. The size of each dot corresponds to the -Log10 p value in the correlation analysis. Only transcripts that correlated at minimum two time points were included. p < 0.05 was considered significant in the correlation analysis for WB-miRNAs and EV-miRNAs. Red color indicates positive correlation, while blue color indicates inverse correlation. The strenght of the colors corresponds to the size of the correlation coefficient. (A) Heatmaps displaying the correlation between WB-miRNA levels, at D1, D2, D3, and D7, and specific antibodies post-vaccination. (B) Heatmaps displaying the correlation between EV-miRNA levels, at D1, D2, D3, D4, and D7, and specific antibodies post-vaccination.
Figure 5
Figure 5
Correlation between pre-vaccination miRNA profile and post-vaccination antibody levels Immunogenicity data were used to analyze the relation between baseline miRNA expression in vaccinees and vaccine-induced ZEBOV-GP-specific antibodies. Specifically, Pearson correlation regressions were performed between day (D) 14, D28, D56, D180, and D360 antibody titers (EU/mL) and normalized Log2-transformed baseline miRNA values. The size of each dot corresponds to the -Log10 p value in the correlation analysis. Only transcripts that correlated at minimum two time points were included. p < 0.05 was considered significant in the correlation analysis for WB-miRNAs and EV-miRNAs. Red color indicates positive correlation, while blue color indicates inverse correlation. The strenght of the colors corresponds to the size of the correlation coefficient. (A) Heatmap displaying the correlation between WB-miRNA levels at D0 and specific antibodies post-vaccination. (B) Heatmap displaying the correlation between EV-miRNA levels at D0 and specific antibodies post-vaccination.
Figure 6
Figure 6
Prediction of vaccine-induced antibody responses based on the distinct WB- or EV-miRNA expression Normalized and baseline-adjusted Log2-transformed miRNA values and immunogenicity data were retrieved from rVSVΔG-ZEBOV-GP recipients. The levels of ZEBOV-GP-specific antibodies (EU/mL) were classified as low or high by using the median. Signatures including the most relevant miRNAs in predicting antibody levels were identified by using Recursive Feature Elimination (RFE). The machine learning algorithm Random Forest was used to evaluate the performance of each RFE-identified miRNA signature in classifying the antibody levels at day (D)28 and D360. K-fold cross validation (10-fold, 20 repeats) was used to evaluate the quality of the model. The classification performance of the model was assessed by evaluating the receiver operating characteristic (ROC) curve and area under the curve (AUC) including 95% confidence intervals (CI). (A) ROC curves over WB-miRNA time points (D1, D2, D3, and D7) and ZEBOV-GP-specific antibody levels at D28 and D360 post-vaccination. (B) ROC curves over EV-miRNA time points (D1, D2, D3, D4, and D7) and ZEBOV-GP-specific antibody levels at D28 and D360 post-vaccination.
Figure 7
Figure 7
Prediction of vaccine-induced antibody responses based on the combined WB- and EV-miRNA expression Normalized and baseline-adjusted Log2-transformed miRNA values and immunogenicity data were retrieved from rVSVΔG-ZEBOV-GP recipients. Signatures including the most relevant miRNAs in predicting ZEBOV-GP-specific antibodies (EU/mL) levels, specified by using the median, were identified by using Recursive Feature Elimination (RFE). The machine learning algorithm Random Forest was used to evaluate the performance of each RFE-identified miRNA signature in classifying the antibody levels at day (D) 28 and D360. K-fold cross validation (10-fold, 20 repeats) was used to evaluate the quality of the model. The classification performance of the model was assessed by evaluating the receiver operating characteristic (ROC) curve and area under the curve (AUC) including 95% confidence intervals (CI). ROC curves are built over WB- and EV-miRNA time points (D1, D2, D3, and D7) and ZEBOV-GP-specific antibody levels at D28 and D360 post-vaccination.
Figure 8
Figure 8
Enriched immune-related pathways of mRNA targets of antibody predictive miRNAs (A) Immune-related pathways associated with known targets of predictive miRNAs. Targets were ranked by their correlation coefficient with their corresponding miRNA in each post-vaccination day to run the Gene Set Enrichment Analysis. (B) Networks of correlated targets involved in immune-related pathways in each day post-vaccination. miRNAs are represented at the center, and their correlated target genes are connected via edges. Edges are colored to indicate the direction of correlation (positive: red, negative: blue) and scaled proportionally to the strength of the correlation, as denoted by the correlation score (correlation coefficient × -log10[p value]).

References

    1. Jacob S.T., Crozier I., Fischer W.A., 2nd, Hewlett A., Kraft C.S., Vega M.A.d.L., Soka M.J., Wahl V., Griffiths A., Bollinger L., Kuhn J.H. Ebola virus disease. Nat. Rev. Dis. Primers. 2020;6:13. - PMC - PubMed
    1. Kanapathipillai R., Henao Restrepo A.M., Fast P., Wood D., Dye C., Kieny M.P., Moorthy V. Ebola vaccine--an urgent international priority. N. Engl. J. Med. 2014;371:2249–2251. - PubMed
    1. Dayer J.A., Siegrist C.A., Huttner A. Volunteer feedback and perceptions after participation in a phase I, first-in-human Ebola vaccine trial: An anonymous survey. PLoS One. 2017;12 - PMC - PubMed
    1. Huttner A., Dayer J.A., Yerly S., Combescure C., Auderset F., Desmeules J., Eickmann M., Finckh A., Goncalves A.R., Hooper J.W., et al. The effect of dose on the safety and immunogenicity of the VSV Ebola candidate vaccine: a randomised double-blind, placebo-controlled phase 1/2 trial. Lancet Infect. Dis. 2015;15:1156–1166. - PMC - PubMed
    1. Gsell P.S., Camacho A., Kucharski A.J., Watson C.H., Bagayoko A., Nadlaou S.D., Dean N.E., Diallo A., Diallo A., Honora D.A., et al. Ring vaccination with rVSV-ZEBOV under expanded access in response to an outbreak of Ebola virus disease in Guinea, 2016: an operational and vaccine safety report. Lancet Infect. Dis. 2017;17:1276–1284. - PMC - PubMed