Transcriptome analysis and physiological changes in the leaves of two Bromus inermis L. genotypes in response to salt stress
- PMID: 38162311
- PMCID: PMC10755925
- DOI: 10.3389/fpls.2023.1313113
Transcriptome analysis and physiological changes in the leaves of two Bromus inermis L. genotypes in response to salt stress
Abstract
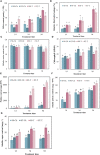
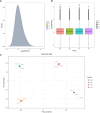
Soil salinity is a major factor threatening the production of crops around the world. Smooth bromegrass (Bromus inermis L.) is a high-quality grass in northern and northwestern China. Currently, selecting and utilizing salt-tolerant genotypes is an important way to mitigate the detrimental effects of salinity on crop productivity. In our research, salt-tolerant and salt-sensitive varieties were selected from 57 accessions based on a comprehensive evaluation of 22 relevant indexes, and their salt-tolerance physiological and molecular mechanisms were further analyzed. Results showed significant differences in salt tolerance between 57 genotypes, with Q25 and Q46 considered to be the most salt-tolerant and salt-sensitive accessions, respectively, compared to other varieties. Under saline conditions, the salt-tolerant genotype Q25 not only maintained significantly higher photosynthetic performance, leaf relative water content (RWC), and proline content but also exhibited obviously lower relative conductivity and malondialdehyde (MDA) content than the salt-sensitive Q46 (p < 0.05). The transcriptome sequencing indicated 15,128 differentially expressed genes (DEGs) in Q46, of which 7,885 were upregulated and 7,243 downregulated, and 12,658 DEGs in Q25, of which 6,059 were upregulated and 6,599 downregulated. The Kyoto Encyclopedia of Genes and Genomes (KEGG) analysis showed that the salt response differences between Q25 and Q46 were attributed to the variable expression of genes associated with plant hormone signal transduction and MAPK signaling pathways. Furthermore, a large number of candidate genes, related to salt tolerance, were detected, which involved transcription factors (zinc finger proteins) and accumulation of compatible osmolytes (glutathione S-transferases and pyrroline-5-carboxylate reductases), etc. This study offers an important view of the physiological and molecular regulatory mechanisms of salt tolerance in two smooth bromegrass genotypes and lays the foundation for further identification of key genes linked to salt tolerance.
Keywords: Bromus inermis L.; accessions evaluation; physiological analysis; salt stress; transcriptome analysis.
Copyright © 2023 Song, Gao, Li, Li, Wang, Wang, Wang, Ye, Hu, Li and Fu.
Conflict of interest statement
The authors declare that the research was conducted in the absence of any commercial or financial relationships that could be construed as a potential conflict of interest.
Figures


Similar articles
-
Transcriptome analysis and differential gene expression profiling of two contrasting quinoa genotypes in response to salt stress.BMC Plant Biol. 2020 Dec 30;20(1):568. doi: 10.1186/s12870-020-02753-1. BMC Plant Biol. 2020. PMID: 33380327 Free PMC article.
-
Full-Length Transcriptomics Reveals Complex Molecular Mechanism of Salt Tolerance in Bromus inermis L.Front Plant Sci. 2022 Jun 9;13:917338. doi: 10.3389/fpls.2022.917338. eCollection 2022. Front Plant Sci. 2022. PMID: 35755679 Free PMC article.
-
Comprehensive analysis of differentially expressed genes and transcriptional regulation induced by salt stress in two contrasting cotton genotypes.BMC Genomics. 2014 Sep 5;15(1):760. doi: 10.1186/1471-2164-15-760. BMC Genomics. 2014. PMID: 25189468 Free PMC article.
-
Identification of differentially expressed genes and pathways in isonuclear kenaf genotypes under salt stress.Physiol Plant. 2021 Dec;173(4):1295-1308. doi: 10.1111/ppl.13253. Epub 2020 Nov 18. Physiol Plant. 2021. PMID: 33135207
-
Comparative Transcriptome and Proteome Analysis of Salt-Tolerant and Salt-Sensitive Sweet Potato and Overexpression of IbNAC7 Confers Salt Tolerance in Arabidopsis.Front Plant Sci. 2020 Aug 27;11:572540. doi: 10.3389/fpls.2020.572540. eCollection 2020. Front Plant Sci. 2020. PMID: 32973858 Free PMC article.
Cited by
-
Metabolic Regulation and Saline-Alkali Stress Response in Novel Symbionts of Epichloë bromicola-Bromus inermis.Plants (Basel). 2025 Apr 1;14(7):1089. doi: 10.3390/plants14071089. Plants (Basel). 2025. PMID: 40219157 Free PMC article.
-
Evaluation of cucumber seed germination vigor under salt stress environment based on improved YOLOv8.Front Plant Sci. 2024 Sep 13;15:1447346. doi: 10.3389/fpls.2024.1447346. eCollection 2024. Front Plant Sci. 2024. PMID: 39354946 Free PMC article.
-
Optimizing genomic diversity assessments for conservation of Bromus auleticus (Trinius ex Nees) using individual and pooled sequencing.PLoS One. 2025 Jun 25;20(6):e0325548. doi: 10.1371/journal.pone.0325548. eCollection 2025. PLoS One. 2025. PMID: 40560985 Free PMC article.
References
-
- Albaladejo I., Egea I., Morales B., Flores F. B., Capel C., Lozano R., et al. . (2018). Identification of key genes involved in the phenotypic alterations of res (restored cell structure by salinity) tomato mutant and its recovery induced by salt stress through transcriptomic analysis. BMC Plant Biol. 18, 1–19. doi: 10.1186/s12870-018-1436-9 - DOI - PMC - PubMed
LinkOut - more resources
Full Text Sources

