. 2023 Dec 14:13:1298333.
doi: 10.3389/fonc.2023.1298333. eCollection 2023.

TSPO is a potential independent prognostic factor associated with cellular respiration and p16 in head and neck squamous cell carcinoma

Affiliations

TSPO is a potential independent prognostic factor associated with cellular respiration and p16 in head and neck squamous cell carcinoma

Sanni Tuominen et al. Front Oncol. .

Abstract

Background: Treatment resistance and relapse are common problems in head and neck squamous cell carcinoma (HNSCC). Except for p16, no clinically accepted prognostic biomarkers are available for HNSCC. New biomarkers predictive of recurrence and survival are crucial for optimal treatment planning and patient outcome. High translocator protein (TSPO) levels have been associated with poor survival in cancer, but the role of TSPO has not been extensively evaluated in HNSCC.

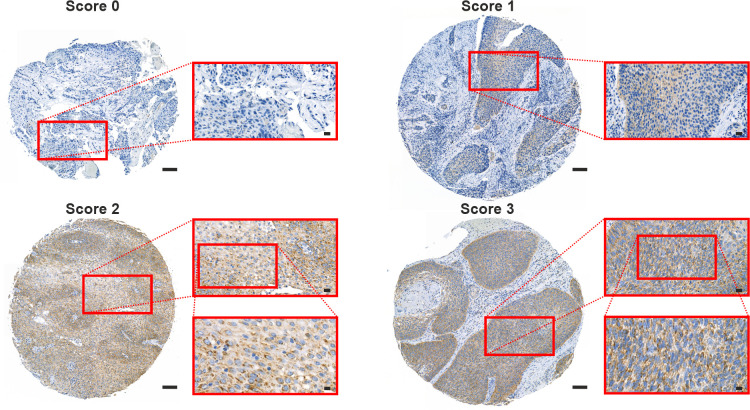
Materials and methods: TSPO expression was determined in a large population-based tissue microarray cohort including 611 patients with HNSCC and evaluated for survival in several clinicopathological subgroups. A TCGA HNSCC cohort was used to further analyze the role of TSPO in HNSCC.

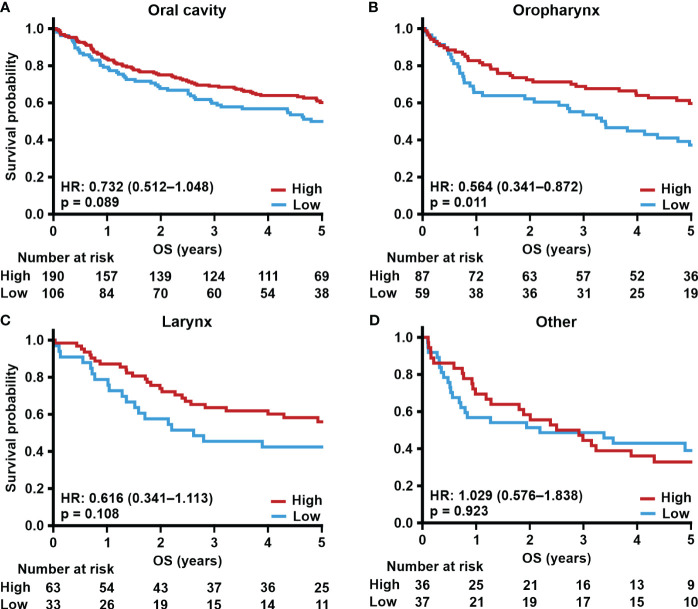
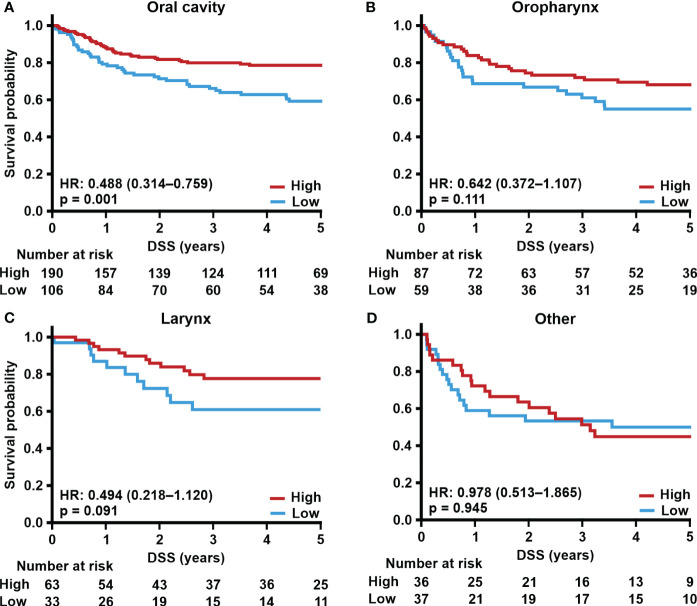
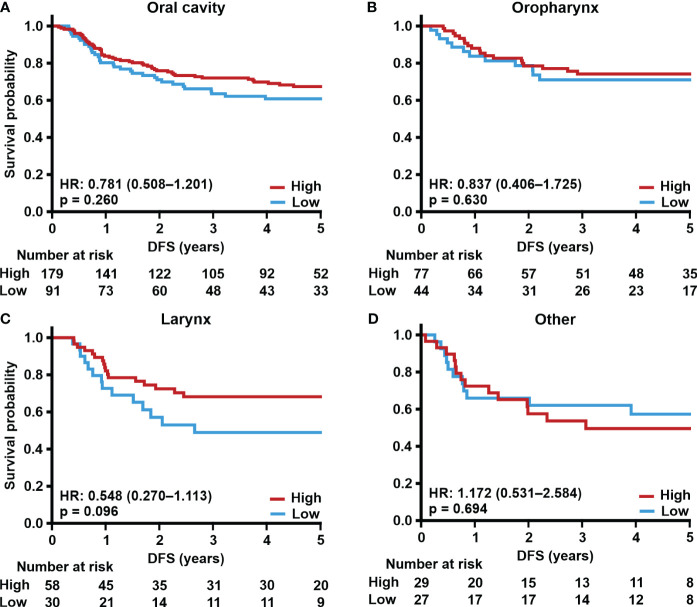
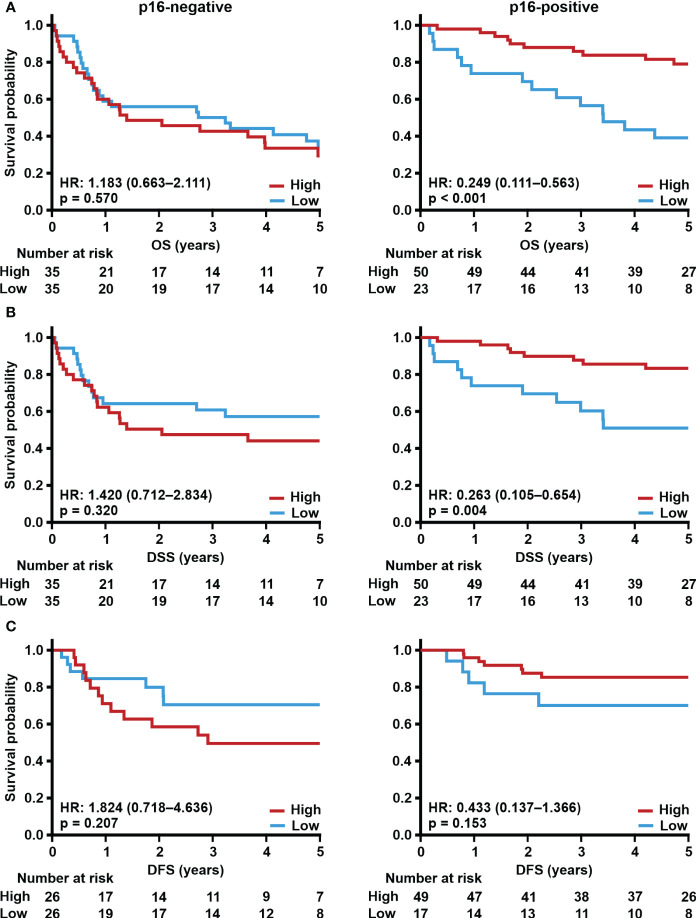
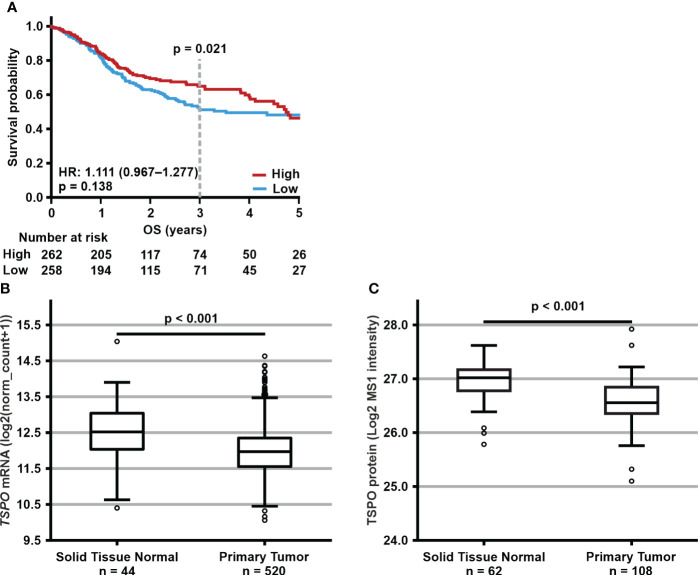
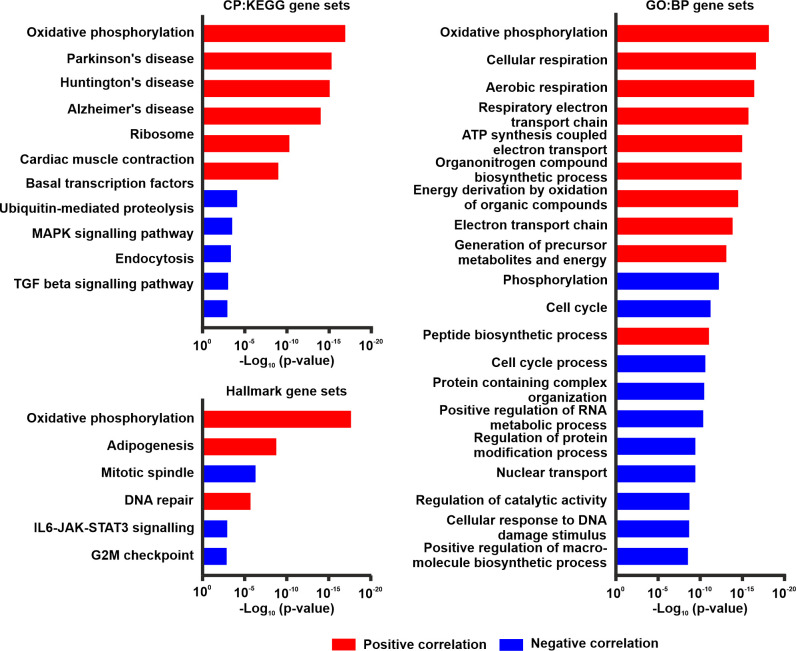
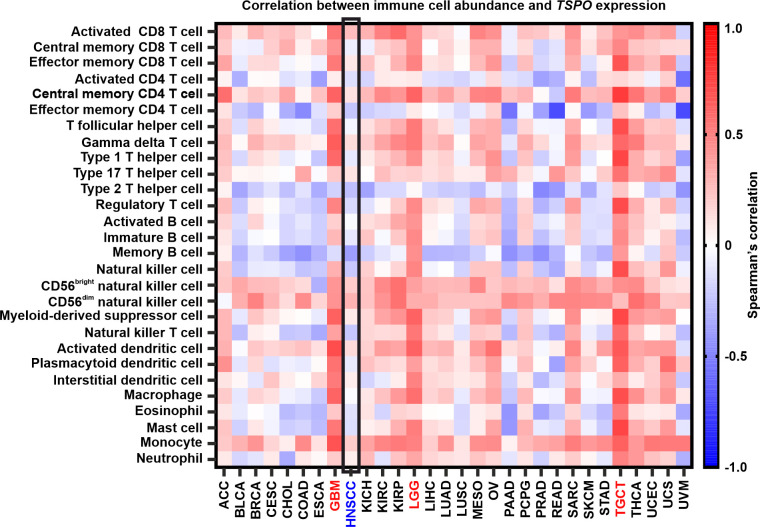
Results: TSPO expression was downregulated in more aggressive tumors. Low TSPO expression associated with worse 5-year survival and was an independent prognostic factor for disease-specific survival. Subgroup analyses showed that low TSPO expression associated with worse survival particularly in p16-positive oropharyngeal cancer. In silico analyses supported the prognostic role of TSPO. Cellular respiration had the highest significance in pathway analyses for genes expressed positively with TSPO.

Conclusion: Decreased TSPO expression associates with poor prognosis in HNSCC. TSPO is a prognostic biomarker in HNSCC to potentially guide treatment stratification especially in p16-positive oropharyngeal cancer.

Keywords: biomarker; head and neck cancer; immune landscape; oxidative phosphorylation; p16; translocator protein.


Conflict of interest statement

The authors declare that the research was conducted in the absence of any commercial or financial relationships that could be construed as a potential conflict of interest.

Figures

Figure 1
Figure 1
TSPO expression pattern in the HNSCC TMA cohort. Representative images of grade 2 HNSCC sections stained against TSPO. Sections were scored (0–3) according to the staining intensity. Scale bars: 100 µm (whole section), 20 µm (first inset), and 10 µm (second inset).
Figure 2
Figure 2
TSPO expression and site-specific overall survival. Prognostic trends with HR (95% CI) for 5-year OS in (A) oral cavity, (B) oropharynx, (C) larynx, and (D) other primary tumor sites divided into low and high (staining intensity scores of 0–1 and 2–3, respectively) TSPO tumor expression. Statistical significance was calculated using Cox’s proportional hazard model. p-values < 0.05 were considered statistically significant.
Figure 3
Figure 3
TSPO expression and site-specific disease-specific survival. Prognostic trends with HR (95% CI) for 5-year DSS in (A) oral cavity, (B) oropharynx, (C) larynx, and (D) other primary tumor sites divided into low and high (staining intensity scores of 0–1 and 2–3, respectively) TSPO tumor expression. Statistical significance was calculated using Cox’s proportional hazard model. p-values < 0.05 were considered statistically significant.
Figure 4
Figure 4
TSPO expression and site-specific disease-free survival. Prognostic trends with HR (95% CI) for 5-year DFS in (A) oral cavity, (B) oropharynx, (C) larynx, and (D) other primary tumor sites divided into low and high (staining intensity scores of 0–1 and 2–3, respectively) TSPO tumor expression. Statistical significance was calculated using Cox’s proportional hazard model. p-values < 0.05 were considered statistically significant.
Figure 5
Figure 5
Effect of p16 and TSPO expression on survival. Prognostic trends with HR (95% CI) for 5-year (A) OS, (B) DSS, and (C) DFS in oropharyngeal cancer according to low (staining intensity scores 0–1) and high (staining intensity scores 2–3) TSPO tumor expression in patients with p16-negative or p16-positive tumors. Statistical significance was calculated using Cox’s proportional hazard model. p-values < 0.05 were considered statistically significant.
Figure 6
Figure 6
Expression levels and prognostic significance of TSPO expression in the publicly available HNSCC cohorts. (A) Prognostic trend with HR (95% CI) for 5-year OS according to low (below median) and high (equal to or above median) TSPO expression in all TCGA HNSCC cohort patients. p-value for 3-year OS is shown above the dotted line. Statistical significance for survival analyses was calculated using Cox’s proportional hazard model. (B) TSPO mRNA and (C) TSPO protein expression in normal tissues and primary tumors in TCGA and CPTAC HNSCC cohorts, respectively. Data are shown as minimum, first quartile, median, third quartile, and maximum. Dots represent outliers. Independent samples t-test was used to analyze the difference in TSPO expression between normal tissue and primary tumor.
Figure 7
Figure 7
Pathway overlap analyses in the TCGA HNSCC cohort. Overlap analysis for top 100 genes expressed either positively (red) or negatively (blue) with TSPO. The top 10 results for both positive and negative correlations are shown for the CP : KEGG, Hallmark, and GO : BP gene set collections. p-values calculated by hypergeometric distribution for pathway gene overlap analyses were acquired from MSigDB.
Figure 8
Figure 8
Correlation between TSPO expression and immune cell abundance in different cancers. HNSCC (blue) is highlighted inside a black box. GBM, LGG, and TGCT (all in red) showed the highest positive correlations. Spearman’s correlations between immune cell abundance and TSPO expression were acquired from TISIDB. GBM, glioblastoma multiforme; LGG, brain lower grade glioma; TGCT, testicular germ cell tumors. The remaining cancer abbreviations are found in Supplementary Table S7.

Similar articles

Cited by

References

    1. Chow LQM. Head and neck cancer. N Engl J Med (2020) 382(1):60–72. doi: 10.1056/NEJMra1715715 - DOI - PubMed
    1. Mody MD, Rocco JW, Yom SS, Haddad RI, Saba NF. Head and neck cancer. Lancet (2021) 398(10318):2289–99. doi: 10.1016/S0140-6736(21)01550-6 - DOI - PubMed
    1. Bray F, Ferlay J, Soerjomataram I, Siegel RL, Torre LA, Jemal A. Global cancer statistics 2018: GLOBOCAN estimates of incidence and mortality worldwide for 36 cancers in 185 countries. CA Cancer J Clin (2018) 68(6):394–424. doi: 10.3322/caac.21492 - DOI - PubMed
    1. Machiels JP, René Leemans C, Golusinski W, Grau C, Licitra L, Gregoire V, et al. . Squamous cell carcinoma of the oral cavity, larynx, oropharynx and hypopharynx: EHNS-ESMO-ESTRO Clinical Practice Guidelines for diagnosis, treatment and follow-up. Ann Oncol (2020) 31(11):1462–75. doi: 10.1016/j.annonc.2020.07.011 - DOI - PubMed
    1. Johnson DE, Burtness B, Leemans CR, Lui VWY, Bauman JE, Grandis JR. Head and neck squamous cell carcinoma. Nat Rev Dis Primers (2020) 6(1):92. doi: 10.1038/s41572-020-00224-3 - DOI - PMC - PubMed

LinkOut - more resources