

Quantitative melanoma diagnosis using spectral phasor analysis of hyperspectral imaging from label-free slices
- PMID: 38162497
- PMCID: PMC10756080
- DOI: 10.3389/fonc.2023.1296826
Quantitative melanoma diagnosis using spectral phasor analysis of hyperspectral imaging from label-free slices
Abstract
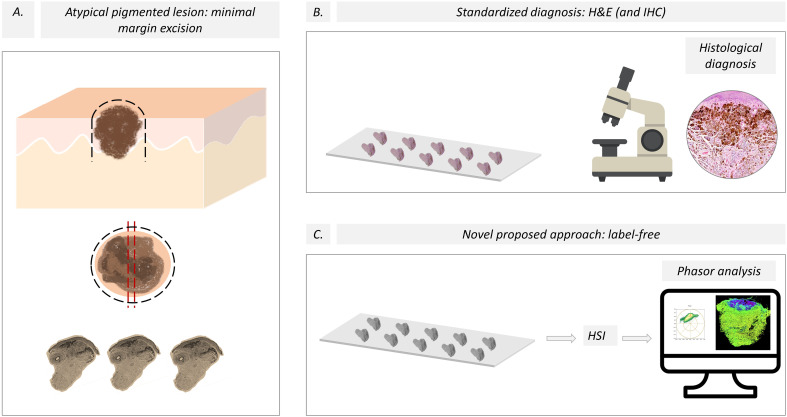
Introduction: Melanoma diagnosis traditionally relies on microscopic examination of hematoxylin and eosin (H&E) slides by dermatopathologists to search for specific architectural and cytological features. Unfortunately, no single molecular marker exists to reliably differentiate melanoma from benign lesions such as nevi. This study explored the potential of autofluorescent molecules within tissues to provide molecular fingerprints indicative of degenerated melanocytes in melanoma.
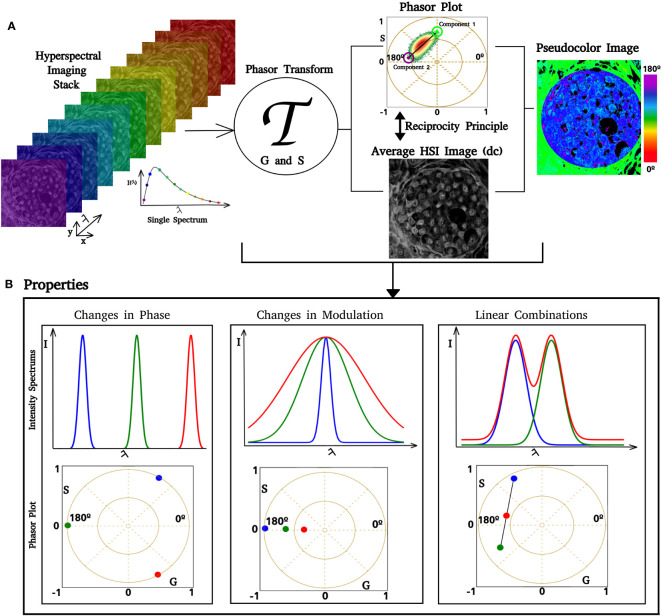
Methods: Using hyperspectral imaging (HSI) and spectral phasor analysis, we investigated autofluorescence patterns in melanoma compared to intradermal nevi. Using UV excitation and a commercial spectral confocal microscope, we acquired label-free HSI data from the whole-slice samples.
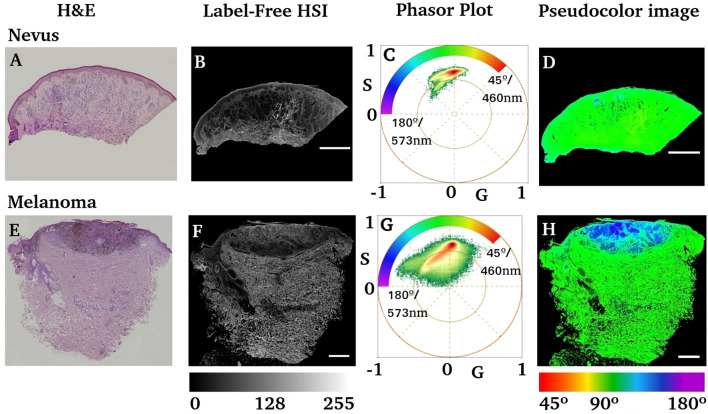
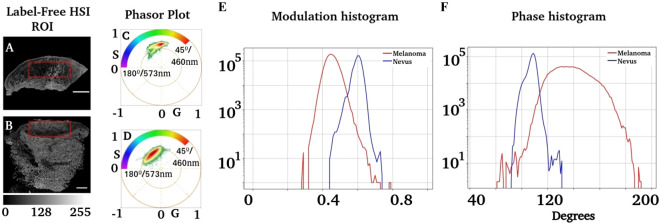
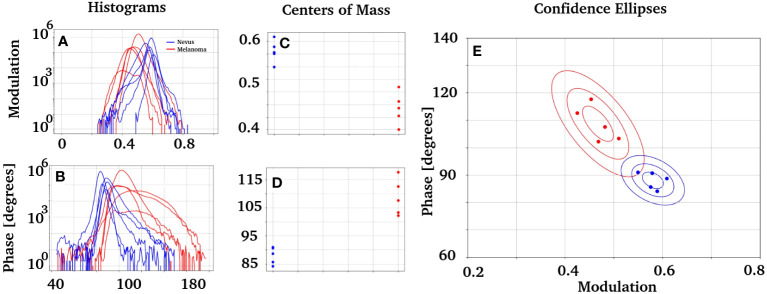
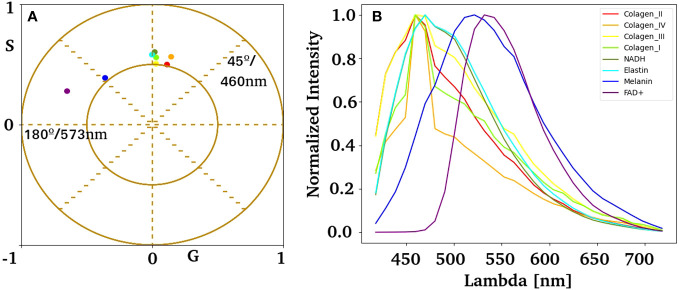
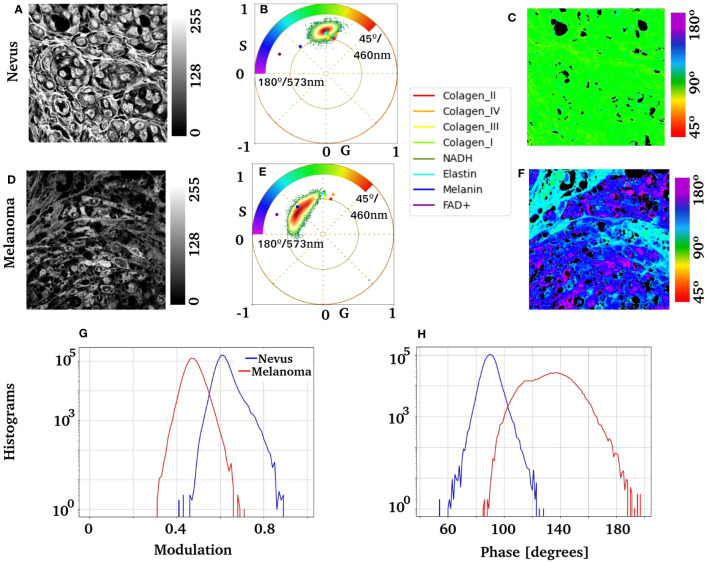
Results: Our findings revealed distinct spectral phasor distributions between melanoma and intradermal nevi, with melanoma displaying a broader phasor phase distribution, signifying a more heterogeneous autofluorescence pattern. Notably, longer wavelengths associated with larger phases correlated with regions identified as melanoma by expert dermatopathologists using H&E staining. Quantitative analysis of phase and modulation histograms within the phasor clusters of five melanomas (with Breslow thicknesses ranging from 0.5 mm to 6 mm) and five intradermal nevi consistently highlighted differences between the two groups. We further demonstrated the potential for the discrimination of several melanocytic lesions using center-of-mass comparisons of phase and modulation variables. Remarkably, modulation versus phase center of mass comparisons revealed strong statistical significance among the groups. Additionally, we identified the molecular endogenous markers responsible for tissue autofluorescence, including collagen, elastin, NADH, FAD, and melanin. In melanoma, autofluorescence is characterized by a higher phase contribution, indicating an increase in FAD and melanin in melanocyte nests. In contrast, NADH, elastin, and collagen dominate the autofluorescence of the nevus.
Discussion: This work underscores the potential of autofluorescence and HSI-phasor analysis as valuable tools for quantifying tissue molecular fingerprints, thereby supporting more effective and quantitative melanoma diagnosis.
Keywords: cancer; fluorescence microscopy; hyperspectral imaging; melanoma; nevus; phasor analysis; skin cancer; spectral phasor.
Copyright © 2023 Schuty, Martínez, Guerra, Lecumberry, Magliano and Malacrida.
Conflict of interest statement
The authors declare that the research was conducted in the absence of any commercial or financial relationships that could be construed as a potential conflict of interest. The handling editor SR declared a past co-authorship with one of the authors LM. The author(s) declared that they were an editorial board member of Frontiers, at the time of submission. This had no impact on the peer review process and the final decision.
Figures
Similar articles
-
Role of In Vivo Reflectance Confocal Microscopy in the Analysis of Melanocytic Lesions.Acta Dermatovenerol Croat. 2018 Apr;26(1):64-67. Acta Dermatovenerol Croat. 2018. PMID: 29782304 Review.
-
Hyperspectral imaging of melanocytic lesions.Am J Dermatopathol. 2014 Feb;36(2):131-6. doi: 10.1097/DAD.0b013e31829bad10. Am J Dermatopathol. 2014. PMID: 24247577
-
Phasor analysis of multiphoton spectral images distinguishes autofluorescence components of in vivo human skin.J Biophotonics. 2014 Aug;7(8):589-96. doi: 10.1002/jbio.201200244. Epub 2013 Apr 11. J Biophotonics. 2014. PMID: 23576407
-
Pump-probe imaging differentiates melanoma from melanocytic nevi.Sci Transl Med. 2011 Feb 23;3(71):71ra15. doi: 10.1126/scitranslmed.3001604. Sci Transl Med. 2011. PMID: 21346168 Free PMC article.
-
Label-free fluorescence microscopy: revisiting the opportunities with autofluorescent molecules and harmonic generations as biosensors and biomarkers for quantitative biology.Biophys Rev. 2023 Jun 26;15(4):709-719. doi: 10.1007/s12551-023-01083-4. eCollection 2023 Aug. Biophys Rev. 2023. PMID: 37681086 Free PMC article. Review.
Cited by
-
The optimization and application of photodynamic diagnosis and autofluorescence imaging in tumor diagnosis and guided surgery: current status and future prospects.Front Oncol. 2025 Jan 8;14:1503404. doi: 10.3389/fonc.2024.1503404. eCollection 2024. Front Oncol. 2025. PMID: 39845324 Free PMC article. Review.
-
Advancing hyperspectral imaging and machine learning tools toward clinical adoption in tissue diagnostics: A comprehensive review.APL Bioeng. 2024 Dec 6;8(4):041504. doi: 10.1063/5.0240444. eCollection 2024 Dec. APL Bioeng. 2024. PMID: 39660034 Free PMC article. Review.
References
-
- Kashani-Sabet M, Leachman SA, Stein JA, Arbiser JL, Berry EG, Celebi JT, et al. . Early detection and prognostic assessment of cutaneous melanoma: consensus on optimal practice and the role of gene expression profile testing. JAMA Dermatol (2023) 159:545–53. doi: 10.1001/jamadermatol.2023.0127 - DOI - PMC - PubMed
LinkOut - more resources
Full Text Sources