. 2023 Dec 15:14:1294459.
doi: 10.3389/fimmu.2023.1294459. eCollection 2023.

Leveraging a gene signature associated with disulfidptosis identified by machine learning to forecast clinical outcomes, immunological heterogeneities, and potential therapeutic targets within lower-grade glioma

Affiliations

Leveraging a gene signature associated with disulfidptosis identified by machine learning to forecast clinical outcomes, immunological heterogeneities, and potential therapeutic targets within lower-grade glioma

Yao Zhou et al. Front Immunol. .

Abstract

Background: Disulfidptosis, a newly defined type of programmed cell death, has emerged as a significant regulatory process in the development and advancement of malignant tumors, such as lower-grade glioma (LGG). Nevertheless, the precise biological mechanisms behind disulfidptosis in LGG are yet to be revealed, considering the limited research conducted in this field.

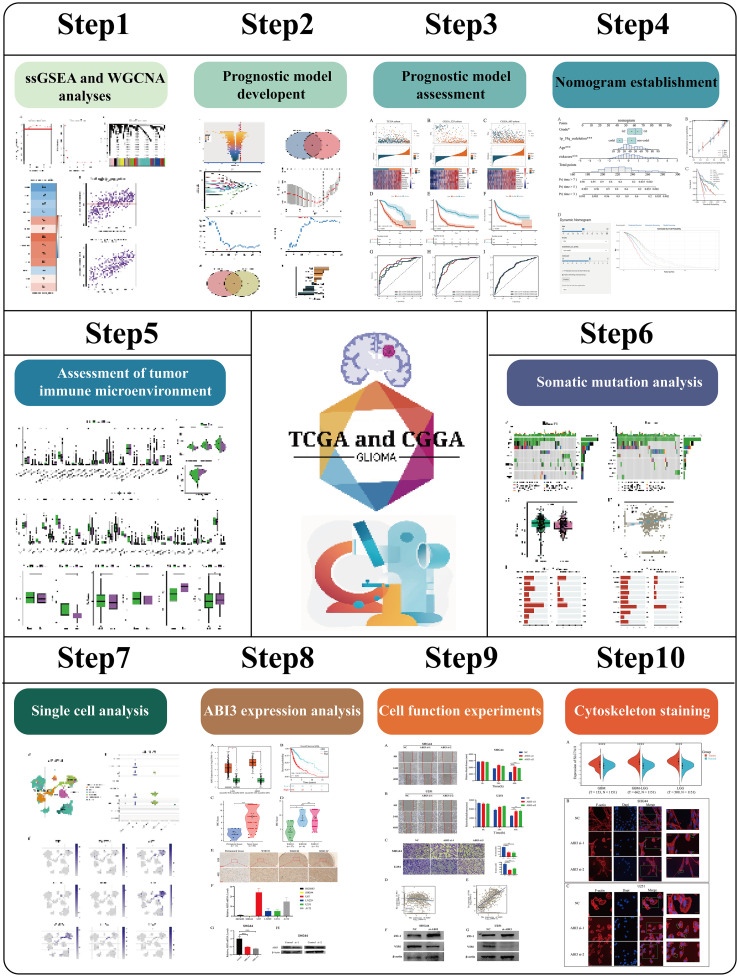
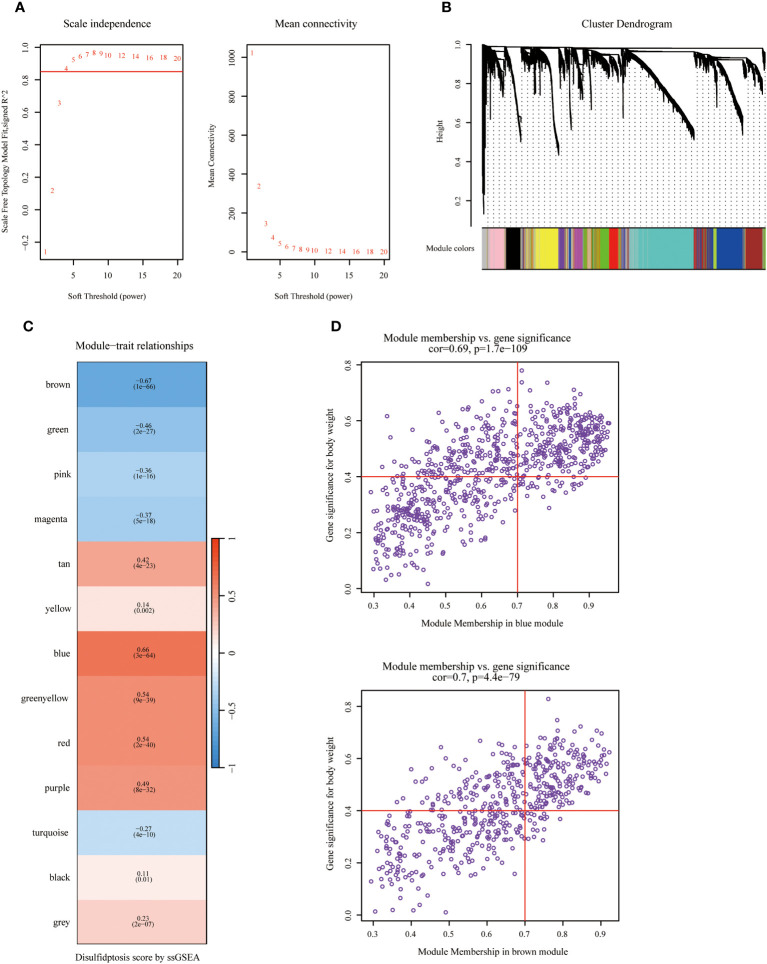
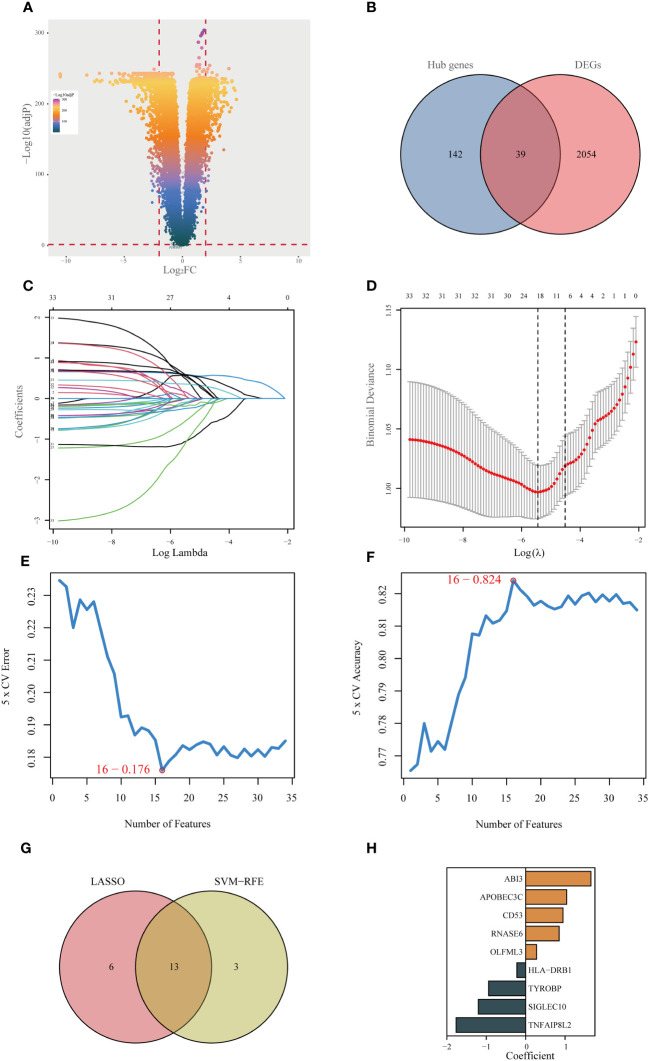
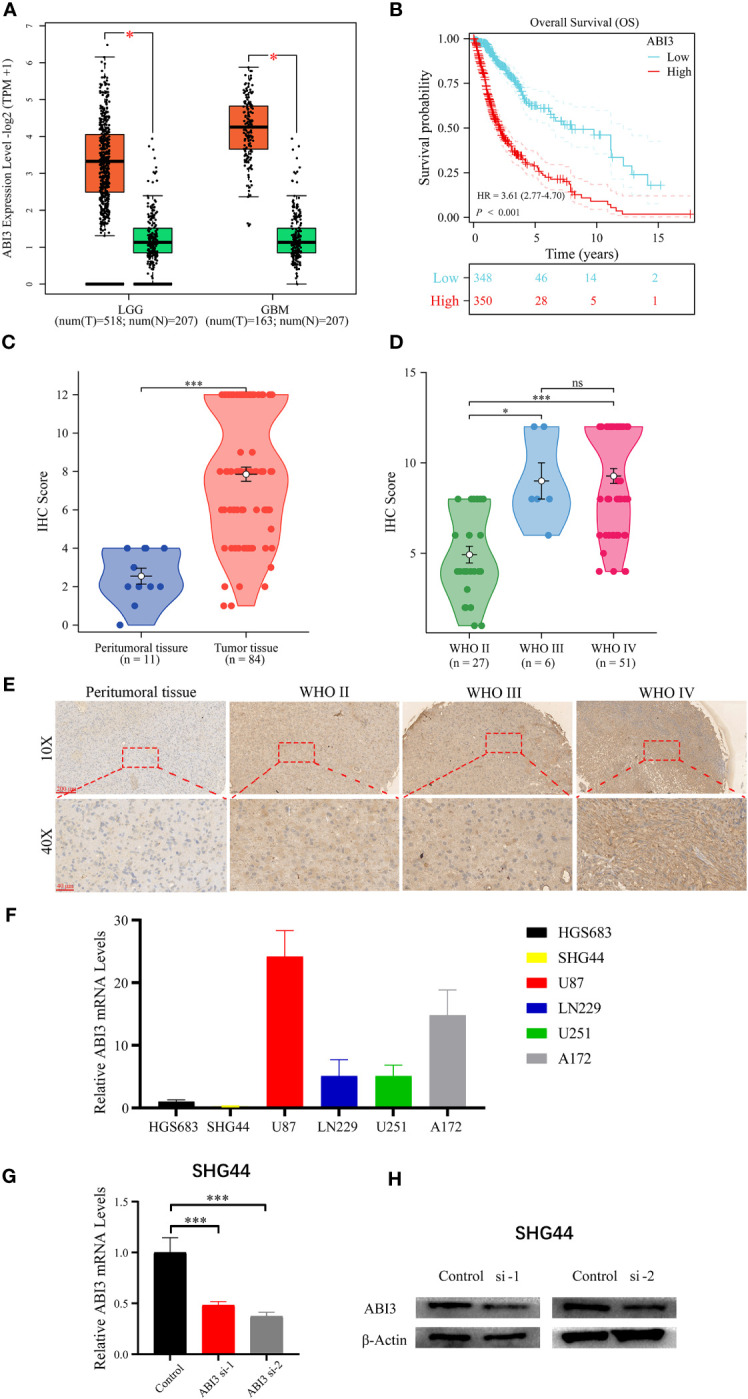
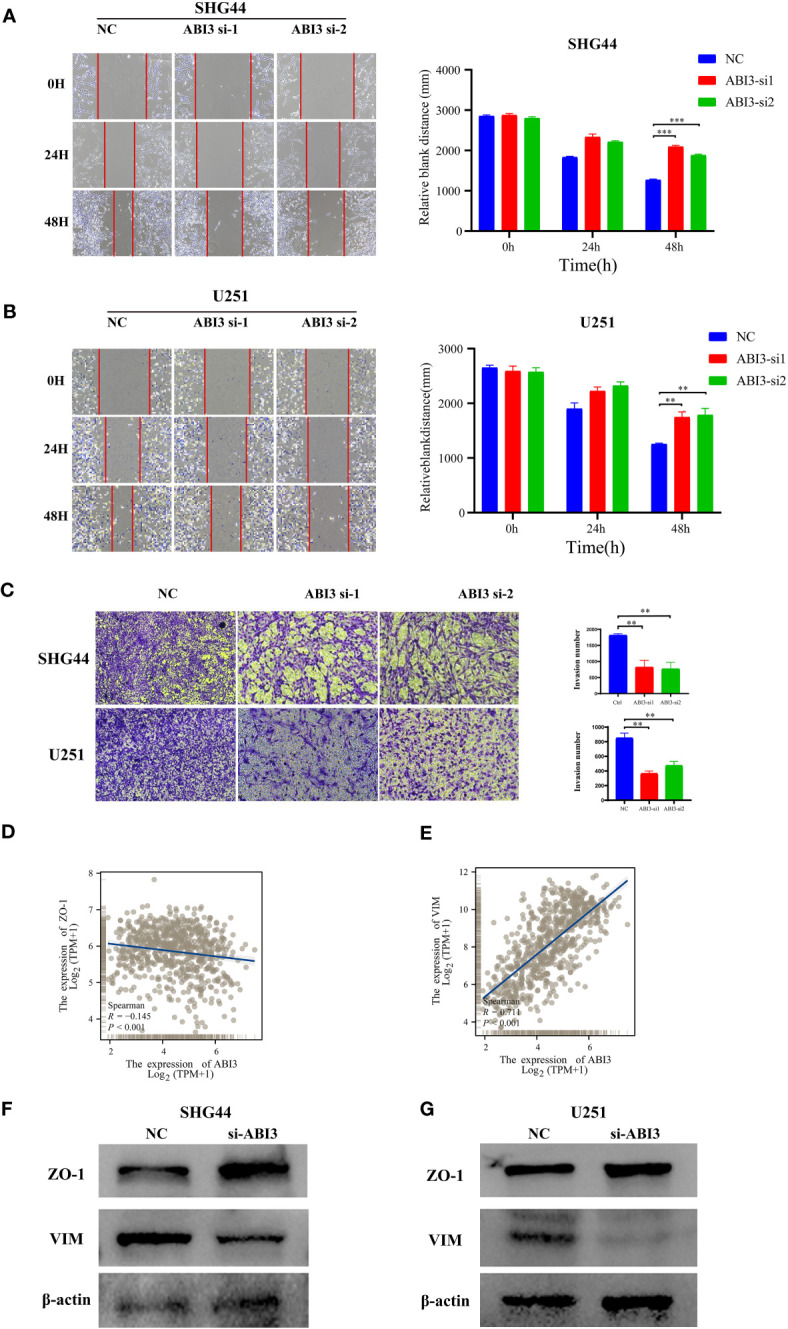
Methods: We obtained LGG data from the TCGA and CGGA databases and performed comprehensive weighted co-expression network analysis, single-sample gene set enrichment analysis, and transcriptome differential expression analyses. We discovered nine genes associated with disulfidptosis by employing machine learning methods like Cox regression, LASSO regression, and SVM-RFE. These were later used to build a predictive model for patients with LGG. To confirm the expression level, functional role, and impact on disulfidptosis of ABI3, the pivotal gene of the model, validation experiments were carried out in vitro.

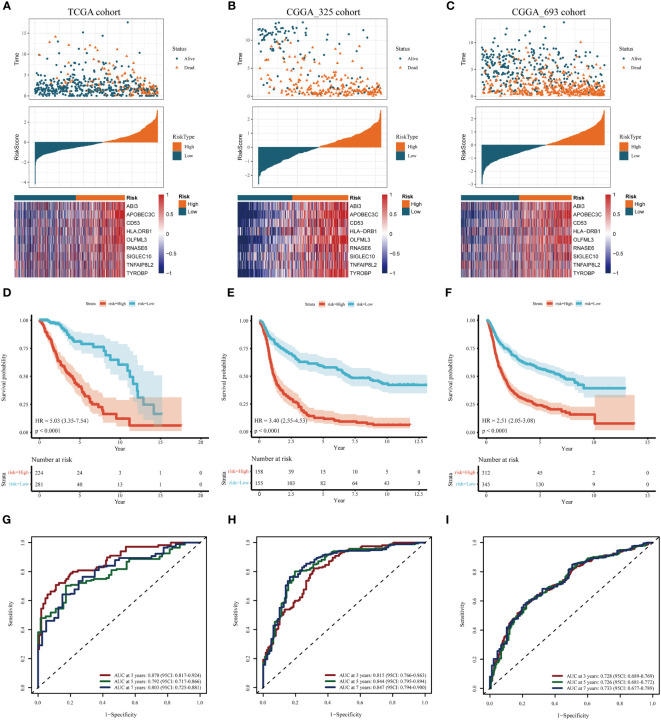
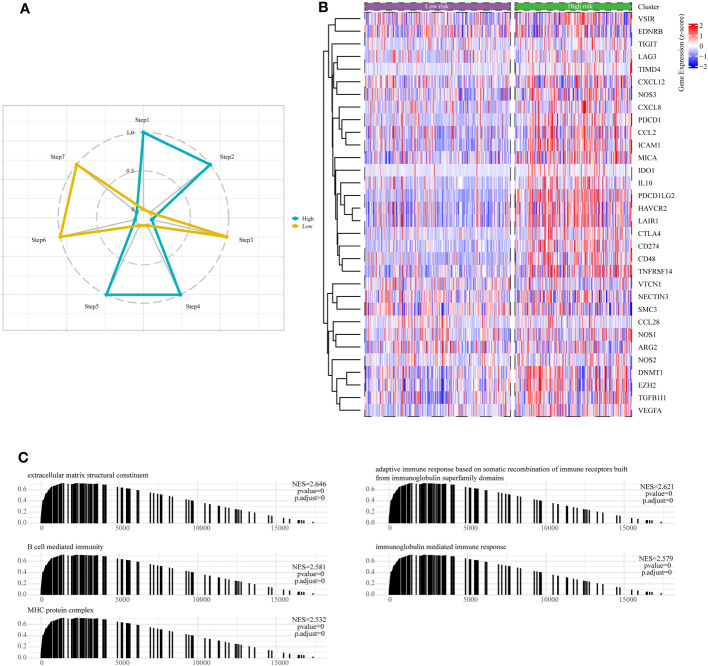
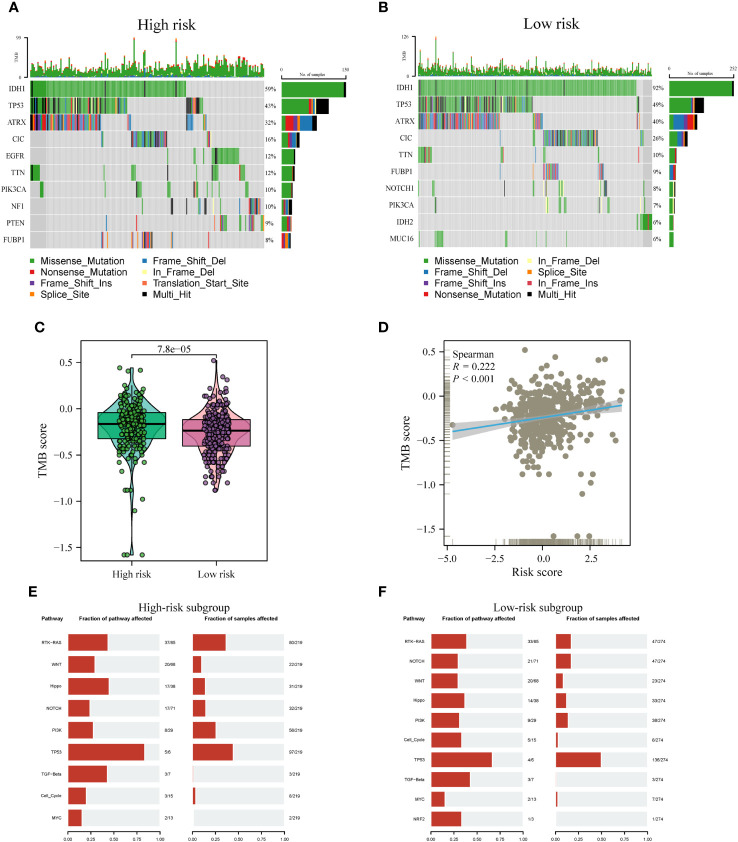
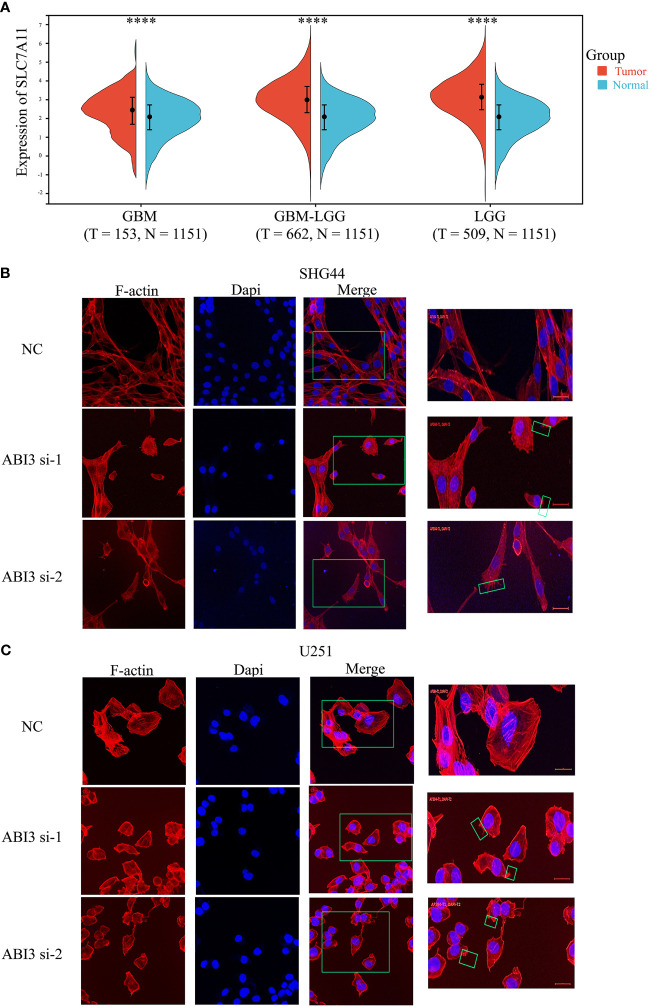
Results: The developed prognostic model successfully categorized LGG patients into two distinct risk groups: high and low. There was a noticeable difference in the time the groups survived, which was statistically significant. The model's predictive accuracy was substantiated through two independent external validation cohorts. Additional evaluations of the immune microenvironment and the potential for immunotherapy indicated that this risk classification could function as a practical roadmap for LGG treatment using immune-based therapies. Cellular experiments demonstrated that suppressing the crucial ABI3 gene in the predictive model significantly reduced the migratory and invasive abilities of both SHG44 and U251 cell lines while also triggering cytoskeletal retraction and increased cell pseudopodia.

Conclusion: The research suggests that the prognostic pattern relying on genes linked to disulfidptosis can provide valuable insights into the clinical outcomes, tumor characteristics, and immune alterations in patients with LGG. This could pave the way for early interventions and suggests that ABI3 might be a potential therapeutic target for disulfidptosis.

Keywords: ABI3; disulfidptosis; lower-grade glioma; prognostic signature; tumor microenvironment.


Conflict of interest statement

The authors declare that the research was conducted in the absence of any commercial or financial relationships that could be construed as a potential conflict of interest.

Figures

Figure 1
Figure 1
The flow diagram of this project.
Figure 2
Figure 2
Identifying hub genes related to disulfidptosis phenotype via Weighted Co-Expression Network Analysis (WGCNA). (A) Network topology across varied soft thresholding powers. The figure numerically annotates the specific soft thresholding powers applied. An approximate scale-free network topology was observed at a soft thresholding power of 4. (B) Dendrogram of gene clusters based on topological overlap dissimilarity. Associated module colors are denoted in the color column. Each colored column signifies a module comprising a cluster of co-expressed genes. Thirteen distinct modules were identified. (C) Relationship between module characterization genes and disulfidptosis scoring phenotypes. (D) Association scatterplot between Module Membership and Gene significance in the blue and brown modules.
Figure 3
Figure 3
Identifying the best predictive model through machine learning. (A) Differential expression analysis between lower-grade glioma (LGG) and normal tissue (GTEx database). (B) Acquisition of 39 essential disulfidptosis-associated genes (DAGs) after intersecting hub genes obtained in WGCNA and differentially expressed genes (DEGs). (C, D) LASSO algorithm identifies 19 important DAGs. (E, F) The SVM-RFE algorithm selected 16 authoritative DAGs. (G) The intersection of genes obtained in LASSO and SVM-RFE algorithms. (H) Construction of 9-DAG signature via Cox regression analysis.
Figure 4
Figure 4
Assessment and validation of the prognostic significance of risk score. (A–C) Distribution of risk scores, the status of patient survival, and the expression patterns of the nine DAGs included inside the signature in the TCGA training set and the two CGGA validation sets, respectively. (D–F) The Kaplan-Meier (KM) survival analysis in the TCGA training and the two CGGA validation sets, respectively. (G–I) The receiver operating characteristic (ROC) curve analysis in the TCGA training and the two CGGA validation cohorts, respectively.
Figure 5
Figure 5
Independent prognostic assessment of risk scores and clinical parameters, and drug susceptibility prediction. (A) Chi-Square test depicting clinical and pathological characteristics across high-risk and low-risk subgroups within the TCGA cohort. The graphical representation employs circles to delineate the statistical test outcomes. (B) Prognostic factors for patients with LGG in the TCGA cohort were identified via Univariate Cox regression analysis. (C) Independent prognostic factors were further determined by multifactorial Cox regression analysis. Drug sensitivity analysis of Dasatinib (D), Gemcitabine (E), PD0325901 (F), and Selumetinib (G) in patients with low and high risk scores. ***P< 0.001.
Figure 6
Figure 6
Developing and validating of nomogram based on risk scores. (A) Predicting 3-, 5-, and 7-year survival of LGG patients in the TCGA database using conventional nomogram. (B) The calibration curves for predicting 3-, 5- and 7-year overall survival (OS). (C) Decision curve analysis (DCA) for the nomogram in 3‐year OS. (D) Printscreen of the intuitive interface of the online dynamic nomogram for OS. *P < 0.05, ***P < 0.001.
Figure 7
Figure 7
Differential Gene Set Variant Analysis (GSVA) enrichment items for high-risk and low-risk subgroups. *P< 0.05, **P< 0.01, ***P< 0.001.
Figure 8
Figure 8
Analysis of immune traits in the training cohort. (A) Distribution patterns of 22 tumor-infiltrating immune cells in the training set. (B) Analysis of components in the tumor microenvironment (TME) between the two risk subgroups. (C) Expression patterns of immune checkpoint genes in the training cohort. (D) The Tumor Immune Dysfunction and Exclusion (TIDE) analysis between high-risk and low-risk subgroups of LGG patients in the training cohort. *P< 0.05, **P< 0.01, ***P< 0.001.
Figure 9
Figure 9
Assessment of anti-cancer immune activity between risk subgroups. (A) Differential analysis of anti-tumor immune activity in the seven-step tumor-immunity cycle between high and low-risk subgroups. (B) Heatmap showing the expression patterns of genes involved in the negative regulation of immune processes between high- and low-risk subgroups. (C) The Gene Set Enrichment Analysis (GSEA) reveals the underlying biological processes associated with the high- and low-risk subgroups.
Figure 10
Figure 10
Comparison of somatic mutations between risk subtypes. (A, B) Waterfall plots visualizing the top 10 most frequently mutated genes in the high-risk (A) and low-risk (B) subgroups. (C) Divergence in tumor mutational burden (TMB) levels across the high- and low-risk subgroups. (D) Correlativity betwixt TMB and risk scores. (E, F) Mutant oftenness of nine common oncogenic pathways between high- (E) and low-risk subgroups (F).
Figure 11
Figure 11
scRNA-Seq revealing the expression patterns of disulfidptosis-associated genes (DAGs) at the single-cell level. (A) The UMAP plot annotates the cells into six disparate cell types. (B, C) Violin plots (B) and UMPA (C) plots show dissimilar expression patterns of DAGs within the prognostic signature.
Figure 12
Figure 12
Analyzing and validating ABI3 expression. (A) Significantly higher mRNA levels of ABI3 in lower-grade glioma (LGG) and glioblastoma (GBM) tissues compared to normal tissues. (B) Survival analysis indicates that glioma patients with high ABI3 expression have a significantly worse prognosis. (C) Quantitative immunohistochemical (IHC) scores revealed significantly reduced ABI3 protein expression in paraneoplastic tissues compared to tumoral tissues. (D) Quantifying ABI3 protein expression across varied grades of diffuse glioma specimen via IHC. (E) Representative IHC images of ABI3 in diverse grades of glioma and peritumoral tissues. (F) The mRNA levels of ABI3 in six glioma cell lines (HGS683, SHG44, U251, LN229, U87 and A172). (G, H) Assessment of silencing efficiency of two ABI3-specific siRNAs via RT-qPCR (G) and Western blot (H) in SHG44 cell line. *P< 0.05, ***P< 0.001, ns indicates no significant difference.
Figure 13
Figure 13
ABI3 knockdown inhibiting the mobility of glioma cell lines. (A, B) The wound healing assay showed that ABI3 knockdown significantly inhibited the migration of SHG44 (A) and U251 cells (B). (C) The downregulation of ABI3 significantly reduced the invasion capabilities of SHG44 and U251 cells. (D, E) Correlation analysis betwixt ABI3 and Epithelial-mesenchymal transition (EMT) markers such as ZO-1 (D) and VIM (E) protein expression via Spearman’s method. (F, G) Western blot demonstrating changes in the expression of EMT markers (ZO-1 and VIM protein) in the SHG44 and U251 cells after knockdown of the ABI3 gene with siRNA. **P< 0.01, ***P< 0.001.
Figure 14
Figure 14
ABI3 involved in glioma cell disulfidptosis. (A) Detecting the expression of the SLC7A11 gene in glioma tissues via Sangerbox 3.0 Website. (B, C) Confocal images showing cytoskeletal contraction and lamellipodia formation labeled by Phalloidin after silencing of ABI3 in SHG44 (B) and U251 cells (C). Blue: cell nucleus labeled by DAPI; Red: F-actin labeled by Phalloidin; Green box: the phenomenon of cytoskeletal contraction and lamellipodia formation. ****P< 0.0001.

Similar articles

Cited by

References

    1. Ostrom QT, Gittleman H, Farah P, Ondracek A, Chen Y, Wolinsky Y, et al. . CBTRUS statistical report: Primary brain and central nervous system tumors diagnosed in the United States in 2006-2010. Neuro Oncol (2013) 15 Suppl 2(Suppl 2):ii1–56. doi: 10.1093/neuonc/not151 - DOI - PMC - PubMed
    1. Youssef G, Miller JJ. Lower grade gliomas. Curr Neurol Neurosci Rep (2020) 20(7):21. doi: 10.1007/s11910-020-01040-8 - DOI - PMC - PubMed
    1. Louis DN, Perry A, Reifenberger G, von Deimling A, Figarella-Branger D, Cavenee WK, et al. . The 2016 world health organization classification of tumors of the central nervous system: a summary. Acta Neuropathol (2016) 131(6):803–20. doi: 10.1007/s00401-016-1545-1 - DOI - PubMed
    1. Peng YH, Richard SA, Lan Z, Zhang Y. Radiation induced glioma in a sexagenarian: A case report. Med (Baltimore) (2021) 100(16):e25373. doi: 10.1097/md.0000000000025373 - DOI - PMC - PubMed
    1. Jiang T, Mao Y, Ma W, Mao Q, You Y, Yang X, et al. . CGCG clinical practice guidelines for the management of adult diffuse gliomas. Cancer Lett (2016) 375(2):263–73. doi: 10.1016/j.canlet.2016.01.024 - DOI - PubMed

Publication types

Substances

LinkOut - more resources