KLF17 is an important regulatory component of the transcriptomic response of Atlantic salmon macrophages to Piscirickettsia salmonis infection
- PMID: 38162669
- PMCID: PMC10755876
- DOI: 10.3389/fimmu.2023.1264599
KLF17 is an important regulatory component of the transcriptomic response of Atlantic salmon macrophages to Piscirickettsia salmonis infection
Abstract
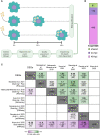
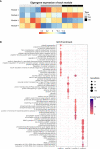
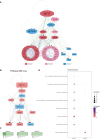
Piscirickettsia salmonis is the most important health problem facing Chilean Aquaculture. Previous reports suggest that P. salmonis can survive in salmonid macrophages by interfering with the host immune response. However, the relevant aspects of the molecular pathogenesis of P. salmonis have been poorly characterized. In this work, we evaluated the transcriptomic changes in macrophage-like cell line SHK-1 infected with P. salmonis at 24- and 48-hours post-infection (hpi) and generated network models of the macrophage response to the infection using co-expression analysis and regulatory transcription factor-target gene information. Transcriptomic analysis showed that 635 genes were differentially expressed after 24- and/or 48-hpi. The pattern of expression of these genes was analyzed by weighted co-expression network analysis (WGCNA), which classified genes into 4 modules of expression, comprising early responses to the bacterium. Induced genes included genes involved in metabolism and cell differentiation, intracellular transportation, and cytoskeleton reorganization, while repressed genes included genes involved in extracellular matrix organization and RNA metabolism. To understand how these expression changes are orchestrated and to pinpoint relevant transcription factors (TFs) controlling the response, we established a curated database of TF-target gene regulatory interactions in Salmo salar, SalSaDB. Using this resource, together with co-expression module data, we generated infection context-specific networks that were analyzed to determine highly connected TF nodes. We found that the most connected TF of the 24- and 48-hpi response networks is KLF17, an ortholog of the KLF4 TF involved in the polarization of macrophages to an M2-phenotype in mammals. Interestingly, while KLF17 is induced by P. salmonis infection, other TFs, such as NOTCH3 and NFATC1, whose orthologs in mammals are related to M1-like macrophages, are repressed. In sum, our results suggest the induction of early regulatory events associated with an M2-like phenotype of macrophages that drives effectors related to the lysosome, RNA metabolism, cytoskeleton organization, and extracellular matrix remodeling. Moreover, the M1-like response seems delayed in generating an effective response, suggesting a polarization towards M2-like macrophages that allows the survival of P. salmonis. This work also contributes to SalSaDB, a curated database of TF-target gene interactions that is freely available for the Atlantic salmon community.
Keywords: Atlantic salmon; Piscirickettsia salmonis; gene regulatory network; host-pathogen interaction; macrophage polarization.
Copyright © 2023 Pérez-Stuardo, Frazão, Ibaceta, Brianson, Sánchez, Rivas-Pardo, Vallejos-Vidal, Reyes-López, Toro-Ascuy, Vidal and Reyes-Cerpa.
Conflict of interest statement
The authors declare that the research was conducted in the absence of any commercial or financial relationships that could be construed as a potential conflict of interest.
Figures


Similar articles
-
Non-lysosomal Activation in Macrophages of Atlantic Salmon (Salmo salar) After Infection With Piscirickettsia salmonis.Front Immunol. 2019 Mar 19;10:434. doi: 10.3389/fimmu.2019.00434. eCollection 2019. Front Immunol. 2019. PMID: 30941123 Free PMC article.
-
Transcriptome Profiling of Atlantic Salmon (Salmo salar) Parr With Higher and Lower Pathogen Loads Following Piscirickettsia salmonis Infection.Front Immunol. 2021 Dec 31;12:789465. doi: 10.3389/fimmu.2021.789465. eCollection 2021. Front Immunol. 2021. PMID: 35035387 Free PMC article.
-
Multiple tissue transcriptomic responses to Piscirickettsia salmonis in Atlantic salmon (Salmo salar).Physiol Genomics. 2011 Nov 7;43(21):1241-54. doi: 10.1152/physiolgenomics.00086.2011. Epub 2011 Aug 30. Physiol Genomics. 2011. PMID: 21878610
-
Alternative splicing in Atlantic salmon head kidney and SHK-1 cell line during the Piscirickettsia salmonis infection: A comparative transcriptome survey.Fish Shellfish Immunol. 2023 Nov;142:109127. doi: 10.1016/j.fsi.2023.109127. Epub 2023 Oct 9. Fish Shellfish Immunol. 2023. PMID: 37813155
-
Transcriptional response of Atlantic salmon families to Piscirickettsia salmonis infection highlights the relevance of the iron-deprivation defence system.BMC Genomics. 2015 Jul 4;16(1):495. doi: 10.1186/s12864-015-1716-9. BMC Genomics. 2015. PMID: 26141111 Free PMC article.
Cited by
-
Gene expression responses revealing immune mechanisms in tambaqui (Colossoma macropomum) during the early phase of acute Flavobacterium oreochromis infection.Mol Biol Rep. 2025 Jun 18;52(1):611. doi: 10.1007/s11033-025-10703-z. Mol Biol Rep. 2025. PMID: 40531249
-
Salmon-IgM Functionalized-PLGA Nanosystem for Florfenicol Delivery as an Antimicrobial Strategy against Piscirickettsia salmonis.Nanomaterials (Basel). 2024 Oct 16;14(20):1658. doi: 10.3390/nano14201658. Nanomaterials (Basel). 2024. PMID: 39452994 Free PMC article.
References
-
- Branson EJ, Nieto-Diaz Muñoz D. Description of a new disease condition occurring in farmed coho salmon, Oncorhynchus kisutch (Walbaum), in South America. J Fish Dis (1991) 14:147–56. doi: 10.1111/j.1365-2761.1991.tb00585.x - DOI
-
- Cvitanich JD, Garate N O, Smith CE. The isolation of a rickettsial-like organism causing disease and mortality in Chilean salmonids and its confirmation by Koch’s postulate. J Fish Dis (1991) 14:121–45. doi: 10.1111/j.1365-2761.1991.tb00584.x - DOI
-
- Sernapesca . Informe Sanitario de la salmonicultura Primer Semestre año 2022, Departamento de salud animal, Subdirección de acuicultura. Departamento de Salud Animal, Subdirección de Acuicultura, Servicio Nacional de Pesca: Valparaíso, Chile: (2022).
Publication types
MeSH terms
Substances
Supplementary concepts
LinkOut - more resources
Full Text Sources
Miscellaneous

