. 2023 Dec 27:16:4215-4231.
doi: 10.2147/DMSO.S445341. eCollection 2023.

Urinary PART1 and PLA2R1 Could Potentially Serve as Diagnostic Markers for Diabetic Kidney Disease Patients

Affiliations

Urinary PART1 and PLA2R1 Could Potentially Serve as Diagnostic Markers for Diabetic Kidney Disease Patients

Qinglin Ye et al. Diabetes Metab Syndr Obes. .

Abstract

Background: Diabetic kidney disease (DKD) is a chronic renal disease which could eventually develop into renal failure. Though albuminuria and estimated glomerular filtration rate (eGFR) are helpful for the diagnosis of DKD, the lack of specific biomarkers reduces the efficiency of therapeutic interventions.

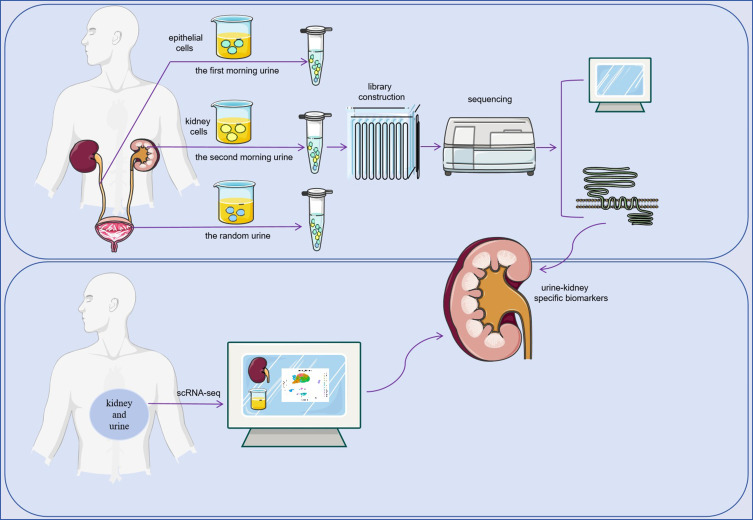
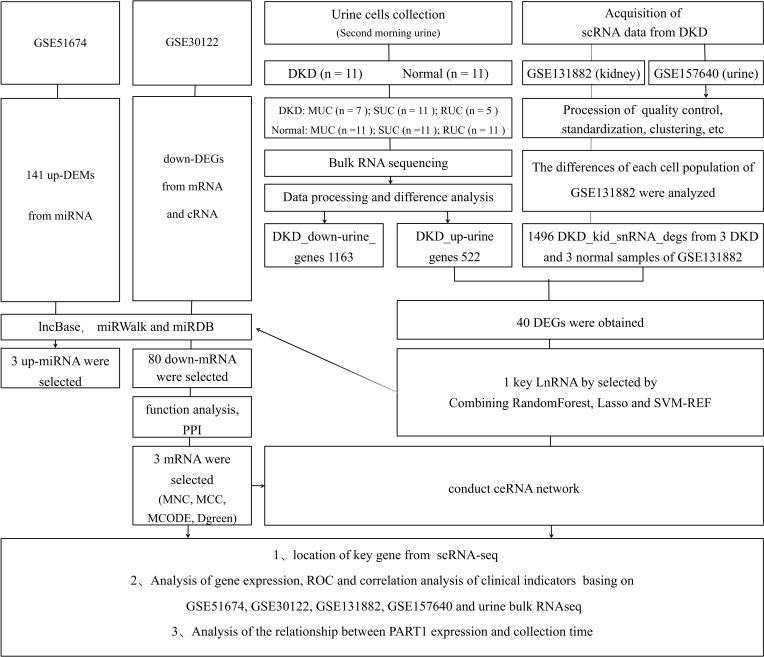
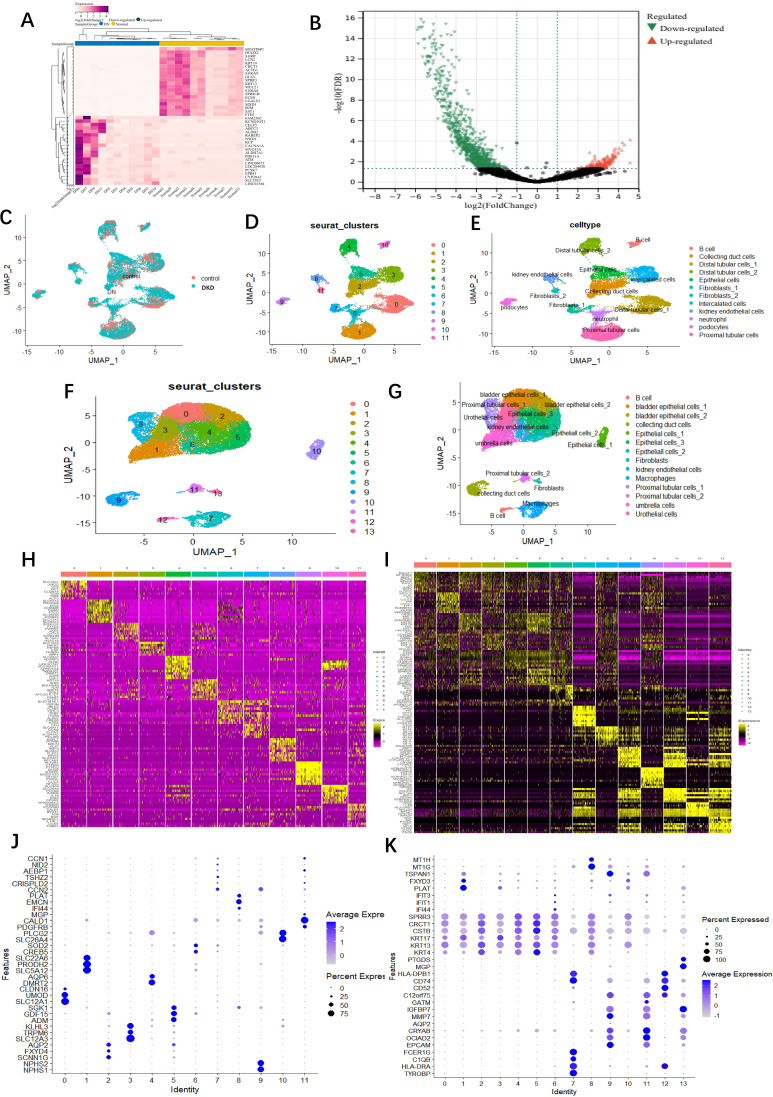
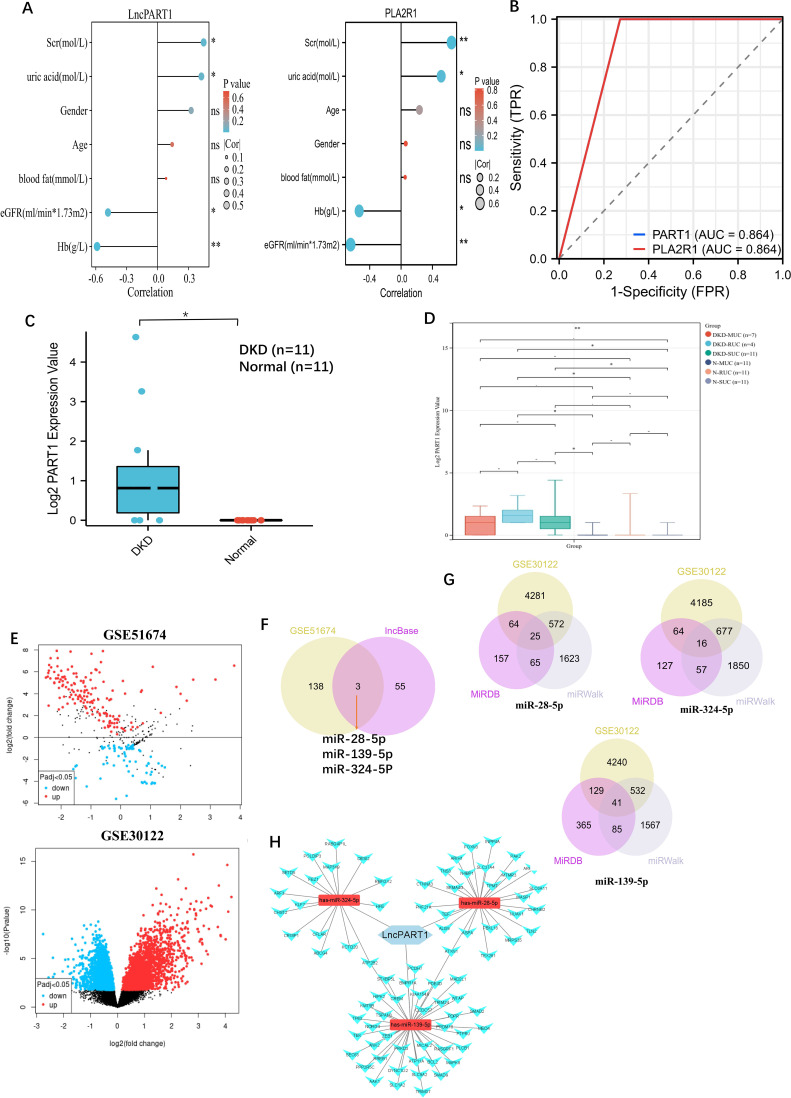
Methods: Based on bulk-seq of 56 urine samples collected at different time points (including 11 acquired from DKD patients and 11 from healthy controls), in corporation of scRNA-seq data of urine samples and snRNA-seq data of renal punctures from DKD patients (retrieved from NCBI GEO Omnibus), urine-kidney specific genes were identified by Multiple Biological Information methods.

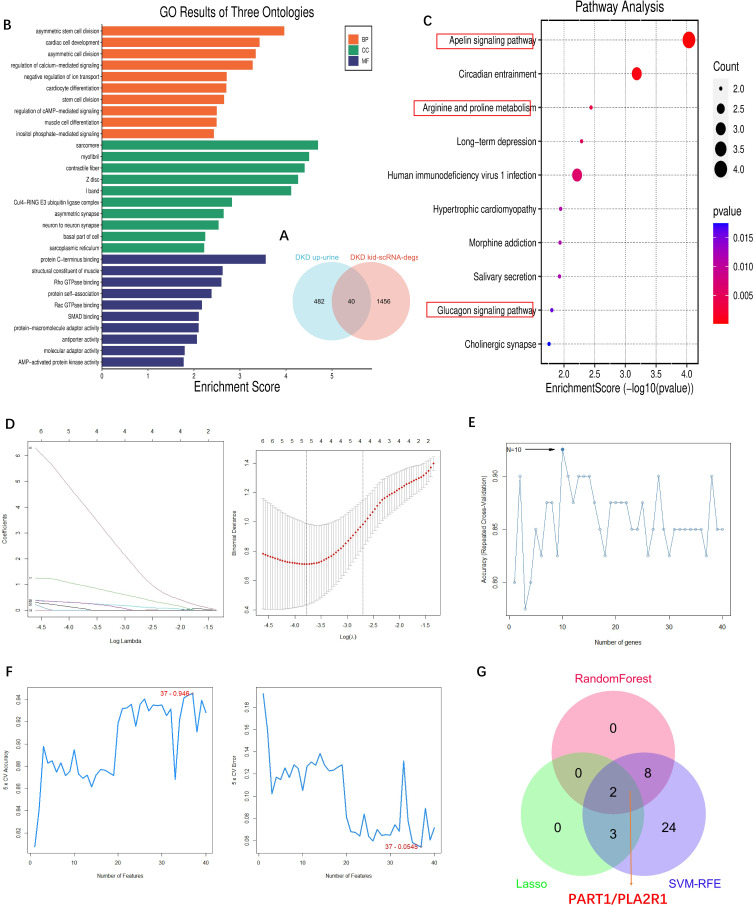
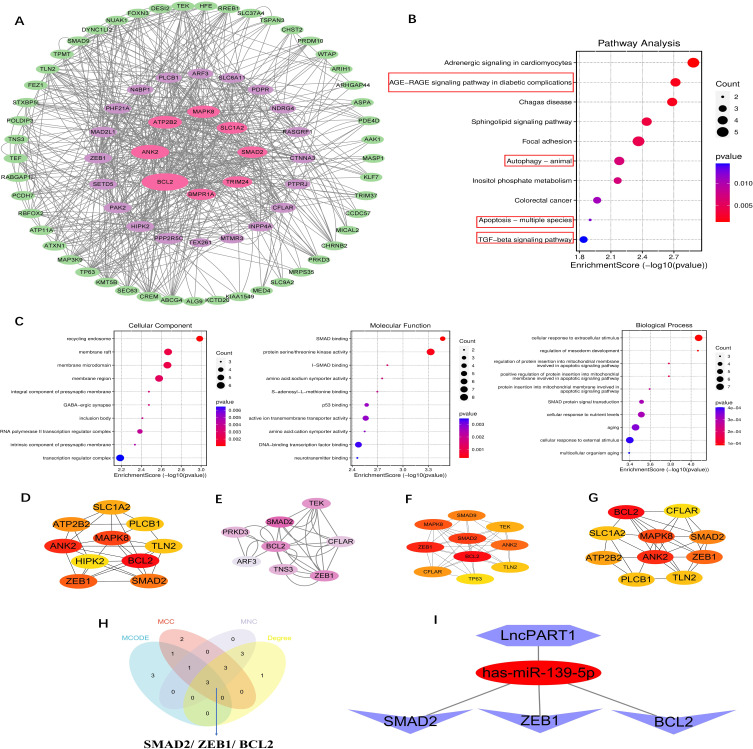
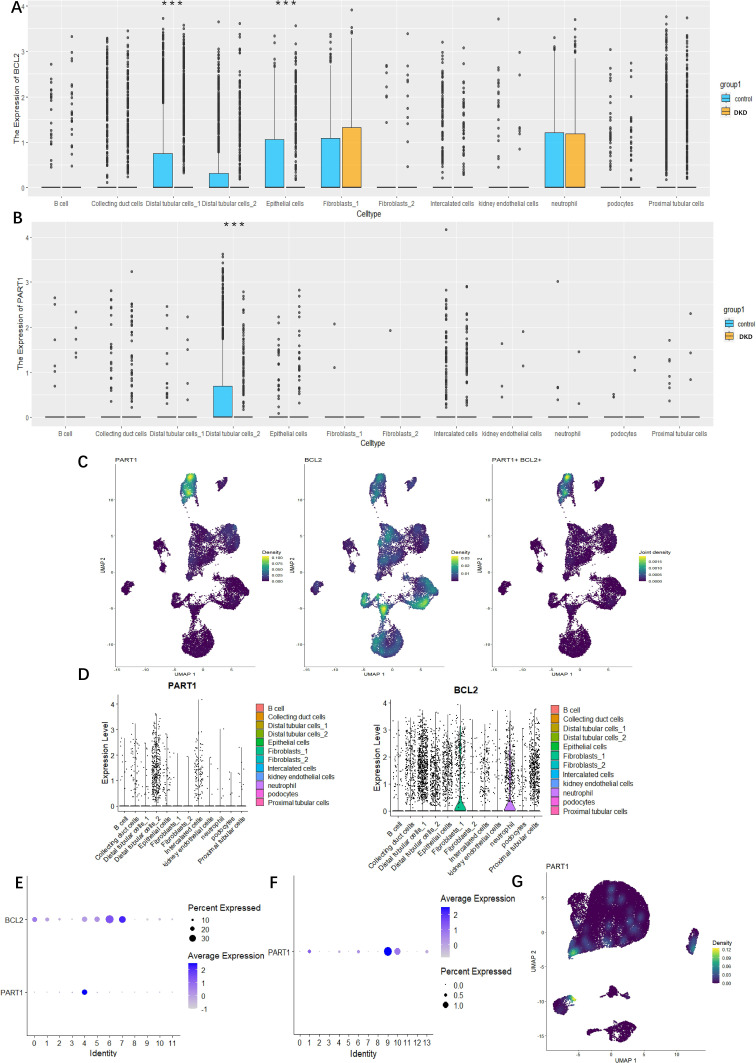
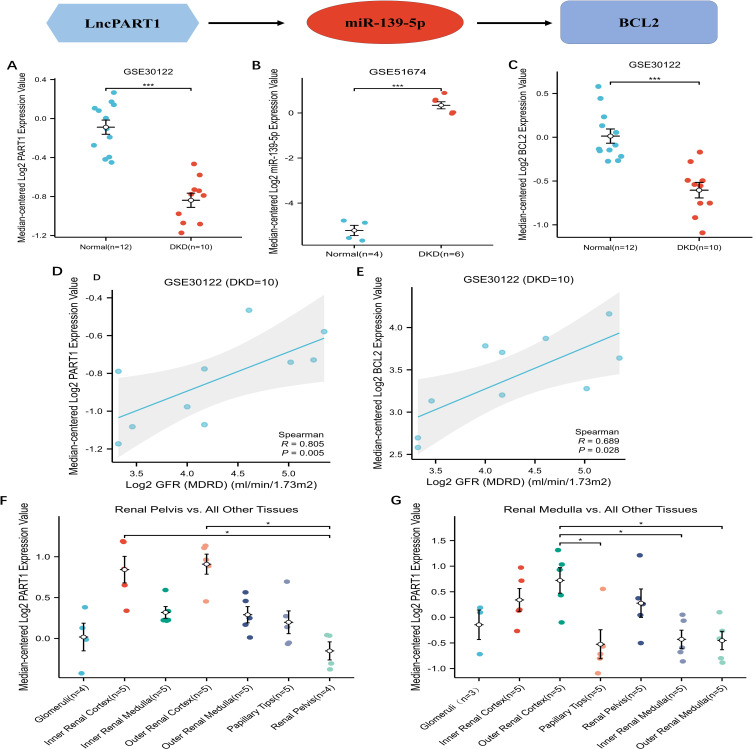
Results: Forty urine-kidney specific genes/differentially expressed genes (DEGs) were identified to be highly related to kidney injury and proteinuria for the DKD patients. Most of these genes participate in regulating glucagon and apoptosis, among which, urinary PART1 (mainly derived from distal tubular cells) and PLA2R1 (podocyte cell surface marker) could be used together for the early diagnosis of DKD. Moreover, urinary PART1 was significantly associated with multiple clinical indicators, and remained stable over time in urine.

Conclusion: Urinary PART1 and PLA2R1 could be shed lights on the discovery and development of non-invasive diagnostic method for DKD, especially in early stages.

Keywords: biomarker; diabetic kidney disease; diagnosis; non-invasive; urine.


Conflict of interest statement

The authors report no conflicts of interest in this work.

Figures

None
Graphical abstract
Figure 1
Figure 1
Workflow Diagram.
Figure 2
Figure 2
Analysis of urine bulking RNA-seq data and two scRNA-seq data from DKD. (A) Expression heatmap of the top 40 urine-DEGs. (B) Volcano plot of urine- DEGs between DKD patients and control. (C) Sample source of each cell cluster analyzed by UMAP. Blue indicates the DKD origin and pink shows the cells originated from normal. (D and E) UMAP plots of DKD kidney snRNA-seq data from GSE131882 reveal 12 individual cell clusters and cell types (cluster 0 and 4: Distal tubular cells; cluster 1: Proximal tubular cells; cluster 2: Collecting duct cells; cluster 3: Intercalated cells; cluster 5: Epithelial cells; cluster 6: Neutrophil; cluster 7 and 11: Fibroblasts; cluster 8: Kidney endothelial cells; cluster 9: Podocytes; cluster 10: B cell). (F and G) UMAP plots of DKD urine scRNA-seq data from GSE157640 reveal 14 individual cell clusters and cell types (cluster 0 and 2: Bladder epithelial cells; cluster 1: Umbrella cells; cluster 3: Urothelial cells; cluster 4, 5 and 10: Epithelial cells; cluster 6: Kidney endothelial cells; cluster 7: Macrophages; cluster 8 and 11: Proximal tubular cells; cluster 9: Collecting duct cell; cluster 12: B cell; cluster 13: Fibroblasts). Principal component heatmap plot revealing 10 most highly expressed genes in each of clusters (vertical columns), including (H) GSE131882 and (I) GSE157640. Each row representing 1 gene, with high expression (yellow), intermediate expression (purple), and low expression (black). Bubble dot plots of the top cell-type-specific differentially expressed genes in the (J) DKD kidney snRNA-seq data from GSE131882 and (K) DKD urine scRNA-seq data from GSE157640. The size of the dot indicates the expression percentage and the darkness of the color indicates average expression.
Figure 3
Figure 3
Screening and analysis of upregulated urine-DEGs and obtained key DKD urine biomarkers. (A) Venn diagram of 40 upregulated urine-DEGs. Obtained based on the intersection all DKD kid-scRNA-degs and DKD up-urine DEGs. (B) GO enrichment analysis of EP-Genes in BP, CC, and MF processes (BP, biological process; CC, cellular component; MF, molecular function). (C) KEGG enrichment analysis of 40 upregulated urine-DEGs. In the dot plot, the color represents the p-value, and the size of the spots represents the gene number.The red boxes indicated pathways associated with the development of DKD. (DF) DKD urine key genes selection by (D) Lasso, (E) RandomForest and (F) SVM-RFE. (G) Venn diagram shows 2 urine key genes such as PART1 and PLA2R1 were obtained by the intersection of 3 machine-learning (Lasso, RandomForest and SVM-RFE).
Figure 4
Figure 4
Urinary PART1/PLA2R1 analysis in urine from DKD and set up ceRNA network. (A) Correlation analysis of urinary PART1and PLA2R1 expression with the clinicopathological features, including estimated glomerular filtration rate (eGFR), age, serum creatinine (Scr), hemoglobin (Hb), bloom fat and gender. (B) The diagnostic value of Urinary PART1 and PLA2R1 in the urine of DKD. (C) The expression level of PART1 between DKD and normal in urine. (D) Analysis of PART1 expression at different time periods including the first morning urinary cells (MUC), second morning urinary cells (SUC) and random urinary cells (RUC).(E) Volcano plot of DEMs between 6 DKD patients and 4 control from GSE51674, and DEGs between 10 DKD patients and 12 control from GSE30122 (volcano plot from GEO2R online tool at NCBI GEO Omnibus). (F) Three miRNA were obtained by intersecting upregulate difference miRMA (DEMs) from GSE51674 and targeted miRNAs based lncBase.(G) 80 overlapped mRNA DEGs (mDEGs) were obtained by intersecting downregulate difference mRMA (down-DEGs) from GSE30122 and targeted mRNAs based miRWalk and miRDB. (H) Triple regulatory network of the 80 overlapped DEGs, 3 overlapped DEMs, and lncPART1. (*P < 0.05, **P < 0.01 and ns: no significant difference).
Figure 5
Figure 5
Analysis of overlapped mDEGs and screening of key mRNA. (A) Construction of the PPI network of 80 overlapped DEGs by STRING database. (B) KEGG enrichment analysis of 80 overlapped mDEGs. The red boxes indicated pathways associated with the development of DKD. (C) GO enrichment analysis of overlapped mDEGs in BP, CC, and MF processes (BP, biological process; CC, cellular component; MF, molecular function). In the dot plot, the color represents the p-value, and the size of the spots represents the gene number. (D) Top 10 genes were selected according to the score calculated by the Degree method. (E) Total of 8 candidate genes were identified from 80 overlapped mDEGs basing on the score sorted by the MCODE method using Cytoscape. (F) Top 10 genes were obtained by calculating the scores according to the MCC method. (G) Top 10 genes were obtained by calculating the scores according to the MNC method. (H) Venn diagram shows 3 mRNA were obtained by the intersection of the methods (MCC, Degree, MNC and MCODE). (I) The important components of ceRNA network were identified by expression regulation.
Figure 6
Figure 6
PART1 of analyzing and locating based on scRNA-seq datasets from GSE131882 and GSE157640, respectively. (A) Box plots showing the the expression of BCL2 between DKD group and Normal group from GSE131882. (B) Box plots showing the the expression of BCL2 between DKD group and normal group from GSE131882. (C) UMAP plots showing the the expression of PART1, BCL2 and PART1+ and BCL2+ between 3 kidney tissues of DKD and 3 normal kidney tissues of DKD from GSE131882. (D) The violin plots showing the distribution and expression of PART1 and BCL2 in each cell type from GSE131882. (E and F) Bubble dot plots showing PART1 expressing in (E) kidney snRNA-seq of DKD from GSE131882 and (F) urine scRNA-seq of DKD from GSE157640, respectively. The size of the dot indicates the expression percentage and the darkness of the color indicates average expression. (G) Visualization of PART1 expression across all single cells in the UMPA plot of urne scRNA-seq from GSE157640. (***P < 0.001).
Figure 7
Figure 7
Analysis and verify of the key genes of ceRNA network. (AC) The expression levels of (A) PART1 from GES30122, (B) has-miR139-5p from GSE51674 and (C) BCL2 from GSE30122. (D and E) The diagnostic value of (D) PART1 and (E) BCL2 according to AUC value in ROC curve based on GSE30122. (F) The expression of PART1 between renal pelvis and all other renal tissue based on nephroseq V5. (G) The expression of PART1 between renal medulla and all other renal tissue based on nephroseq V5. (*P < 0.05 and ***P < 0.001).

Similar articles

Cited by

References

    1. Zhai Y, Cao X, Liu S, Shen Y. The diagnostic value of lipoprotein-associated phospholipase A2 in early diabetic nephropathy. Ann Med. 2023;55(2):2230446. doi:10.1080/07853890.2023.2230446 - DOI - PMC - PubMed
    1. ElSayed NA, Aleppo G, Aroda VR, et al. 2. classification and diagnosis of diabetes: standards of care in diabetes-2023. Diabetes Care. 2023;46(Suppl 1):S19–S40. doi:10.2337/dc23-S002 - DOI - PMC - PubMed
    1. Krolewski AS. Progressive renal decline: the new paradigm of diabetic nephropathy in type 1 diabetes. Diabetes Care. 2015;38(6):954–962. doi:10.2337/dc15-0184 - DOI - PMC - PubMed
    1. Rigalleau V, Lasseur C, Raffaitin C, et al. Normoalbuminuric renal-insufficient diabetic patients: a lower-risk group. Diabetes Care. 2007;30(8):2034–2039. doi:10.2337/dc07-0140 - DOI - PubMed
    1. Colhoun HM, Marcovecchio ML. Biomarkers of diabetic kidney disease. Diabetologia. 2018;61(5):996–1011. doi:10.1007/s00125-018-4567-5 - DOI - PMC - PubMed